Double SMA Indicator
- Indicadores
- Cedric Jean Guy Pisson
- Versão: 1.0
- Ativações: 5
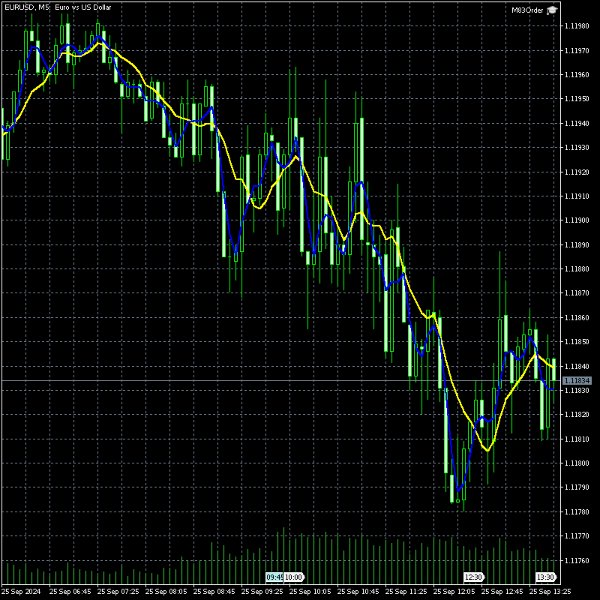
This algorithm is a custom indicator for MetaTrader 5 (MT5) that plots two simple moving averages (SMA) on a financial chart to assist in the technical analysis of price movements. Here's what the algorithm does:
-
Two Simple Moving Averages (SMA):
- The indicator uses two different SMA periods:
- The first SMA (SMA1) has a longer period, set to 8 periods by default (SMA 8).
- The second SMA (SMA2) has a shorter period, set to 3 periods by default (SMA 3).
- The indicator uses two different SMA periods:
-
Calculation of the Moving Averages:
- For each defined period, it calculates the average of the closing prices of the previous candles over a certain number of periods.
- For example, for SMA8, the algorithm adds up the closing prices of the last 8 candles and divides the sum by 8 to get the moving average value.
-
Visual Display:
- It plots two lines on the chart:
- A blue line for SMA8 (longer period).
- A red line for SMA3 (shorter period).
- The lines have a thickness of 2 pixels for better visibility.
- It plots two lines on the chart:
-
Purpose of the Indicator:
- This indicator helps traders visualize short- and medium-term price trends by comparing the two moving averages. When the red line (SMA3) crosses above or below the blue line (SMA8), it can be interpreted as a trading signal:
- An upward crossover of the red line above the blue line can indicate a buy signal.
- A downward crossover can indicate a sell signal.
- This indicator helps traders visualize short- and medium-term price trends by comparing the two moving averages. When the red line (SMA3) crosses above or below the blue line (SMA8), it can be interpreted as a trading signal:
In summary:
This algorithm is a double SMA indicator used to identify trends or trading signals based on the crossovers of simple moving averages with different periods (8 and 3).


