Macd Kolay Al Sat
- Indicadores
- Hasan Mecit
- Versão: 1.0
- Ativações: 5
Certainly. Here's the explanation in English:
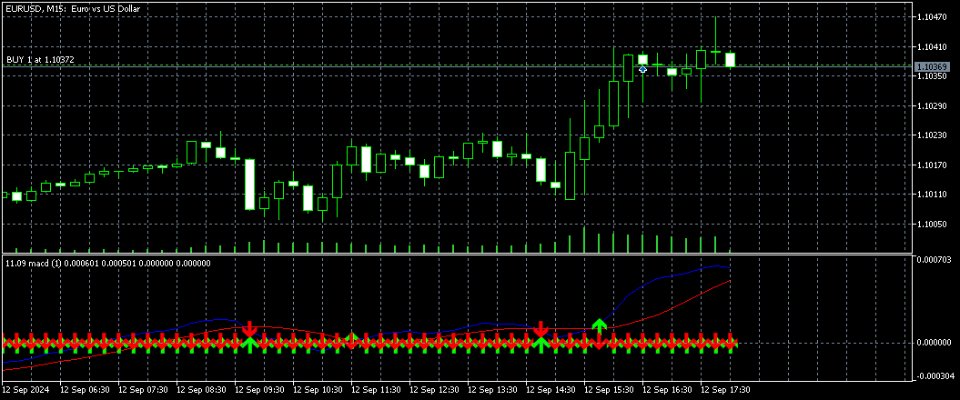
This program is a custom indicator that calculates the MACD (Moving Average Convergence Divergence) and shows the crossovers between the MACD and Signal lines. Here are the main functions of the program:
-
MACD Calculation:
- Calculates the difference between the Fast EMA (Exponential Moving Average) and Slow EMA.
- This difference forms the MACD line.
-
Signal Line Calculation:
- Creates the Signal line by taking a simple moving average (SMA) of the MACD values.
-
Indicator Drawing:
- Draws the MACD line in blue.
- Draws the Signal line in red.
- Calculates a histogram showing the difference between MACD and Signal lines (though this is not plotted).
-
Crossover Detection and Marking:
- Places a green up arrow at points where the MACD line crosses above the Signal line (Bullish Crossover).
- Places a red down arrow at points where the MACD line crosses below the Signal line (Bearish Crossover).
-
Separate Window Display:
- The indicator is displayed in a separate window below the main price chart.
-
Parameters:
- Users can adjust the periods for Fast EMA, Slow EMA, and Signal SMA.
This indicator can be used to identify trend changes and potential buy/sell points:
- Green up arrow (Bullish Crossover): MACD crossing above the Signal line may indicate the beginning of an uptrend and a potential buying opportunity.
- Red down arrow (Bearish Crossover): MACD crossing below the Signal line may indicate the beginning of a downtrend and a potential selling opportunity.

