UTBot with HTS filter
- Indicadores
- Bartlomiej Tadeusz Tomaja
- Versão: 1.1
- Atualizado: 6 setembro 2024
- Ativações: 5
Advanced UT Bot & HTS Indicator
This indicator is an advanced technical analysis tool that combines two methods: UT Bot and HTS (Higher Timeframe Smoothing), to generate accurate buy and sell signals.
1. Indicator Structure
- Works within the main chart window and utilizes 11 buffers to store various data points, including arrows (buy/sell signals) and bands from both UT Bot and HTS systems.
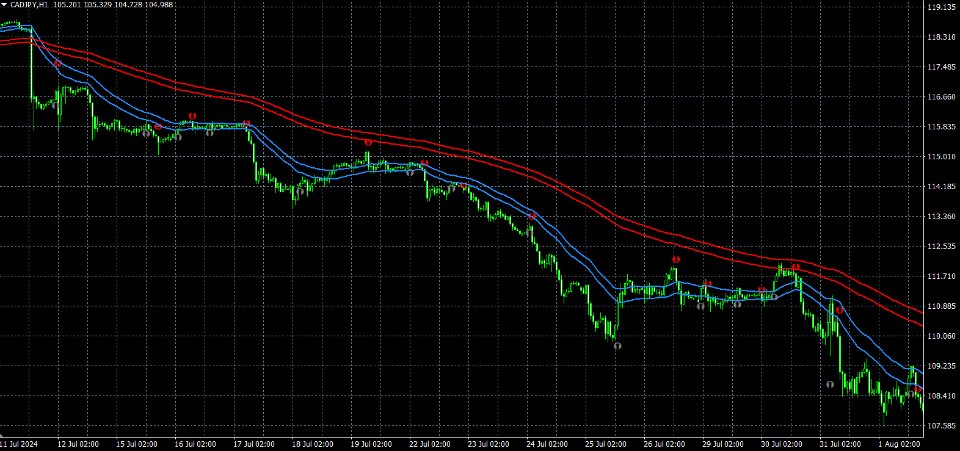
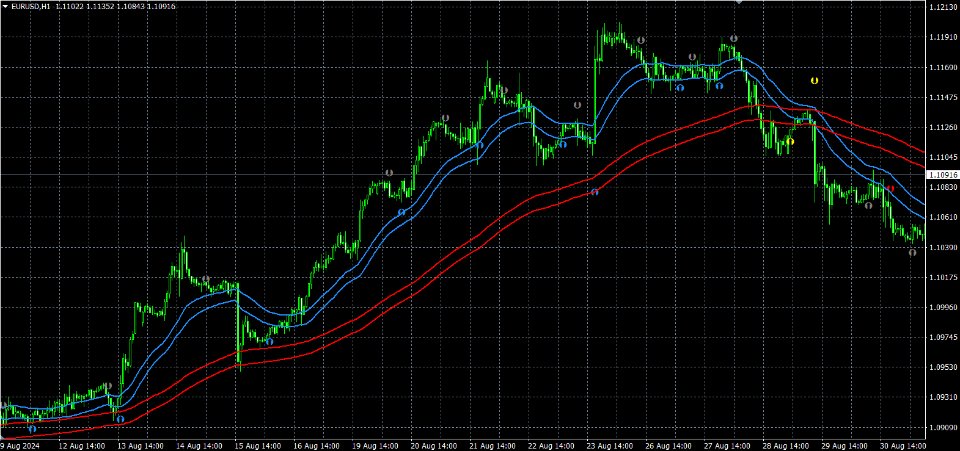
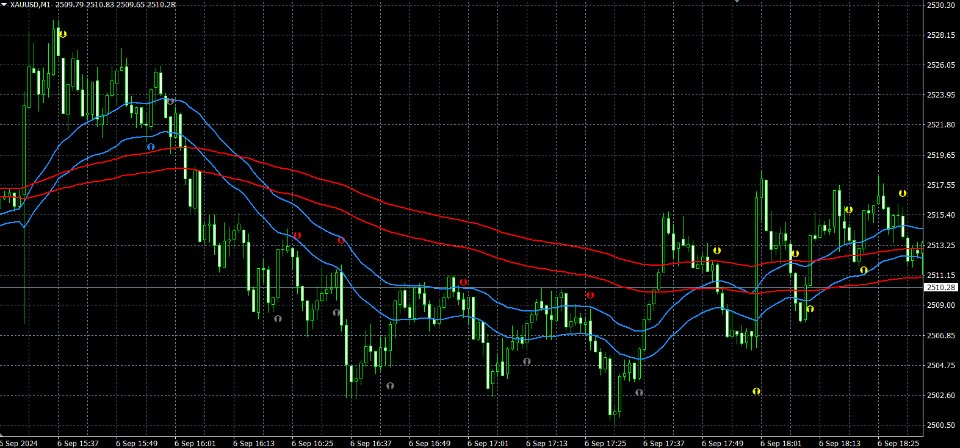
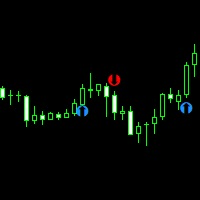
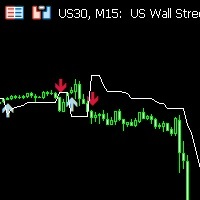
- Uses colored arrows to represent different trading conditions:
- Blue arrows: Normal buy signals.
- Red arrows: Normal sell signals.
- Gray arrows: Opposing signals (conflicting with the trend).
- Yellow arrows: Band crossing signals, indicating possible consolidation or transition phases.
2. Core Logic
- UT Bot: Utilizes ATR (Average True Range) to calculate trailing stops and generate buy/sell signals based on price crossovers. This helps identify emerging trends.
- HTS (Higher Timeframe Smoothing): Calculates fast and slow EMA (Exponential Moving Average) bands for both high and low prices:
- Fast Upper/Lower Bands: Reflect short-term trends.
- Slow Upper/Lower Bands: Represent long-term trends.
- The relationship between these bands helps traders detect market trends and spot potential entry/exit points.
3. Advantages
- Clear Visual Signals: The use of colored arrows makes it easy to interpret buy/sell signals based on UT Bot and HTS systems.
- Yellow Arrows warn of band crossings, signaling possible trend reversals or consolidations.
- Gray Arrows indicate conflicting signals, helping traders avoid false signals in uncertain market conditions.
- Comprehensive Trend Analysis: The combination of short-term (fast EMA) and long-term (slow EMA) trend analysis provides a well-rounded view of the market.
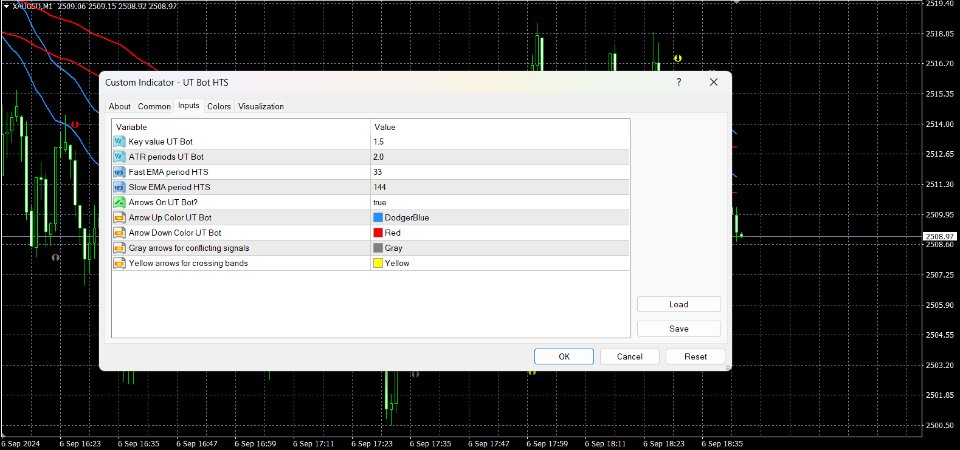
- Customizable: Key parameters like EMA periods and ATR multipliers can be adjusted to fit various trading strategies and timeframes.
- Dual Trend Detection: The combination of UT Bot and HTS improves trend detection accuracy, reducing false signals and enhancing trading decisions.
In summary, this indicator offers a multi-layered approach to trend identification and signal generation, providing clear visual cues and customizable parameters for optimized trading decisions.

