• Visão global
  • Comentários
  • Discussão (1)

Volatility Line Signals

O indicador desenvolvido para a negociação utiliza a volatilidade do mercado, permitindo prever os movimentos dos preços logo no início.
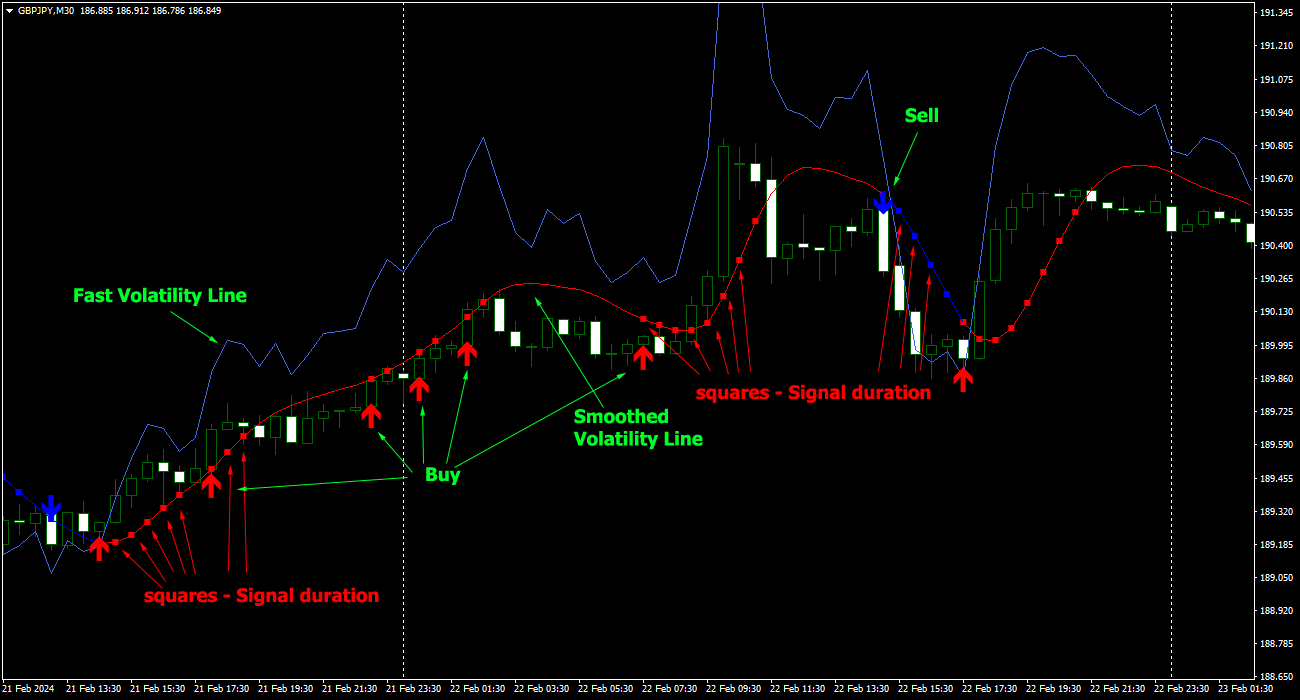
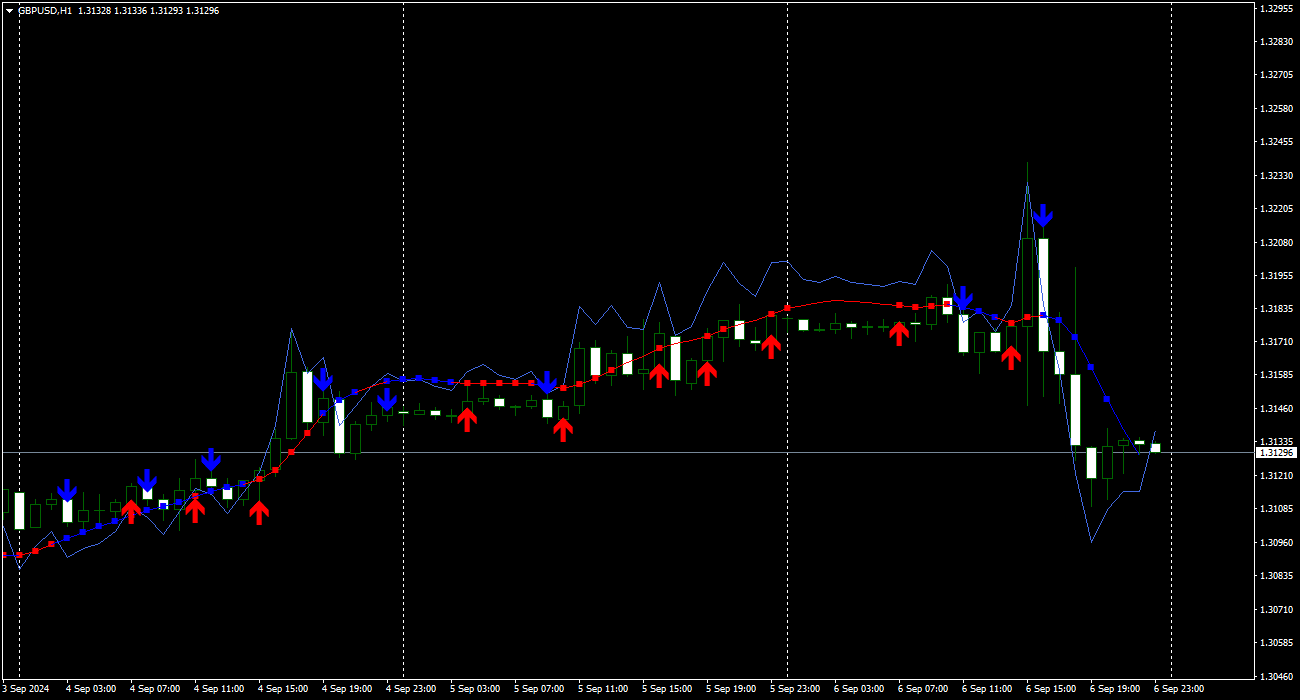
Ao ler a volatilidade e a dinâmica dos preços, constrói duas linhas, rápida e suave. Quando a linha rápida cruza a linha suave, o movimento da tendência altera-se.
Os sinais não aparecem no momento em que as linhas se cruzam, mas sim com um indicador adicional gerado por um gerador de sinais baseado no movimento da linha rápida.
Se a linha rápida estiver acima da linha suavizada, a tendência é de alta; se a linha rápida estiver abaixo da linha suavizada, a tendência é de baixa.
A seta sinalizadora aparece no momento em que a vela fecha e nunca desaparecerá ou será completada na vela anterior.
Após a formação das setas de sinal, o indicador monitoriza a duração deste sinal, desenhando quadrados na linha suavizada à medida que o preço se move. Quando os quadrados deixam de aparecer, ocorre o fim do sinal.

Descrição

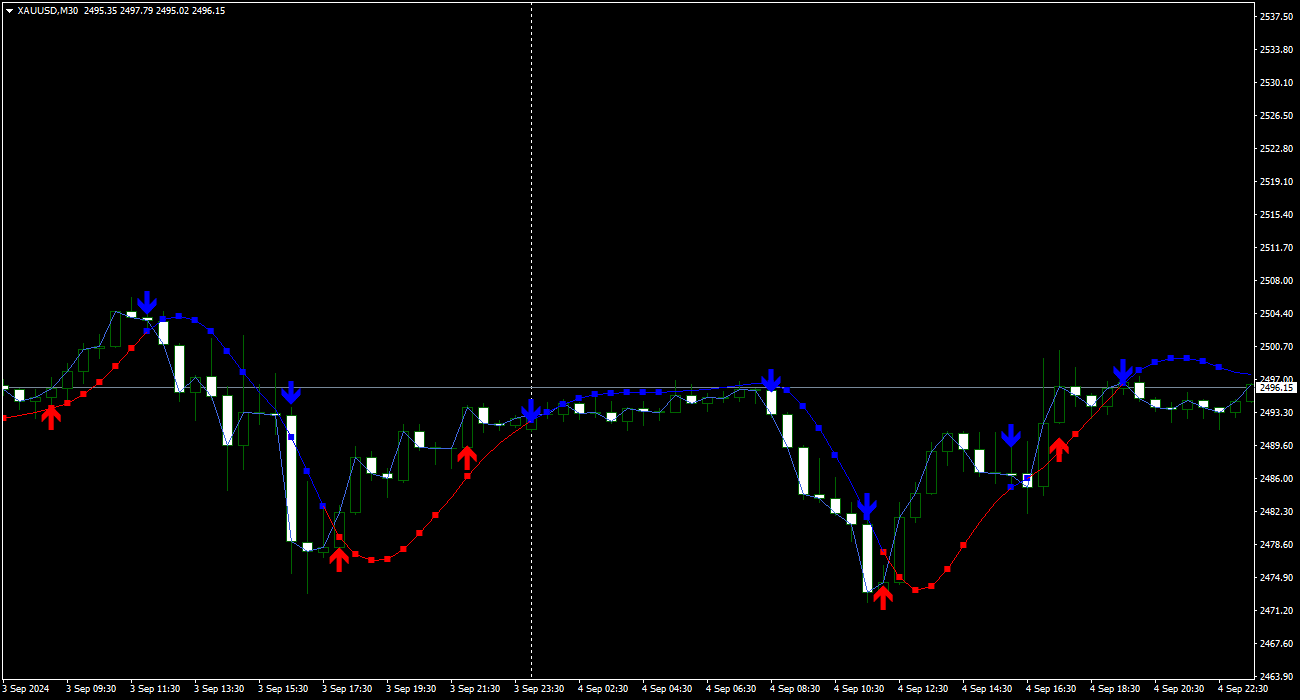
  •  O indicador inclui uma linha guia azul, azul ou vermelha, dependendo da direção da linha.
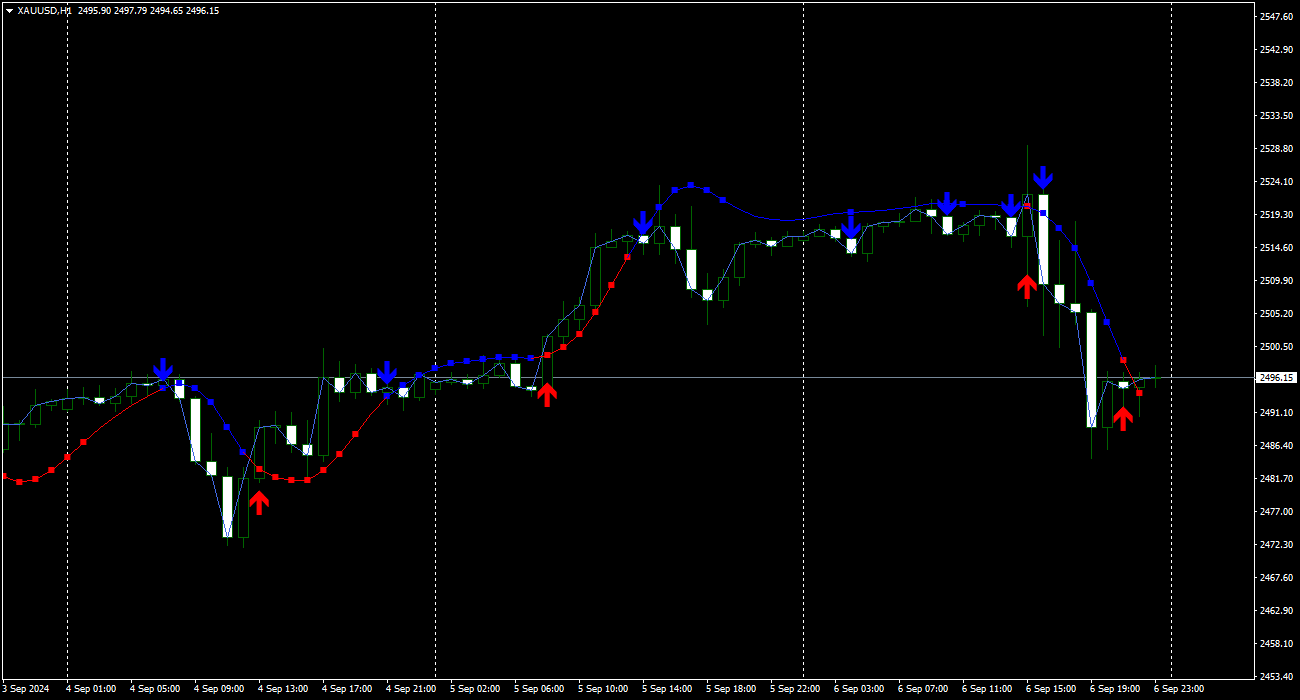
  •  Para que o indicador funcione corretamente, é necessário configurar corretamente o primeiro parâmetro “ Adjustment for volatility ”, o valor por defeito é 1, é adequado para as principais moedas: EURUSD, GBPUSD e algumas outras. Para EURJPY precisa de definir 4, para OURO 5, pode usar volatilidade reduzida. para outros instrumentos de negociação, é necessário selecionar independentemente o nível de volatilidade para que o indicador se assemelhe ao EURUSD.
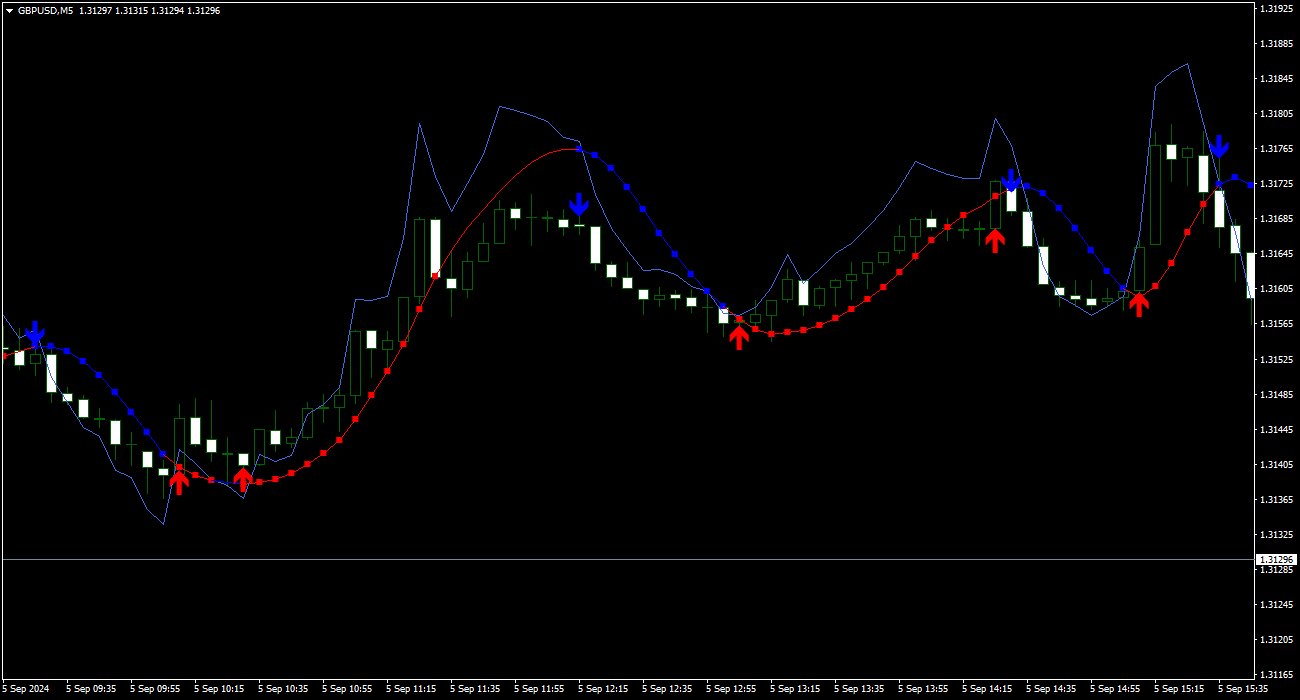
  •  O parâmetro " Smoothed line period " altera a suavidade e a duração das linhas vermelhas e azuis. Mude ao passar pelos intervalos de tempo, utilize um número maior para os mais novos e um número mais baixo para os mais velhos.
  •  O parâmetro “ Signal sensitivity ” regula a formação da seta do sinal e a duração do sinal após a mesma, para o scalping, selecione um número mais baixo, e para a negociação intradiária, um número mais elevado;
  •  Os parâmetros de entrada permitem configurar o indicador para qualquer instrumento de negociação e período de tempo.
  •  As setas de sinalização funcionam sem repintura e têm vários tipos de alertas.


Produtos recomendados
Owl smart levels
Sergey Ermolov
4.34 (35)
Versão MT5  |  FAQ O   Indicador Owl Smart Levels   é um sistema de negociação completo dentro de um indicador que inclui ferramentas populares de análise de mercado, como   fractais avançados de Bill Williams , Valable ZigZag que constrói a   estrutura de onda correta   do mercado e   níveis de Fibonacci que marcam os níveis exatos de entrada no mercado e lugares para obter lucros. Descrição detalhada da estratégia Instruções para trabalhar com o indicador Consultor de negociação Owl Helper Ch
Blahtech Market Profile
Blahtech Limited
4.56 (16)
Was: $249  Now: $99   Market Profile defines a number of day types that can help the trader to determine market behaviour. A key feature is the Value Area, representing the range of price action where 70% of trading took place. Understanding the Value Area can give traders valuable insight into market direction and establish the higher odds trade. It is an excellent addition to any system you may be using. Blahtech Limited presents their Market Profile indicator for the MetaTrader community. Ins
Daily Candle Predictor é um indicador que prevê o preço de fechamento de uma vela. O indicador destina-se principalmente ao uso em gráficos D1. Este indicador é adequado tanto para negociação forex tradicional quanto para negociação de opções binárias. O indicador pode ser usado como um sistema de negociação autônomo ou pode atuar como um complemento ao seu sistema de negociação existente. Este indicador analisa a vela atual, calculando certos fatores de força dentro do próprio corpo da vela, be
VR Cub
Vladimir Pastushak
VR Cub é um indicador para obter pontos de entrada de alta qualidade. O indicador foi desenvolvido para facilitar cálculos matemáticos e simplificar a busca por pontos de entrada em uma posição. A estratégia de negociação para a qual o indicador foi escrito tem provado a sua eficácia há muitos anos. A simplicidade da estratégia de negociação é a sua grande vantagem, o que permite que até mesmo os comerciantes novatos negociem com sucesso com ela. VR Cub calcula os pontos de abertura de posição e
Super Reversal Pattern
Parfait Mujinga Ndalika
Super Reversal Pattern Indicator Unlock the power of advanced pattern recognition with our Super Reversal Pattern Indicator. Designed for traders seeking precision and reliability, this indicator identifies one of the most effective reversal patterns in technical analysis, offering a significant edge in your trading strategy. Key Features: Non-Repainting Accuracy: Enjoy the confidence of non-repainting technology. Once a Super Reversal Pattern is detected, it remains static, providing consis
The Th3Eng PipFinite indicator is based on a very excellent analysis of the right trend direction with perfect custom algorithms. It show the true direction and the best point to start trading. With StopLoss point and Three Take Profit points. Also it show the right pivot of the price and small points to order to replace the dynamic support and resistance channel, Which surrounds the price. And Finally it draws a very helpful Box on the left side on the chart includes (take profits and Stop loss
Volume Profile Indicator for MT4 Gain a trading edge with the "Volume Profile" indicator for MetaTrader 4 (MT4). This advanced technical analysis tool allows you to precisely identify key support and resistance levels based on transaction volume. Easily visualize market areas of high interest, where trading volumes are highest, and use this information to make more informed trading decisions. Key Features: Clear and detailed visualization : The indicator displays volume histograms directly on th
Noize Absorption Index MT4
Ekaterina Saltykova
5 (1)
Noize Absorption Index - is the manual trading system that measures the difference of pressure between bears forces and bulls forces. Green line - is a noize free index that showing curent situation. Zero value of index shows totally choppy/flat market.Values above zero level shows how powerfull bullish wave is and values below zero measures bearish forces.Up arrow appears on bearish market when it's ready to reverse, dn arrow appears on weak bullish market, as a result of reverse expectation. S
Infinity Trend Pro
Yaroslav Varankin
1 (1)
This is a trend indicator without redrawing Developed instead of the binary options strategy (by the color of the Martingale candlestick) Also works well in forex trading When to open trades (binary options) A signal will appear in the place with a candle signaling the current candle It is recommended to open a deal for one candle of the current timeframe M1 and M5 When a blue dot appears, open a deal up When a red dot appears, open a trade down. How to open trades on Forex. When a signal is rec
Title : Market Bias Indicator - Oscillator-Based Trading Tool Introduction : Discover the potential of the "Market Bias Indicator," a revolutionary oscillator-based trading tool designed for precise market analysis. If you're in search of a robust alternative to traditional bias indicators, your quest ends here. Market Bias Indicator offers unparalleled accuracy in identifying market sentiment and is your gateway to confident trading decisions. Recommended Trading Pairs : Market Bias Indicator i
Zig Zag 123
Stephen Reynolds
Zig Zag 123 tells us when a reversal or continuation is more likely by looking at the shift in supply and demand. When this happens a signature pattern appears known as 123 (also known ABC) will often break out in direction of higher low or lower high. Stop loss and take profit levels have been added. There is a panel that shows the overall performance of your trades for if you was to use these stop loss and take profit levels.  We get alerted if a pattern 123 appears and also if the price
It will be the best tool for you to make a profit! Through unique algorithms You're going to see an amazing amount of right trading signals Make huge profits every day and realize more possibilities!   Like the car no money to buy it, the love of the girls dare not to pursue?Or the credit card bill is not paid, the rent does not have the extra money to settle?Or are you fed up with being bossed around by your boss and Hope to get more people's respect?Can't afford to buy the things you want ? wa
Heiken Ashi candle chart is an improved version of The Japanese candle chart, which can effectively filter the market "noise" of the Japanese candle chart. It is favored by many traders for its simplicity and intuition. For trend traders, the HA candle chart is a magic tool. Unlike the traditional Japanese candle chart, Heikenashi does not reflect the opening price, high price, low price and closing price of the market. Instead, Heikenashi calculates the value of a single K line in the dominant
Insider Scalper Binary This tool is designed to trade binary options. for short temporary spends. to make a deal is worth the moment of receiving the signal and only 1 candle if it is m1 then only for a minute and so in accordance with the timeframe. for better results, you need to select well-volatile charts.... recommended currency pairs eur | usd, usd | jpy .... the indicator is already configured, you just have to add it to the chart and trade .... The indicator signals the next can
CyberZingFx Trend Reversal
Afsal Meerankutty
4.18 (17)
Indicator captures the trend reversals with no-repaint Buy and Sell Arrow signals. CyberZingFx Trend Reversal Indicator - your go-to solution for accurate and reliable trend reversal signals. With its  advanced trading strategy , the indicator offers you Buy and Sell Arrow signals that do not repaint, making it a reliable tool for catching Swing Highs and Swing Lows in any market and any time frame. Indicator works on  any market  and  any time frames . __________________________________________
Introduction It is common practice for professional trades to hide their stop loss / take profit from their brokers. Either from keeping their strategy to the themselves or from the fear that their broker works against them. Using this indicator, the stop loss / take profit points will be drawn on the product chart using the bid price. So, you can see exactly when the price is hit and close it manually.  Usage Once attached to the chart, the indicator scans the open orders to attach lines fo
Trendiness Index
Libertas LLC
5 (3)
"The trend is your friend" is one of the best known sayings in investing, because capturing large trendy price movements can be extremely profitable. However, trading with the trend is often easier said than done, because many indicators are based on price reversals not trends. These aren't very effective at identifying trendy periods, or predicting whether trends will continue. We developed the Trendiness Index to help address this problem by indicating the strength and direction of price trend
An indicator of pattern #31 ("Long Island") from Encyclopedia of Chart Patterns by Thomas N. Bulkowski. The second gap is in the opposite direction. Parameters: Alerts - show alert when an arrow appears   Push - send a push notification when an arrow appears (requires configuration in the terminal) GapSize - minimum gap size in points ArrowType - a symbol from 1 to 17 ArrowVShift - vertical shift of arrows in points   ShowLevels - show levels ColUp - color of an upward line ColDn - color of
Line Magnit
Aleksey Trenin
The LineMagnit Indicator for MT4 is a highly precise tool that builds support and resistance levels which magnetically attract prices. This feature allows traders to easily determine the most probable entry and exit points in the market, as well as identify the market's directional forces, as levels are based on capital inflows into the instrument. Equipped with an intuitively understandable graphical interface, the LineMagnit Indicator enables users to quickly locate and analyze support and res
The indicator analyzes the change in the minimum and maximum prices of the previous bars fixing the entrance of the big players. If the change (delta) increases, a signal is displayed on the graph in the form of an arrow. At the same time, virtual trade on history is carried out. In case of a repeat of the signal, the positions are increased (refilling). Thus the lot of positions can differ. The results of virtual trading in the form of losses / losses, profitability, drawdown and transaction li
Fibonacci recontratar e extensão linha de desenho ferramenta Fibonacci recontratar e estender a ferramenta de desenho de linha para a plataforma MT4 é adequado para comerciantes que usam método de negociação de pontos e negociação de secções douradas Vantagens: Não há linha extra, não há linhagem muito longa, e é fácil observar e encontrar oportunidades de negociação Versão experimental: https://www.mql5.com/zh/market/product/35884 Principais funções: 1. Podem ser desenhados diretame
The Chaikin Oscillator is a technical indicator developed by Marc Chaikin that combines price and volume data to measure the accumulation and distribution of a financial instrument. It aims to identify potential buying and selling opportunities in the market. The Chaikin Oscillator is calculated by subtracting a 10-day exponential moving average of the Accumulation Distribution Line (ADL) from a 3-day exponential moving average of the ADL. Here's how to use the Chaikin Oscillator indicator in tr
BoxChart MT4
Evgeny Shevtsov
4.5 (6)
The market is unfair if only because 10% of participants manage 90% of funds. An ordinary trader has slim changes to stand against these "vultures". This problem can be solved. You just need to be among these 10%, learn to predict their intentions and move with them. Volume is the only preemptive factor that faultlessly works on any timeframe and symbol. First, the volume appears and is accumulated, and only then the price moves. The price moves from one volume to another. Areas of volume accumu
Trend Bilio - an arrow indicator without redrawing shows potential market entry points in the form of arrows of the corresponding color: upward red arrows suggest opening a buy, green down arrows - selling. The entrance is supposed to be at the next bar after the pointer. The arrow indicator Trend Bilio visually "unloads" the price chart and saves time for analysis: no signal - no deal, if an opposite signal appears, then the current deal should be closed. It is Trend Bilio that is considered
Power Renko is an indicator which plots Renko bricks underneath the chart using a histogram. You can select the brick size and the timeframe of the Renko bricks as well as whether or not to use the close price or the high/low price of the candles. Renko bricks are based on price alone, not time, therefor the Renko bricks will not be aligned with the chart's time. They are extremely useful for trend trading and many different strategies can be formed from them. Buffers are provided allowing you t
Point61 Indicator
Evgeniy Machok
5 (1)
The Point61 indicator is the result of many years of monitoring of price behavior of currency pairs and metals. It is not a secret, that in times of uncertainty, traders are looking for possible levels of support and resistance - the point, where price should stop its movement. There are 2 possible scenarios at these points: 1. Reverse (correction) to the opposite direction; 2. Breakthrough to continue movement. Very often these points are used to set stop orders - TakeProfit or
Binary Options Support Resistance Indicator This indicator is designed for binary options trading and effectively shows retracements from support and resistance levels. Signals appear on the current candle. A red arrow pointing downwards indicates a potential selling opportunity, while a blue arrow pointing upwards suggests buying opportunities. All that needs adjustment is the color of the signal arrows. It is recommended to use it on the M1-M5 timeframes as signals are frequent on these timef
The Penta-O is a 6-point retracement harmonacci pattern which usually precedes big market movements. Penta-O patterns can expand and repaint quite a bit. To make things easier this indicator implements a twist: it waits for a donchian breakout in the right direction before signaling the trade. The end result is an otherwise repainting indicator with a very reliable trading signal. The donchian breakout period is entered as an input. [ Installation Guide | Update Guide | Troubleshooting | FAQ | A
What are Heiken Ashi Candles? Heiken Ashi, derived from the Japanese term 'Heikin Ashi,' translates to average price bars. It's an indicator depicting price bars on a chart. Formula for Heiken Ashi candles: - Heiken Ashi opening price: (previous candle's opening + closing price) / 2 - Closing price Heiken Ashi: (opening + high + low + closing) / 4 - Heiken Ashi peak: Max of high, opening, or closing price - Heiken Ashi bottom price: Min of low, opening, or closing price How to Read Heik
This indicator is a conventional analytical tool for tick volumes changes. It calculates tick volumes for buys and sells separately, and their delta on every bar, and displays volumes by price clusters (cells) within a specified bar (usually the latest one). The algorithm used internally is the same as in the indicator VolumeDelta , but results are shown as cumulative volume delta bars (candlesticks). Analogous indicator for MetaTrader 5 exists - VolumeDeltaBars . This is a limited substitution
Os compradores deste produto também adquirem
TPSpro RFI Levels
Roman Podpora
4.81 (21)
Reversal First Impulse levels (RFI)    INSTRUCTIONS        RUS       -       ENG              R ecommended to use with an indicator   -   TPSpro  TREND PRO -  Version MT5 A key element in trading is zones or levels from which decisions to buy or sell a trading instrument are made. Despite attempts by major players to conceal their presence in the market, they inevitably leave traces. Our task was to learn how to identify these traces and interpret them correctly. Main functions: Displaying activ
Atomic Analyst
Issam Kassas
5 (2)
Primeiramente, vale ressaltar que este Indicador de Negociação não repinta, não redesenha e não apresenta atrasos, tornando-o ideal tanto para negociação manual quanto automatizada. Manual do utilizador: configurações, entradas e estratégia. O Analista Atômico é um Indicador de Ação de Preço PA que utiliza a força e o momentum do preço para encontrar uma vantagem melhor no mercado. Equipado com filtros avançados que ajudam a remover ruídos e sinais falsos, e aumentam o potencial de negociação.
Enigmera
Ivan Stefanov
5 (3)
ENIGMERA: O núcleo do mercado https://www.enigmera.com Introdução Este indicador e sistema de negociação é uma abordagem notável aos mercados financeiros. ENIGMERA utiliza os ciclos fractais para calcular com precisão os níveis de suporte e resistência. Mostra a autêntica fase de acumulação e dá direcções e objectivos.  Um sistema que funciona quer estejamos numa tendência ou numa correção.  Como é que funciona? O ENIGMERA é composto por três linhas: a linha de suporte/resistência, a linha
TPSproTREND PrO
Roman Podpora
4.79 (19)
TPSpro TREND PRO   é um indicador de tendência que analisa automaticamente o mercado e fornece informações sobre a tendência e cada uma de suas mudanças, além de dar sinais para entrar em negociações sem redesenhar! O indicador utiliza cada vela, analisando-as separadamente. referindo-se a diferentes impulsos - impulso para cima ou para baixo. Pontos de entrada exatos em transações de moedas, criptomoedas, metais, ações, índices! Versão MT5                   DESCRIÇÃO COMPLETA DO INDICADOR    
Actualmente 20% OFF ! A melhor solução para qualquer novato ou comerciante especializado! Este software de painel de instrumentos está a funcionar em 28 pares de moedas. É baseado em 2 dos nossos principais indicadores (Advanced Currency Strength 28 e Advanced Currency Impulse). Dá uma grande visão geral de todo o mercado Forex. Mostra valores avançados de força da moeda, velocidade de movimento da moeda e sinais para 28 pares de divisas em todos os (9) períodos de tempo. Imagine como a sua
Currency Strength Exotics
Bernhard Schweigert
4.87 (30)
ACTUALMENTE 20% DE DESCONTO ! A melhor solução para qualquer novato ou comerciante especializado! Este Indicador é especializado para mostrar a força da moeda para quaisquer símbolos como Pares Exóticos de Commodities, Índices ou Futuros. É o primeiro do seu género, qualquer símbolo pode ser adicionado à 9ª linha para mostrar a verdadeira força da moeda de Ouro, Prata, Petróleo, DAX, US30, MXN, TRY, CNH etc. Esta é uma ferramenta de negociação única, de alta qualidade e acessível, porque in
Scalper Inside PRO
Alexey Minkov
4.73 (56)
An exclusive indicator that utilizes an innovative algorithm to swiftly and accurately determine the market trend. The indicator automatically calculates opening, closing, and profit levels, providing detailed trading statistics. With these features, you can choose the most appropriate trading instrument for the current market conditions. Additionally, you can easily integrate your own arrow indicators into Scalper Inside Pro to quickly evaluate their statistics and profitability. Scalper Inside
FX Volume
Daniel Stein
4.58 (33)
Receba a sua atualização diária do mercado com detalhes e screenshots através do nosso Morning Briefing aqui no mql5 e no Telegram ! O Volume FX é o PRIMEIRO e ÚNICO indicador de volume que fornece uma visão REAL do sentimento do mercado do ponto de vista de um corretor. Ele fornece uma visão incrível de como os participantes do mercado institucional, como corretores, estão posicionados no mercado Forex, muito mais rápido do que os relatórios COT. Ver essas informações diretamente no seu gráfi
This indicator is based on the Gann Signal indicator and acts as a market scanner. All you need to do is fill in the selected currency pairs in the settings and that’s it. Next, the indicator itself will view all these currency pairs and time frames from M5 to D1 simultaneously. When a new signal appears, the indicator will give you an Alert and also draw the letter N where this new signal will be.
Gold Channel   é um indicador baseado na volatilidade, desenvolvido com um algoritmo de tempo especifico para o par XAUUSD que consiste em encontrar possíveis correções no mercado. Este indicador mostra duas linhas exteriores, uma interior (linha de retração) e um sinal de seta, onde a teoria do canal consiste em ajudar a identificar condições de sobrecompra e sobrevenda no mercado. O preço do mercado cairá geralmente entre os limites do canal. Se os preços tocarem ou se moverem para fora do can
Apresentamos o ON Trade Waves Patterns Harmonic Elliot Wolfe, um indicador avançado projetado para detectar diversos tipos de padrões no mercado, usando métodos manuais e automáticos. Aqui está como ele funciona: Padrões Harmônicos: Este indicador pode identificar padrões harmônicos que aparecem em seu gráfico. Esses padrões são essenciais para traders que praticam a teoria de negociação harmônica, conforme popularizada no livro de Scott Carney "Harmonic Trading vol 1 e 2". Seja desenhando-os m
Entry Points Pro
Yury Orlov
4.62 (175)
Este é um indicador para MT4 que fornece sinais precisos para entrar em uma negociação sem redesenhar. Ele pode ser aplicado a qualquer ativo financeiro: forex, criptomoedas, metais, ações, índices. Ele fornecerá estimativas bastante precisas e informará quando é melhor abrir e fechar um negócio. Assista o vídeo (6:22) com um exemplo de processamento de apenas um sinal que compensou o indicador! A maioria dos traders melhora seus resultados de negociação durante a primeira semana de negociação c
Beast Super Signal
Dustin Vlok
4.73 (90)
Procurando por um poderoso indicador de negociação forex que possa ajudá-lo a identificar oportunidades de negociação lucrativas com facilidade? Não procure mais do que o Beast Super Signal. Este indicador baseado em tendências fácil de usar monitora continuamente as condições do mercado, procurando por novas tendências em desenvolvimento ou aproveitando as já existentes. O Beast Super Signal dá um sinal de compra ou venda quando todas as estratégias internas se alinham e estão em 100% de conflu
TPA True Price Action indicator reveals the true price action of the market makers through 100% non-repainting signals (except early signals mode) strictly at the close of a candle! TPA shows entries and re-entries, every time the bulls are definitely stronger than the bears and vice versa. Not to confuse with red/green candles. The shift of power gets confirmed at the earliest stage and is ONE exit strategy of several. There are available now two free parts of the TPA User Guide for our custo
LEIA AS INFORMAÇÕES ABAIXO ANTES DE COMPRAR O PRODUTO! Apollo Pips PLUS SP é um produto único! É PARA QUEM QUER ADQUIRIR MEU NOVO INDICADOR "APOLLO PIPS" MAIS BÔNUS "SUPER PACK" COM ACESSO A TODOS OS MEUS INDICADORES DE NEGOCIAÇÃO! Ao adquirir o produto Apollo Pips PLUS SP você está na verdade adquirindo uma versão absolutamente nova do meu indicador Apollo Pips. Esta versão do indicador possui um algoritmo aprimorado e um parâmetro fácil de usar que lhe dá a oportunidade de usar o indicador em
PZ Mean Reversion MT4
PZ TRADING SLU
2.33 (3)
Indicador único que implementa uma abordagem profissional e quantitativa para significar negociação de reversão. Ele capitaliza o fato de que o preço desvia e retorna à média de maneira previsível e mensurável, o que permite regras claras de entrada e saída que superam amplamente as estratégias de negociação não quantitativas. [ Installation Guide | Update Guide | Troubleshooting | FAQ | All Products ] Sinais de negociação claros Incrivelmente fácil de negociar Cores e tamanhos personalizáveis
Shark Deal Book
Philip Pankaj Suthagar
4 (3)
Term  "shark"  in the business world denotes a high volume investor who just made a good investment in a highly Potential business deal.So, sharks are the ones who make the market move. In our case, if an American shark bought a Japanese company, he/she has to convert American dollars into Japanese yen to make the deal. So, the demand for the Japanese yen will increase sharply. Thus USD/JPY will go short rapidly if the deal was from the shark. Another example, In the case of forex, if fed increa
PZ Day Trading
PZ TRADING SLU
3.67 (3)
Este indicador detecta reversões de preços em zigue-zague, usando apenas análise de ação de preços e um canal donchiano. Ele foi projetado especificamente para negociações de curto prazo, sem repintar ou retroceder. É uma ferramenta fantástica para traders astutos, com o objetivo de aumentar o tempo de suas operações. [ Guia de instalação | Guia de atualização | Solução de problemas | FAQ | Todos os produtos ] Surpreendentemente fácil de negociar Fornece valor em cada período de tempo Imple
RelicusRoad Pro
Relicus LLC
4.64 (103)
Agora US $ 147 (aumentando para US $ 499 após algumas atualizações) - Contas ilimitadas (PCs ou Macs) Manual do usuário do RelicusRoad + vídeos de treinamento + acesso ao grupo de discórdia privado + status VIP UMA NOVA FORMA DE OLHAR PARA O MERCADO O RelicusRoad é o indicador de negociação mais poderoso do mundo para forex, futuros, criptomoedas, ações e índices, oferecendo aos traders todas as informações e ferramentas necessárias para se manterem rentáveis. Fornecemos análises técnica
Volatility Trend System - um sistema de negociação que dá sinais para entradas. O sistema de volatilidade fornece sinais lineares e pontuais na direção da tendência, bem como sinais para sair dela, sem redesenho e atrasos. O indicador de tendência monitora a direção da tendência de médio prazo, mostra a direção e sua mudança. O indicador de sinal é baseado em mudanças na volatilidade e mostra entradas no mercado. O indicador está equipado com vários tipos de alertas. Pode ser aplicado a vários i
TrendfollowerSR
Paul Reymkhe
4.88 (90)
Take Your Trading Experience To the Next Level ! and get the exclusive TFSR-Analyzer for free !    So you have all these outstanding features  on up to 20 symbols and all timeframes in a smart and clear Design. Correct identification of the trends  in stock investments are pivotal and TrendFollowerSR ensures this perspective while displaying the correct trend on multiply timeframes to help you go long way as much as possible. The latest technology of the Indicator enables to track whether if
Apresentando       Quantum Trend Sniper Indicator   , o inovador Indicador MQL5 que está transformando a maneira como você identifica e negocia as reversões de tendência! Desenvolvido por uma equipe de traders experientes com experiência comercial de mais de 13 anos,       Indicador de Atirador de Tendência Quântica       foi projetado para impulsionar sua jornada de negociação a novos patamares com sua forma inovadora de identificar reversões de tendência com precisão extremamente alta. ***C
Allows multiple indicators to be combined into a single indicator, both visually and in terms of an alert. Indicators can include standard indicators, e.g. RSI, CCI, etc., and also Custom Indicators, even those purchased through Market, or where just have the ex4 file. An early alert is provided, say when 4 out 5 indicators have lined up, and a confirmed alert when all are in agreement. A‌lso features a statistics panel reporting the success of the combined indicator by examining the current cha
System Trend Pro - This is the best trend trading indicator!!! The indicator no repaint!!!   The indicator has   MTF   mode, which adds confidence to trading on the trend (   no repaint   ). How to trade? Everything is very simple, we wait for the first signal (big arrow), then wait for the second signal (small arrow) and enter the market in the direction of the arrow. (See screens 1 and 2.) Exit on the opposite signal or take 20-30 pips, close half of it, and keep the rest until the oppo
Este indicador foi projetado para se integrar com a teoria das Ondas de Elliott, oferecendo dois métodos distintos de operação: Trabalho Automático: Nesse modo, o indicador opera autonomamente detectando todas as cinco ondas motrizes no gráfico de acordo com a teoria das Ondas de Elliott. Ele oferece previsões e identifica zonas potenciais de reversão. Além disso, possui a capacidade de gerar alertas e mensagens de push para notificar os traders sobre desenvolvimentos significativos. Essa funcio
Bomb Bank Signal
Igor Pereira Calil
5 (1)
Bomb Bank Signal: O Seu Indicador de Confiança no MetaTrader 4 O Bomb Bank Signal é um poderoso indicador para MetaTrader 4, projetado para identificar as tendências mais relevantes no mercado financeiro. Se você está buscando uma ferramenta que antecipe movimentos com precisão, o Bomb Bank é o aliado que você precisa. Como Funciona: Este indicador combina três métodos distintos – análise de volumes, fechamentos de vela e tendência simétrica – para detectar e sinalizar oportunidades de compra e
CyberZingFx Volume Plus
Afsal Meerankutty
4.93 (15)
Advanced version of CyberZingFx Volume Plus, the ultimate MT4 indicator for traders seeking highly accurate buy and sell signals. With an additional strategy and price action dot signals that enhances its effectiveness, this indicator offers a superior trading experience for professionals and beginners alike. The CyberZingFx Volume Plus Advanced version combines the power of volume analysis and historical price data with an additional strategy, resulting in even more precise and reliable signals
Cycle Sniper
Elmira Memish
4.37 (35)
NEW YEAR SALE PRICE FOR LIMITED TIME!!! Please contact us after your purchase and we will send you the complimentary indicators to complete the system Cycle Sniper is not a holy grail but when you use it in a system which is explained in the videos, you will feel the difference. If you are not willing to focus on the charts designed with Cycle Sniper and other free tools we provide, we recommend not buying this indicator. We recommend watching the videos about the indiactor and system before pu
This indicator scans for you up to 30 trading instruments and up to 8 timeframes for occurrences of the high probability reversal patterns: Double Tops/Bottoms with fake breakouts . Please read also the blog post " Professional Trading With Double Tops/Bottoms And Divergences! " which explains the concepts behind the ULTIMATE Double Top/Bottom indicator and how you can use a professional top-down approach. You can get alerts via MetaTrader 4, email and push notifications at the moment when a sig
Alright. This indicator works on MT4 and is very easy to use. When you receive a signal from it, you wait for that candle with the signal to close and you enter your trade at the beginning of the next new candle. A red arrow means sell and a green arrow means buy. All arrows comes with Popup Alert like for easy identification of trade signal. Are you okay with that?   100% non repaint Work All Major currency  Pair,  1 minute time frame 1 minute expire
Mais do autor
Volatility Trend System - um sistema de negociação que dá sinais para entradas. O sistema de volatilidade fornece sinais lineares e pontuais na direção da tendência, bem como sinais para sair dela, sem redesenho e atrasos. O indicador de tendência monitora a direção da tendência de médio prazo, mostra a direção e sua mudança. O indicador de sinal é baseado em mudanças na volatilidade e mostra entradas no mercado. O indicador está equipado com vários tipos de alertas. Pode ser aplicado a vários i
Um conjunto de indicadores que reconhecem pontos de viragem. Deteta topos e fundos de combinações de velas após subtraí-los a dois MAs. Aplicável para sistemas de negociação ao utilizar entradas antecipadas. Pode ser utilizado ao longo da tendência para scalping e negociação intradiária e para detetar reversões de tendência nas fases iniciais. Possibilidades Os parâmetros fornecem definições flexíveis para quaisquer prazos e instrumentos de negociação. Existem vários tipos de alertas para
Channel Cluster
Vitalyi Belyh
5 (1)
Cluster indicator working in the price channel. For operation, the indicator builds a channel line - (dashed line). Inside the channel, cluster sections are determined that determine the direction of the price movement - (histograms in two directions), start with large arrows. Small arrows are plotted above / below each histogram - indicator increase volatility. The indicator does not redraw the values. Works on any tools and timeframes. Entrances are made when large arrows appear, inside s
Volatility Trend System - é um sistema de negociação que fornece sinais para entradas. O sistema de volatilidade fornece sinais lineares e pontuais na direção da tendência, bem como sinais para sair dela, sem redesenhar ou atrasos. O indicador de tendência monitora a direção da tendência de médio prazo, mostra a direção e sua mudança. O indicador de sinal é baseado em mudanças na volatilidade e mostra as entradas no mercado. O indicador está equipado com diversos tipos de alertas. Pode se
Candle Binary Scalper é um produto de análise técnica para forex e opções binárias. Inclui vários indicadores técnicos combinados em um sistema de negociação. Adequado para negociação manual dentro de uma tendência, para escalpelamento e opções binárias. Funciona em todos os prazos e instrumentos de negociação. Prazos recomendados para negociação M15, M30, H1 e H4, M5 e M1 devem ser usados ​​em caso de alta volatilidade. Existem vários tipos de alertas. Como usar o produto As configuraçõ
Scalping Entry Points - é um sistema de negociação manual que pode se ajustar aos movimentos de preços e dar sinais para abrir negociações sem redesenhar. O indicador determina a direção da tendência pelo nível central de suporte e resistência. O indicador de ponto fornece sinais para entradas e saídas. Adequado para negociação intradiária manual, escalpelamento e opções binárias. Funciona em todos os prazos e instrumentos de negociação. O indicador dá vários tipos de alertas. Como usar o pr
Scalping and Binary Signal Detector - Indicador de scalping que fornece sinais direcionais para abertura de posições ao longo da tendência. O indicador é um sistema de negociação completo que pode ser usado para Forex e opções binárias. O sistema de algoritmos permite reconhecer movimentos intensos de preços em diversas barras consecutivas. O indicador fornece vários tipos de alertas para setas. Funciona em quaisquer instrumentos de negociação e prazos (recomendado M5 ou superior). Como u
O indicador " ZigZag on Trend " é um assistente na determinação da direção do movimento dos preços, bem como uma calculadora de barras e pips. É composto por um indicador de tendência que monitora a direção do preço com uma linha de tendência apresentada em forma de zigue-zague e um contador que calcula o número de barras passadas na direção da tendência e o número de pontos na escala vertical. (Os cálculos são realizados abrindo a barra) O indicador não é redesenhado. Para maior comodidade, é d
Um indicador técnico concebido especificamente para o scalping que pode identificar impulsos de volatilidade e mostrar a sua duração. Possui parâmetros flexíveis para configurações manuais, permitindo aplicar a funcionalidade do indicador a qualquer instrumento de negociação. Os prazos recomendados para utilização são M5, M15, M30, H1 e H4. Existem vários tipos de alertas. Todos os sinais nunca mudam ou mudam de cor no fecho da vela. O indicador é configurado por parâmetros de cima para b
Indicador para negociação manual e análise técnica para Forex. Consiste em um indicador de tendência com o nível de abertura do dia de negociação e um indicador de seta para determinar os pontos de entrada. O indicador não muda de cor; funciona quando a vela fecha. Contém vários tipos de alertas para setas de sinalização. Pode ser configurado para funcionar em qualquer gráfico, instrumento de negociação ou período de tempo. A estratégia de trabalho baseia-se na busca de movimentos de pr
Wave Reversal Indicator - determines the direction of trend waves and price reversals. The indicator shows wave movements and trend directions. It gives recommendations where to follow the trader, helps to follow the trading strategy. It is an addition to an intraday or medium-term strategy. Almost all parameters are selected for each time frame and are changed automatically, the only parameter for manual adjustment is the wavelength. Works on various trading instruments and timeframes, rec
FREE
Um conjunto de indicadores que reconhecem pontos de viragem. Deteta topos e fundos de combinações de velas após subtraí-los a dois MAs. Aplicável para sistemas de negociação ao utilizar entradas antecipadas. Pode ser utilizado ao longo da tendência para scalping e negociação intradiária e para detetar reversões de tendência nas fases iniciais. Possibilidades Os parâmetros fornecem definições flexíveis para quaisquer prazos e instrumentos de negociação. Existem vários tipos de alertas para
Zig-Zag indicator with additional signals for inputs. Visually easy to use: The red zig-zag line is an uptrend. The blue zig-zag line is a downward trend. Arrows in the form of additional signals. Works on any trading pairs. On any timeframe. Not redrawn. Input parameters Zig-Zag Period - Zig-zag period (from 5) Signal Period - period of signal arrows (from 3) Alerts for signals Play sound - Sound alert Display pop-up message - Notification by message on the screen Send push not
FREE
Candle Power Signals é um indicador de tendência que utiliza uma estratégia de busca de potenciais sinais voláteis para tomar decisões de negociação. Ao analisar o mercado, o indicador identifica zonas de aumento e diminuição da volatilidade dentro do movimento de tendência direcional. Os principais parâmetros de geração de sinal já foram configurados, as demais configurações e períodos estão indexados em 2 parâmetros para configuração manual: 1. "Candle calculation method" - 2 modos de ger
Level Breakout Indicator é um produto de análise técnica que funciona a partir dos limites superior e inferior, que pode determinar a direção da tendência. Funciona na vela 0 sem redesenhar ou atrasos. Em seu trabalho utiliza um sistema de diversos indicadores, cujos parâmetros já foram configurados e combinados em um único parâmetro - “ Scale ”, que realiza a gradação dos períodos. O indicador é fácil de usar, não requer nenhum cálculo, usando um único parâmetro você precisa selecionar a grad
Max Min Reversal Arrows MT5 - an arrow reversal indicator for predicting price movement. The indicator is built on the support and resistance levels at the local lows and highs of the price. Product features Arrows appear on the current candle. The indicator does not redraw. Can be used on all time frames and trading instruments. Recommended timeframes to use M30, H1, H4. The dotted lines are the support and resistance levels within the signal. Price movement from these levels means a reve
O sistema de comércio técnico de setas de reversão do BB foi desenvolvido para prever pontos reversos para tomar decisões de varejo. A situação atual do mercado é analisada pelo indicador e estruturada para vários critérios: a expectativa de momentos de reversão, possíveis pontos de virada, sinais de compra e venda. O indicador não contém informações em excesso, possui uma interface visual compreensível, permitindo que os comerciantes tomem decisões razoáveis. Todas as setas parecem fechar
Indicador cíclico para negociação e previsão da direção do mercado. Mostra o comportamento cíclico do preço sob a forma de um oscilador. Emite sinais para a abertura de negociações quando se verifica uma recuperação dos limites superior e inferior do oscilador. Sob a forma de histograma, mostra a força suavizada da tendência.  Complementará qualquer estratégia de trading, desde o scalping ao intradiário.  O indicador não é redesenhado.  Adequado para utilização em todos os símbolos/instrumen
Indicador do canal de preço e gerador de breakpoint dentro dele. Dá uma ideia da posição do preço em relação ao período de uso. Ele contém linhas de salto de tendência suavizadas construídas ao longo das bordas do canal e pontos de salto que determinam os momentos de entrada e saída. Funciona em vários instrumentos de negociação e prazos. Como trabalhar com o indicador Siga a linha de quebra de canal, a linha azul é entrada para cima, a linha rosa é entrada para baixo. Os pontos de entra
Um indicador de tendência que mostra a força dos touros e ursos em uma faixa de negociação. Composto por duas linhas: A linha verde é uma condição equilibrada de sobrecompra/sobrevenda. A linha vermelha é a direção da atividade de negociação. Não redesenha cálculos. Pode ser usado em todos os símbolos/instrumentos/quadros de tempo. Fácil de usar e configurar. Como usar o indicador e o que ele determina. A regra básica é seguir a direção da linha vermelha: se cruzar a linha verde d
FREE
Smoothed oscillator based on basic DeMarker indicators. Shows the volatility of the price direction. Can be used to determine intraday entry and exit points from the market. Suitable for use on all time frames and trading instruments. It is recommended to use on M5, M15 and M30. The green line shows the price direction up, the blue line shows the price direction down. The red line is a smoothed representation of the price. Input parameters      Period - Period of the main indicator DeMarker
FREE
Lines Channel Pro
Vitalyi Belyh
5 (1)
The "Lines Channel Pro" indicator determines price reversals from the High/Low channel. Contains a built-in trend finder, signal lines, entry and exit points. The recommended timeframe for M15 to work is D1. For each timeframe and trading instrument, depending on the volatility, it is necessary to select individual settings. Does not redraw calculations. Input parameters Use Channel trend filter - Turn on/off the trend filter Channel trend period - Trend filter period (from 8 and abov
Arrow indicator with trend filter. Generates trend input without delays or delays - on the emerging candle. Suitable for use on any trading tools and timeframes. Easy to use, contains the direction of the trend in the form of a histogram lines and signal generator. Input parameters Period Trend Line - Period of the Histogram Line Signal Generator Period - If the period is longer, then the arrows are less Play sound Display pop-up message Send push notification Send email Sound file signal -
An indicator that determines the point levels of price resistance. The arrows indicate price bounces in the indicated directions. Arrows are not redrawn formed on the current candle, shown on the previous candle for convenience.      It has one setting - the formation intensity: If the parameter is smaller, most of the signals are formed in a wide trend. If the parameter is larger, signals are formed in a narrower trend. Input parameters Formation Intensity - Arrow Formation Intensity Num
A technical indicator that calculates its readings based on trading volumes. It has an oscillatory line that follows the change in volumes. Large arrows on the line indicate reversal values. A channel is built around the line with small arrows showing the strengthening of price movement in the direction of increasing volumes. The indicator does not redraw values. Works on any instrument and timeframe. It can complement any trading strategy by finding a trend or make entries in the direction of
Max Min Reversal Arrows - an arrow reversal indicator for predicting price movement. The indicator is built on the support and resistance levels at the local lows and highs of the price. Product features Arrows appear on the current candle. The indicator does not redraw. Can be used on all time frames and trading instruments. Recommended timeframes to use M30, H1, H4. The dotted lines are the support and resistance levels within the signal. Price movement from these levels means a reversal.
Scalping Entry Points - é um sistema de negociação manual que pode se ajustar aos movimentos de preços e dar sinais para abrir negociações sem redesenhar. O indicador determina a direção da tendência pelo nível central de suporte e resistência. O indicador de ponto fornece sinais para entradas e saídas. Adequado para negociação intradiária manual, escalpelamento e opções binárias. Funciona em todos os prazos e instrumentos de negociação. O indicador dá vários tipos de alertas. Como usar o pr
Uma ferramenta de tendência para negociar, analisar e prever a situação do mercado. O indicador inclui uma linha guia que atua como um guia para as ondas de tendência, sejam diárias ou semanais. E um oscilador especial que analisa os volumes de negociação. Ele mostra períodos de mercados de sobrecompra e sobrevenda e determina pontos de entrada no início de um possível movimento de preço. O indicador não redesenha e não atrasa. Funciona em qualquer instrumento e Time Frames. O indicador não
Binary Lines é um indicador de análise técnica para moedas, commodities, criptomoedas, ações, índices e quaisquer instrumentos financeiros. Pode ser usado para opções binárias ou escalpelamento Forex. Mostra os pontos de entrada e saída em intervalos fixos e fornece comerciantes as informações necessárias sobre os resultados de possíveis transações. Os pontos de entrada são formados no início da vela, na direção da linha MA, duração as negociações em barras podem ser ajustadas manualmente e aj
Um indicador técnico que calcula suas leituras nos volumes de negociação. Na forma de histograma, mostra o acúmulo da força do movimento do instrumento de negociação. Possui sistemas de cálculo independentes para direções de alta e baixa. Funciona em quaisquer instrumentos de negociação e prazos. Pode complementar qualquer sistema de negociação. O indicador não redesenha seus valores, os sinais aparecem na vela atual. É fácil de usar e não carrega o gráfico, não requer cálculos de parâmetros a
Filtro:
Sem comentários
Responder ao comentário