CustomRsi50
- Indicadores
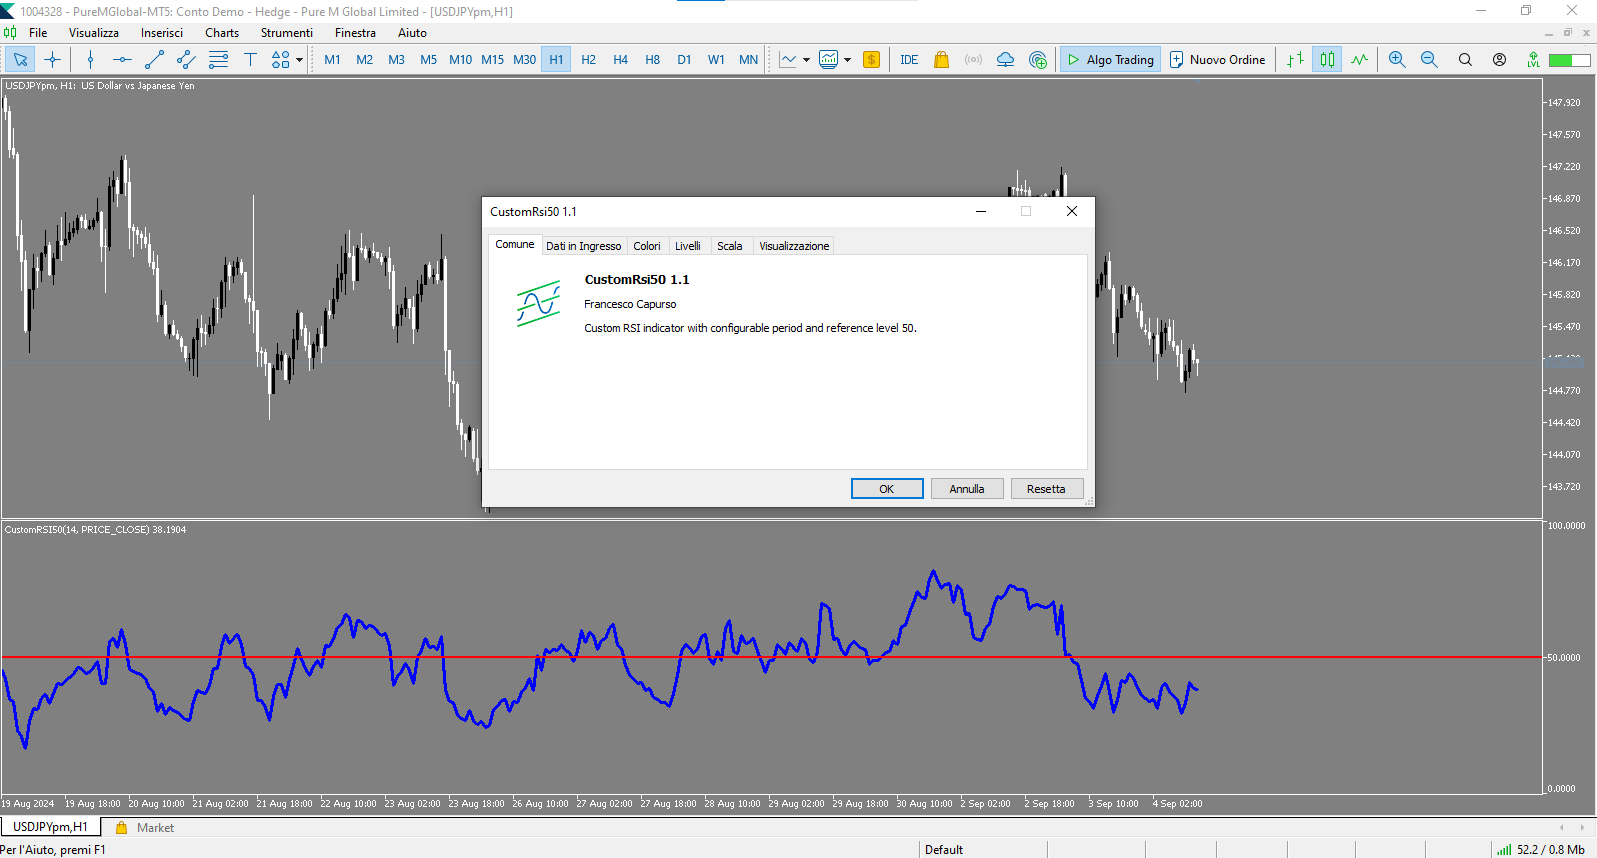
- Francesco Capurso
- Versão: 1.4
- Atualizado: 6 setembro 2024
CustomRSI50 - Indicador RSI Personalizado com Nível 50
Descrição
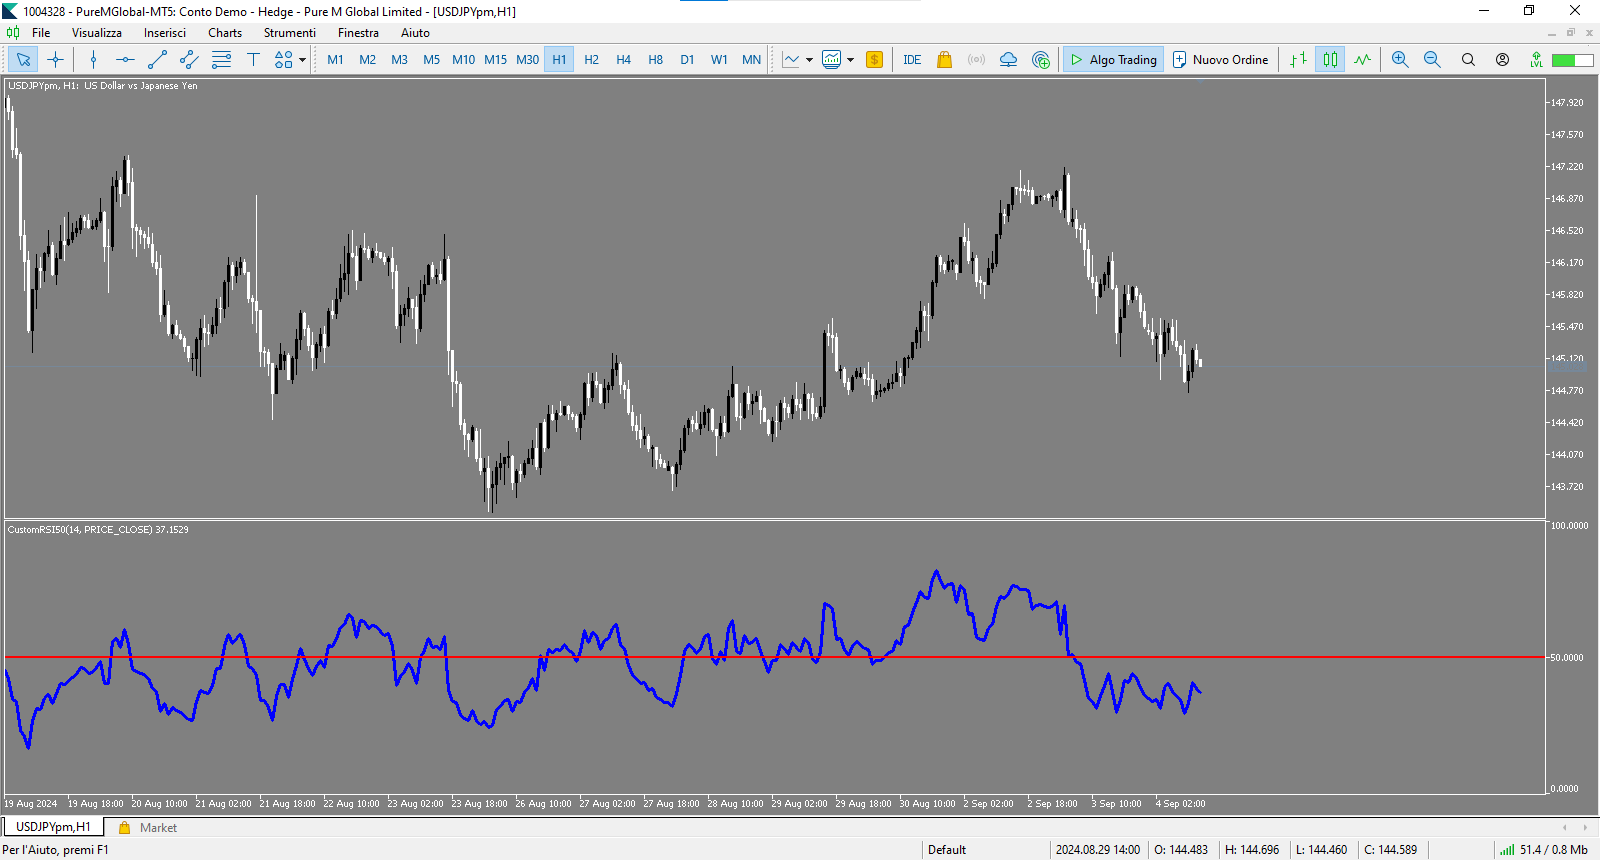
CustomRSI50 é um indicador técnico personalizado baseado no popular Índice de Força Relativa (RSI). Este indicador oferece uma visualização clara e personalizável do RSI, com ênfase particular no nível 50, crucial para muitos traders na análise do momentum.
Características Principais
- Período RSI configurável
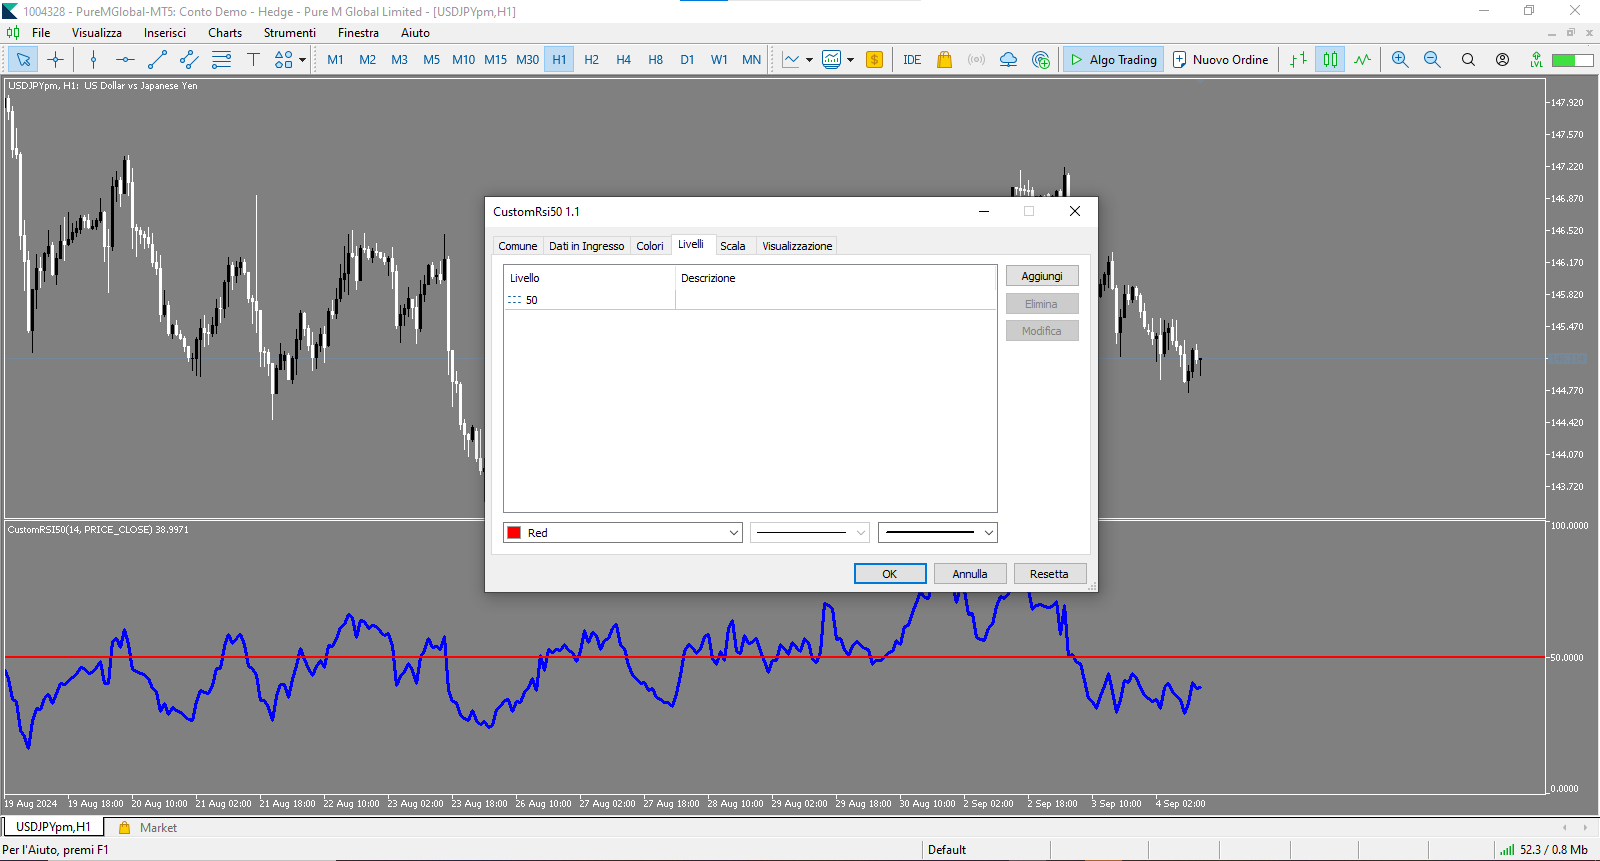
- Nível de referência 50 destacado
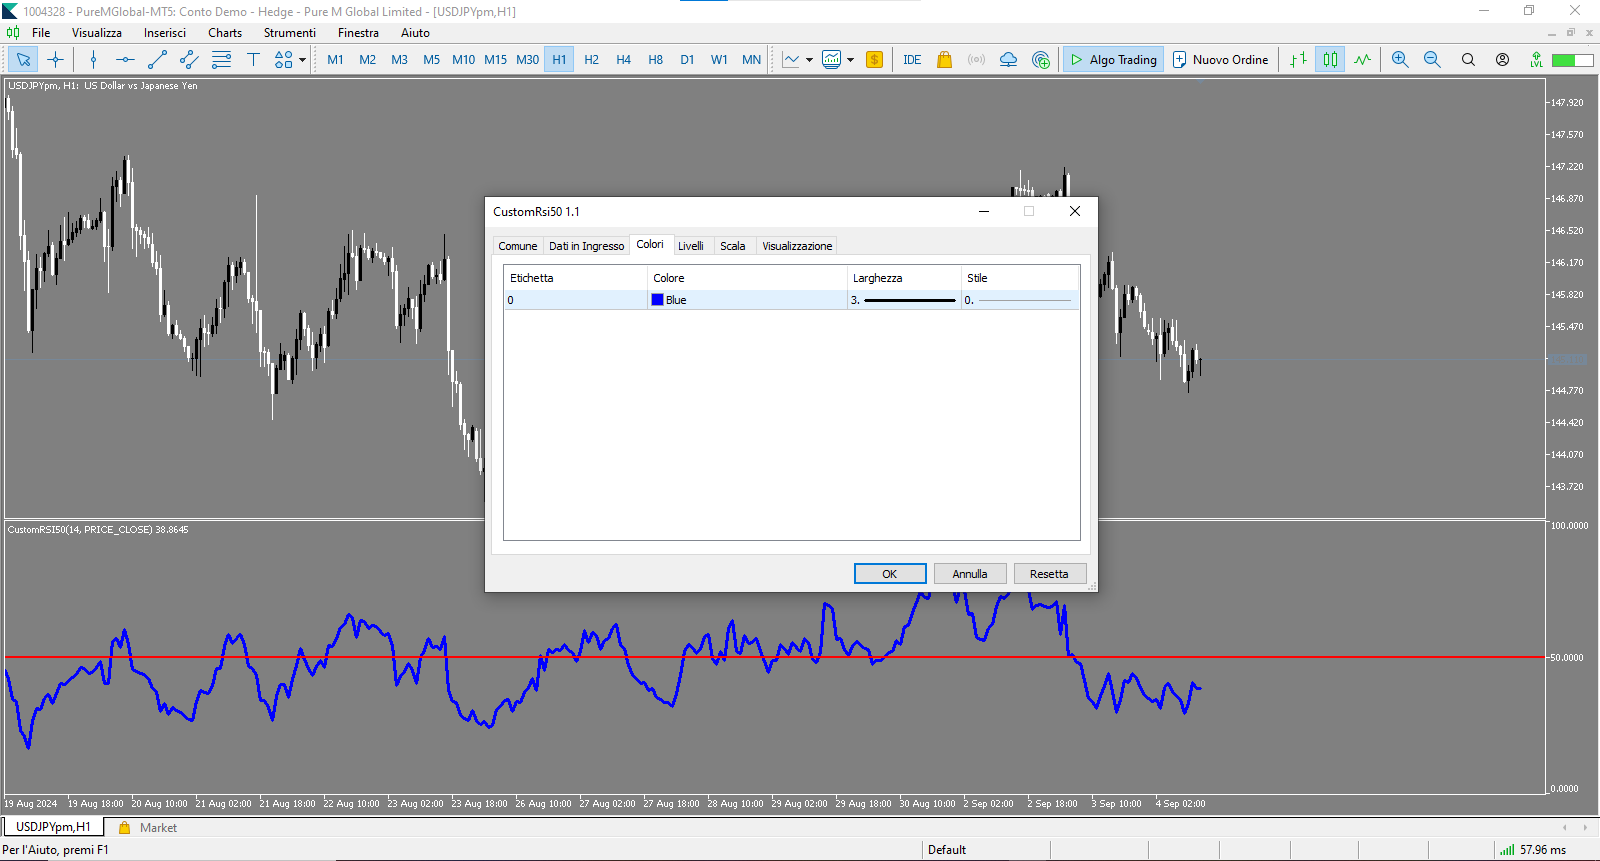
- Tipo de preço aplicado personalizável
- Visualização em janela separada
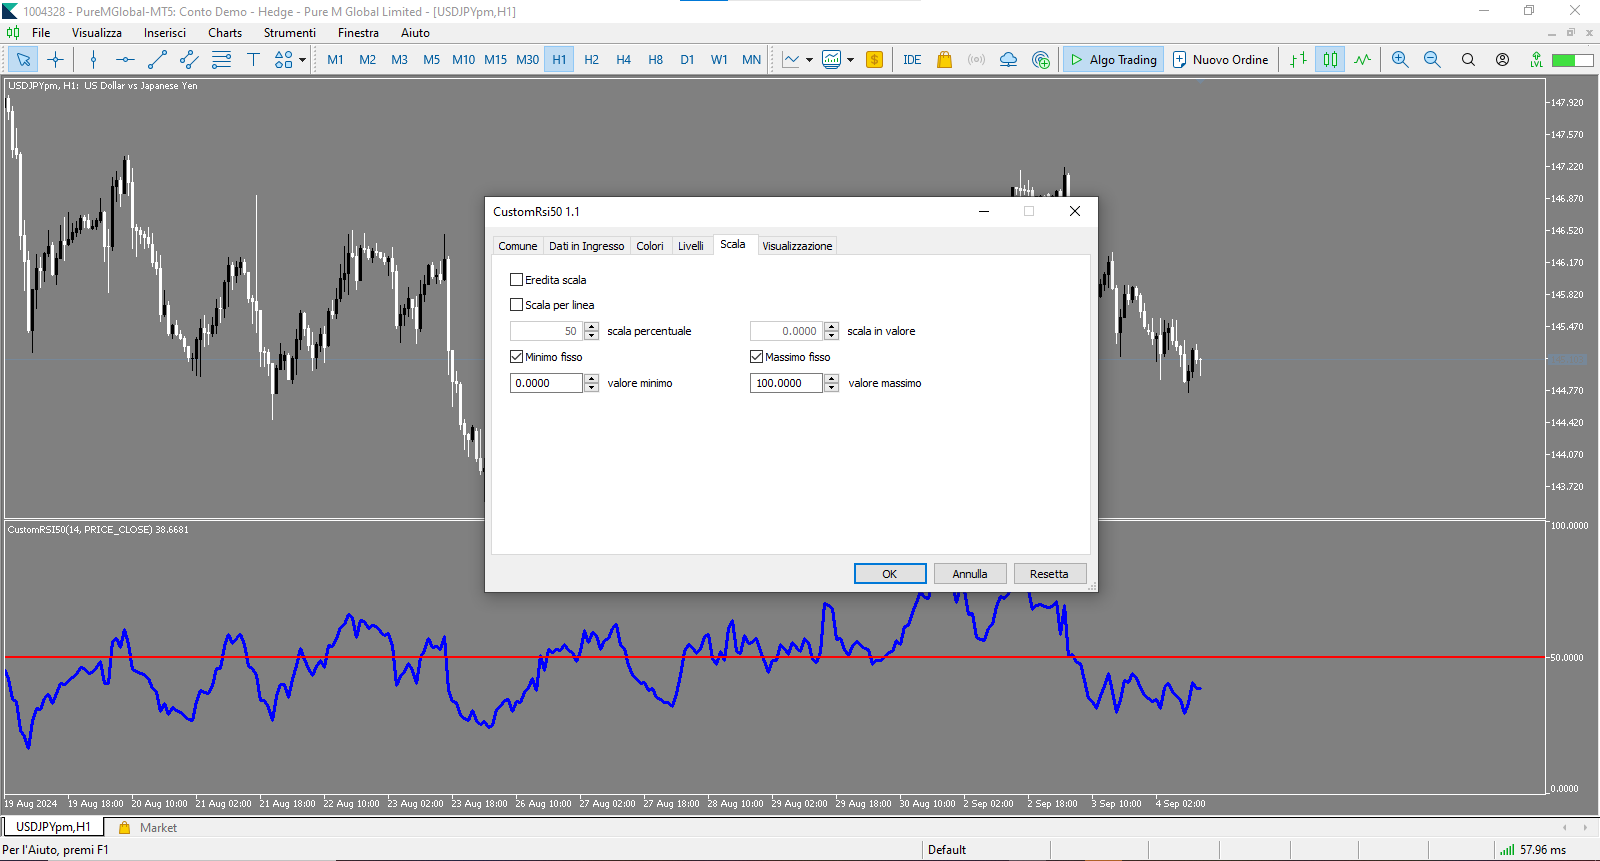
- Escala fixa de 0 a 100 para fácil interpretação
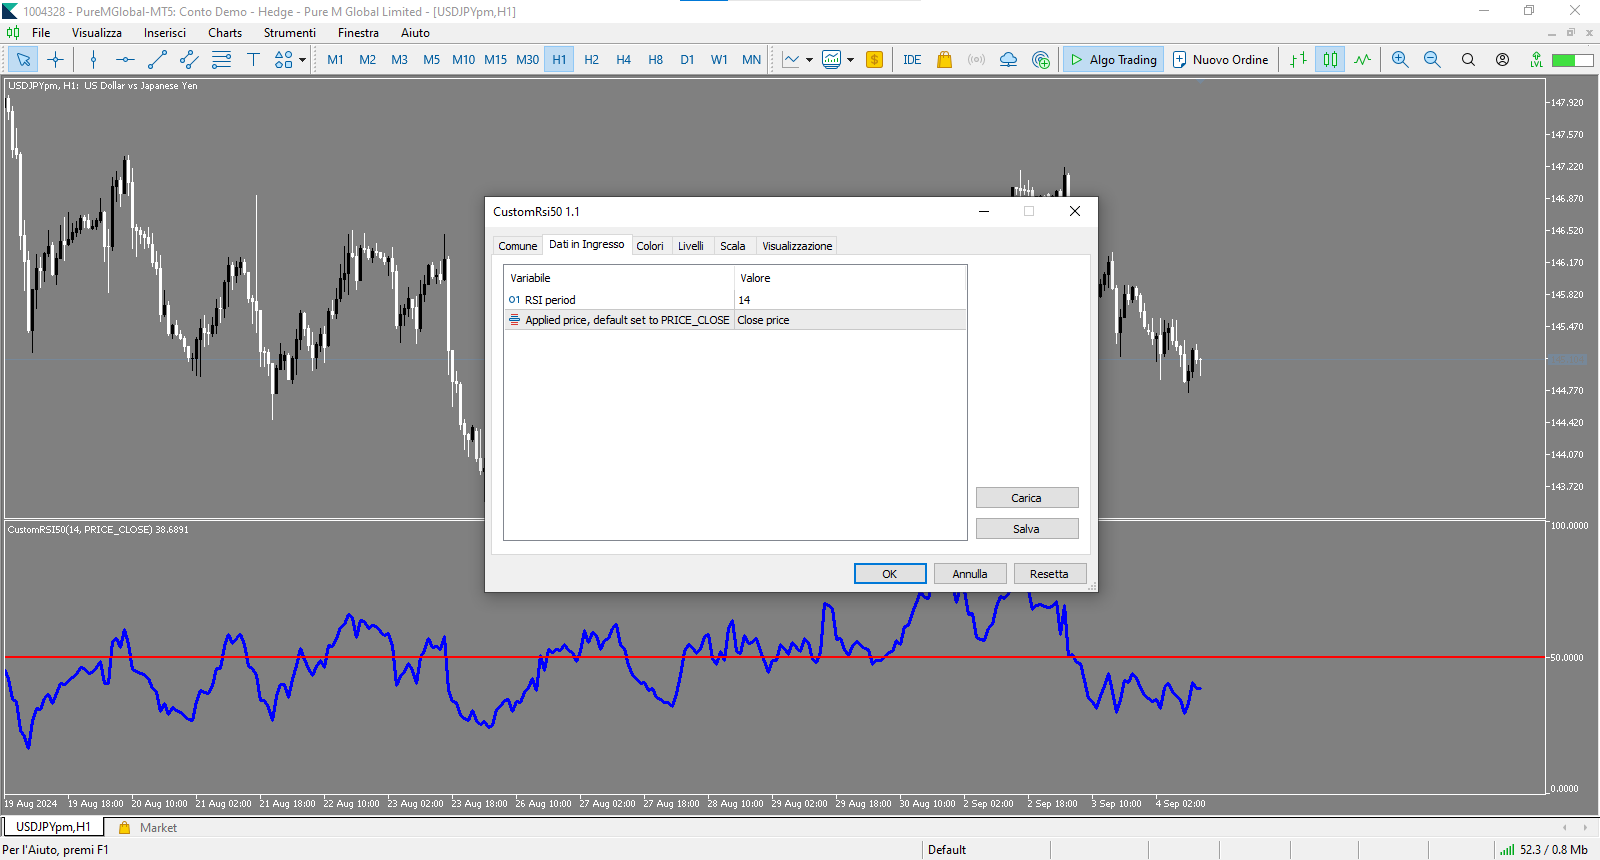
Parâmetros Personalizáveis
- RSI_Period: Permite definir o período para o cálculo do RSI (padrão: 14)
- applied_price: Permite selecionar o tipo de preço a ser usado para o cálculo (padrão: preço de fechamento)
Como Utilizar o CustomRSI50
- Aplique o indicador a qualquer gráfico no seu MetaTrader 5.
- Personalize o período RSI e o tipo de preço de acordo com suas preferências.
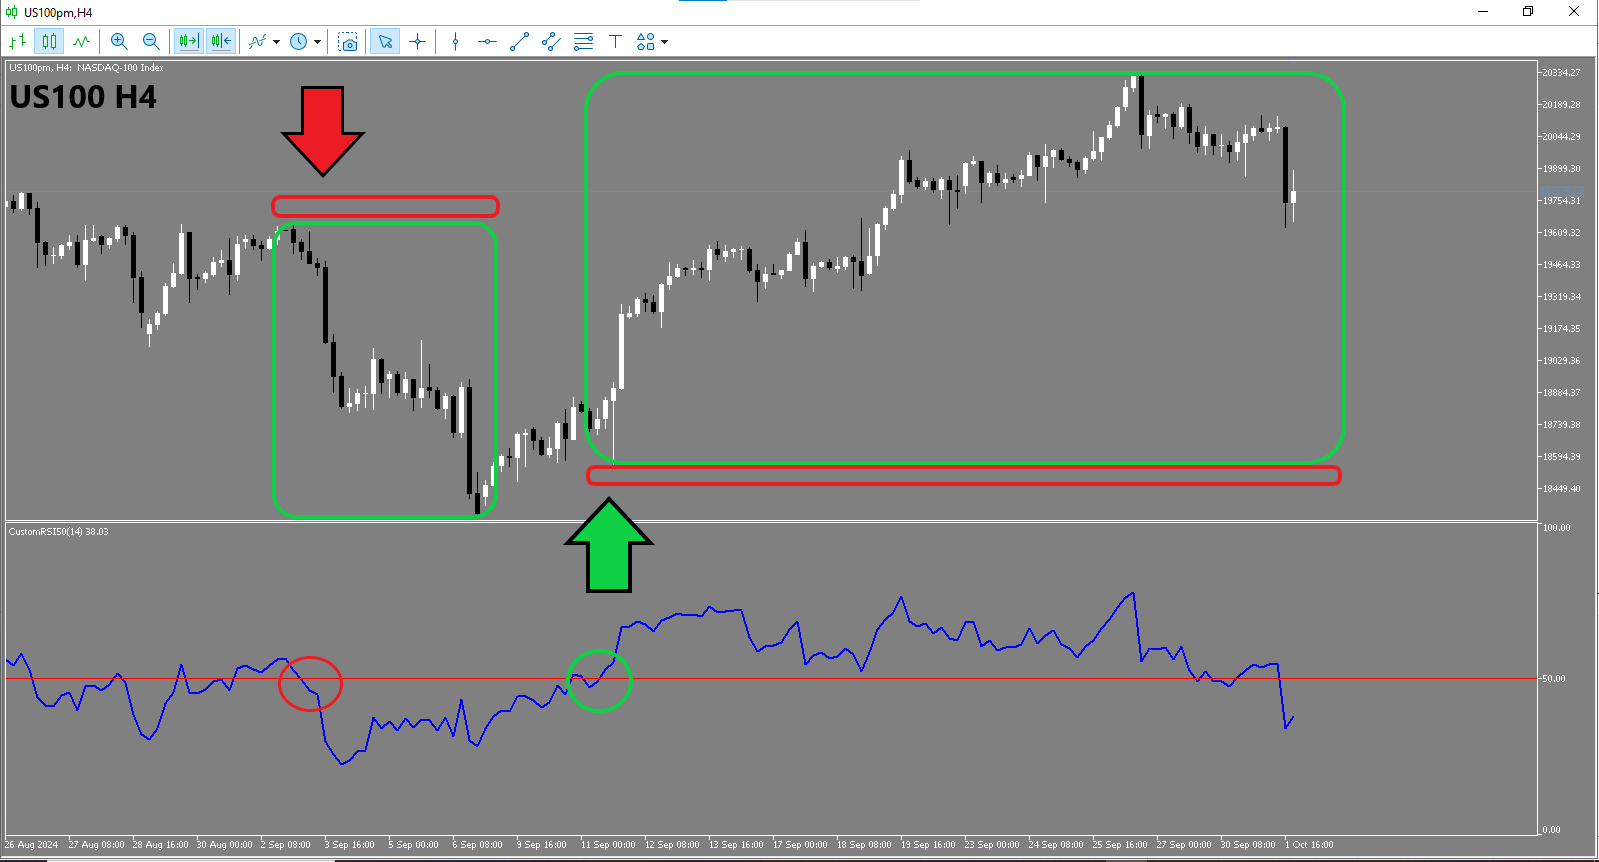
- Observe o movimento do RSI em relação ao nível 50:
- Valores acima de 50 indicam um momentum de alta.
- Valores abaixo de 50 indicam um momentum de baixa.
Interpretação de Sinais e Ciclos Superiores
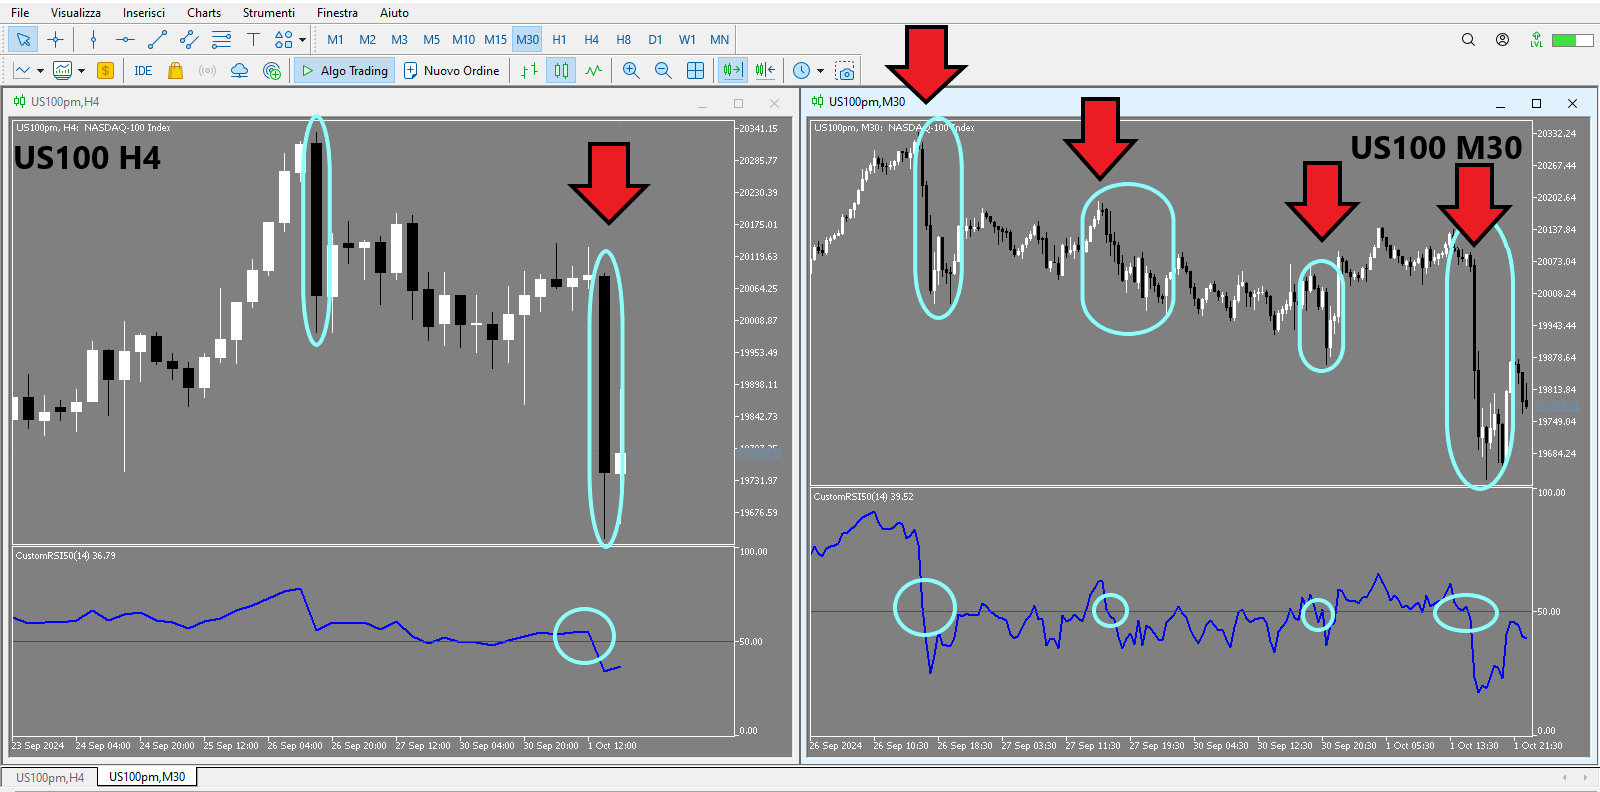
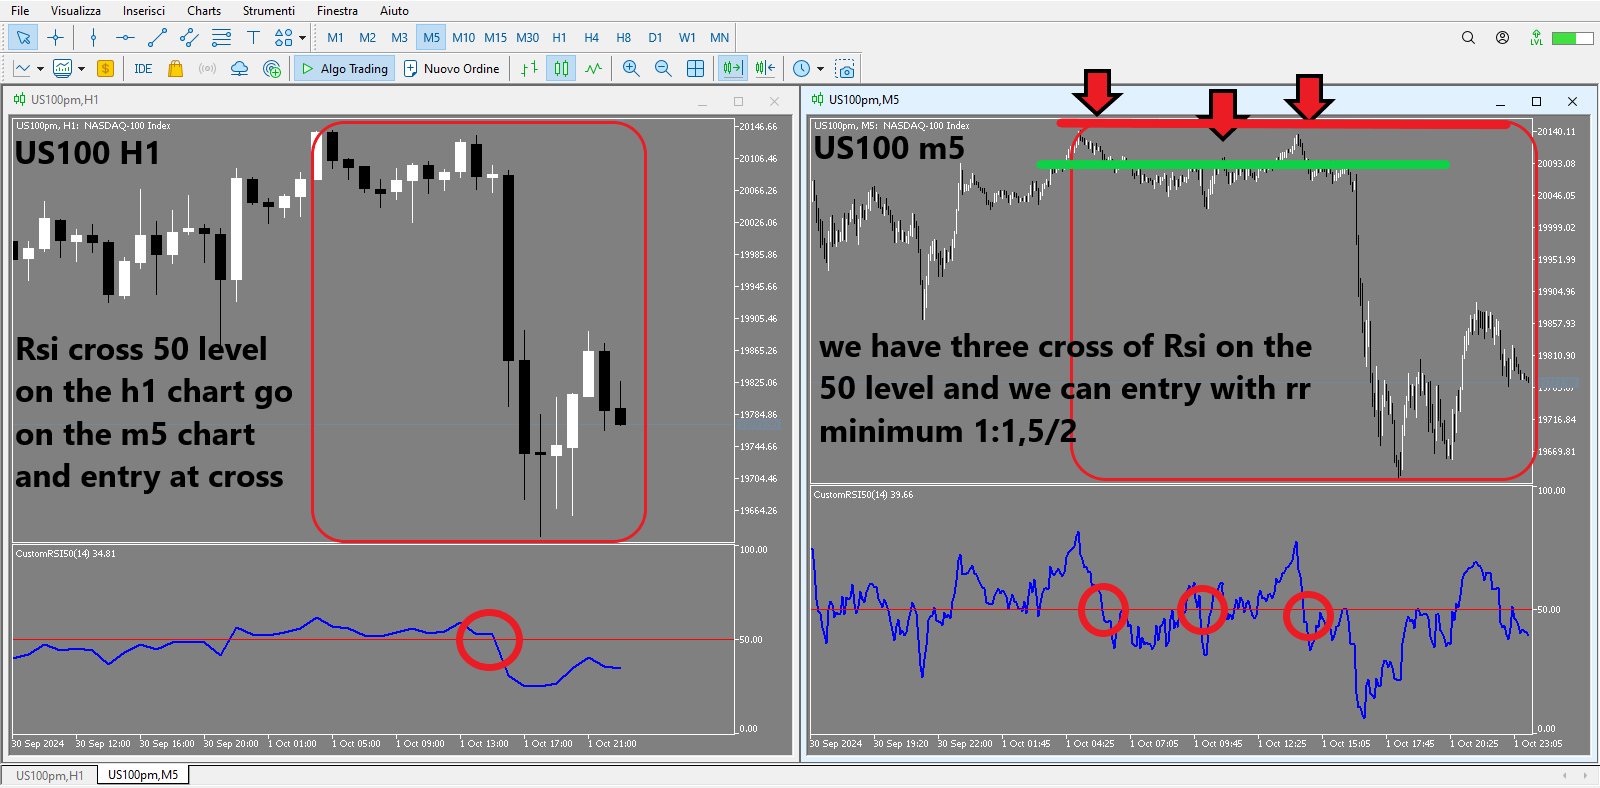
O indicador fornece sinais baseados no cruzamento do RSI em relação ao nível 50. Aqui está como usá-lo melhor:
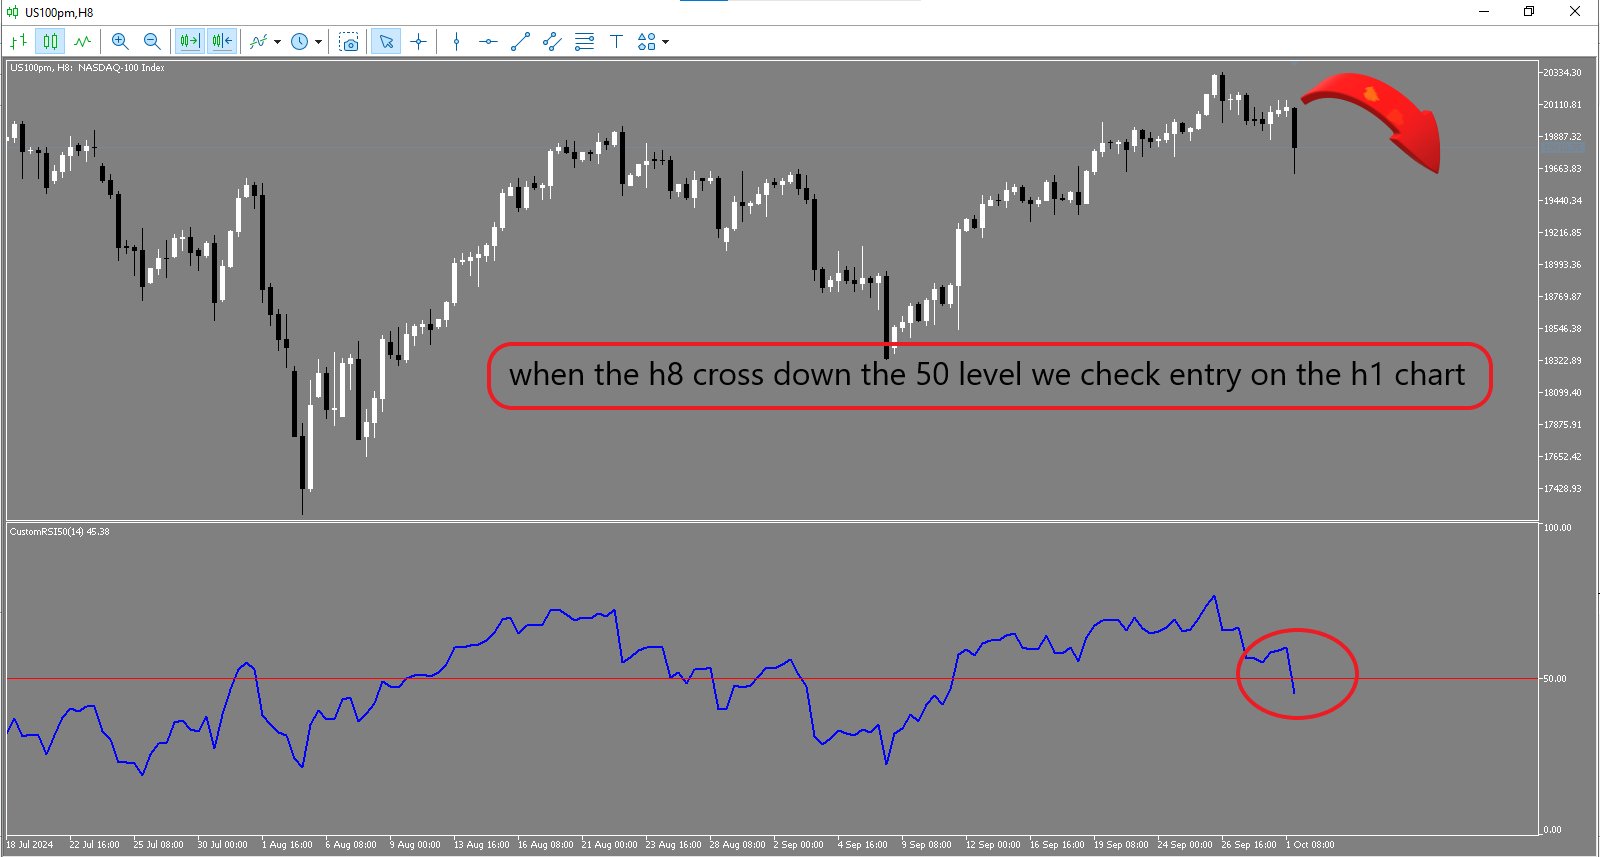
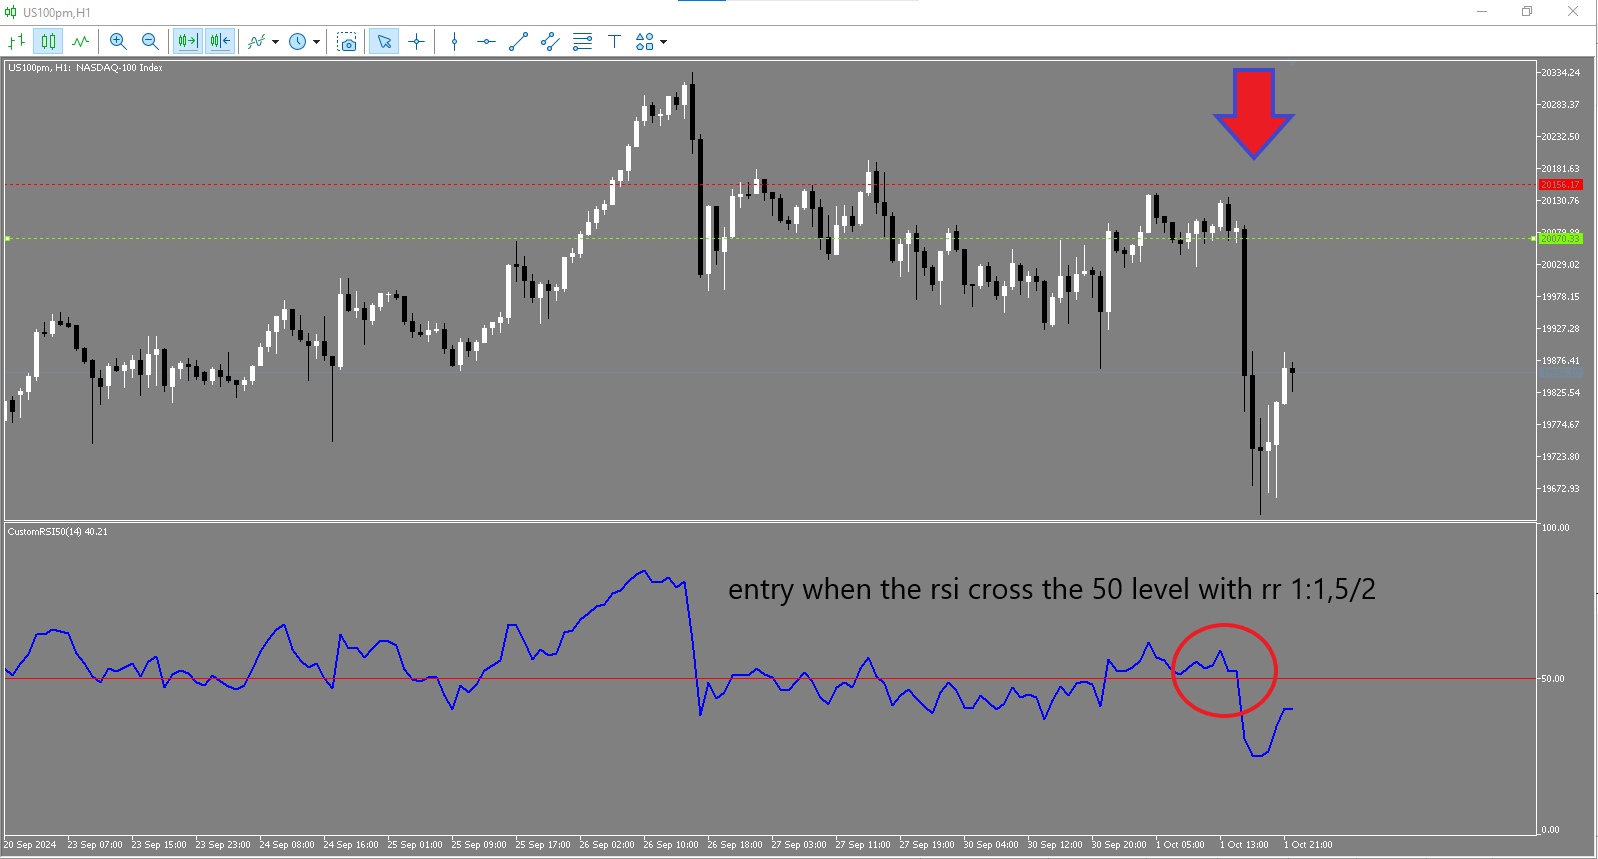
- Sinal de entrada: Quando o RSI cruza o nível 50 no fechamento da vela, você pode entrar com uma relação risco/retorno de 1:1.5, extensível se necessário.
- Confirmação do ciclo superior: Uma confirmação adicional pode ser obtida observando o comportamento do RSI em timeframes superiores. Por exemplo, se em um timeframe maior (H4 ou H8) o RSI estiver acima de 50, é preferível procurar apenas sinais de compra em timeframes menores como H1 ou M15.
Tabela para Confirmação do Ciclo Superior
| Timeframe Operacional | Timeframe de Confirmação | Estratégia de Ação |
|---|---|---|
| M5 | H1 | Procure sinais de compra em M5 apenas se o RSI em H1 estiver acima de 50; sinais de venda se estiver abaixo de 50 |
| M15 | H4 | Procure sinais de compra em M15 apenas se o RSI em H4 estiver acima de 50; sinais de venda se estiver abaixo de 50 |
| H1 | H8 | Procure sinais de compra em H1 apenas se o RSI em H8 estiver acima de 50; sinais de venda se estiver abaixo de 50 |
| H4 | Diário | Procure sinais de compra em H4 apenas se o RSI no Diário estiver acima de 50; sinais de venda se estiver abaixo de 50 |
Vantagens
- Visualização clara do momentum do mercado
- Fácil identificação de mudanças de tendência em torno do nível 50
- Personalização para se adaptar a diferentes estratégias de trading
Versão Avançada
Descubra a versão avançada do CustomRSI50AlertAndMail. Disponível por $30, esta versão premium inclui funcionalidades adicionais como o envio de e-mails e alertas sonoros a cada cruzamento do RSI em relação ao nível 50, para nunca perder um sinal importante! Clique aqui para saber mais.
CustomRSI50 é a ferramenta ideal para traders que desejam uma análise clara e personalizável do RSI, com ênfase particular no nível crítico de 50. A integração com os ciclos superiores adiciona um nível extra de confirmação, tornando o indicador confiável para várias estratégias de trading.