ICT standard deviations projects
- Indicadores
- Minh Truong Pham
- Versão: 1.0
- Ativações: 5
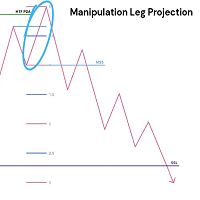
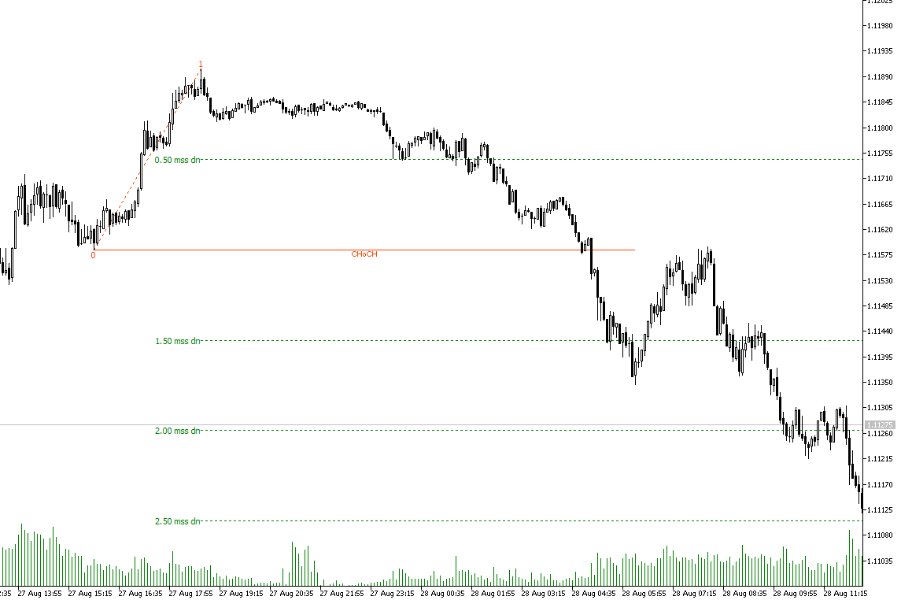
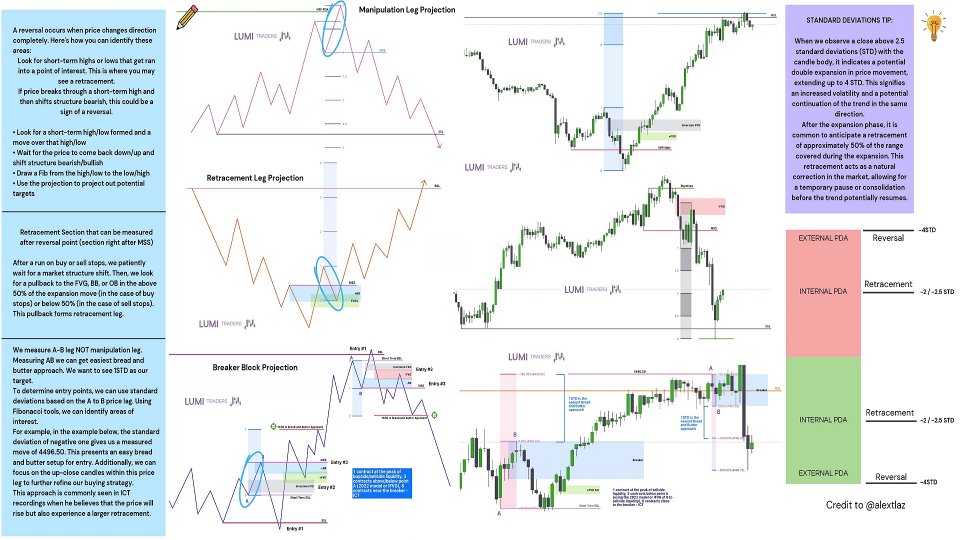
This indicator delves into using standard deviations as a tool in trading, specifically within the Inner Circle Trader (ICT) framework. Standard deviations are a statistical measure that helps traders understand the variability of price movements. These projections is use to forecast potential price targets, identify support and resistance levels, and enhance overall trading strategies.
Key Concepts:
-
Understanding Standard Deviations:
- Standard deviations measure how much a set of values (in this case, price) deviates from the mean (average). In trading, this concept helps predict the range within which price is likely to move, offering insights into market volatility.
-
Application in ICT Methodology:
- The ICT methodology emphasizes precision in trading, and standard deviations provide a mathematical basis for setting price targets and stop-loss levels. This help user to improve decision-making.
-
Forecasting Price Targets:
- By calculating standard deviations from a given price point, traders can project potential future price movements. This indicator shows how to identify these projections on price charts, making it easier to set realistic targets for entries and exits.
-
Identifying Support and Resistance Levels:
- Standard deviations can also highlight key support and resistance levels. These levels are crucial in determining where the price might reverse or continue its trend, allowing traders to make more informed decisions.
-
Enhancing Risk Management:
- Integrating standard deviation projections into trading strategies helps manage risk more effectively.
Value:
This indicator is aimed at traders looking to deepen their understanding of statistical tools in trading. It’s especially useful for those following the ICT methodology, as it aligns with the principles of precision and calculated risk.
Settings:
+ Market Structure Shift Length
+ Color settings
+ Level settings
