Reversal Up Down Arrows MT5
- Indicadores
- Vitalyi Belyh
- Versão: 1.20
- Ativações: 7
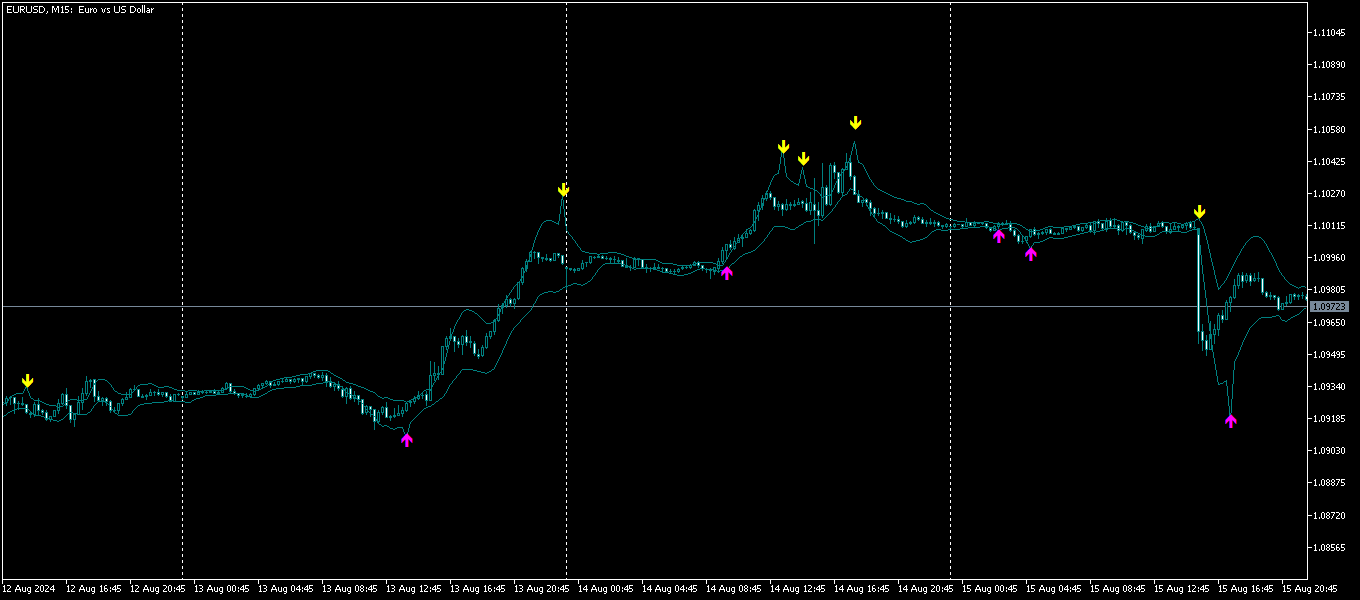
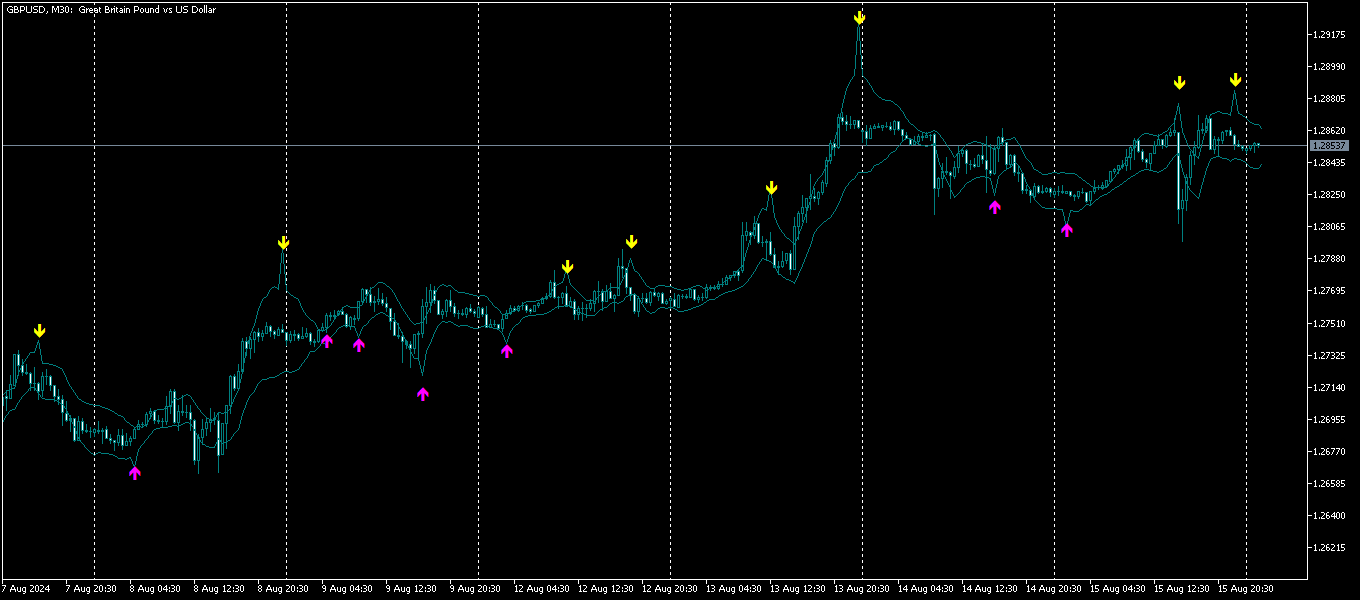
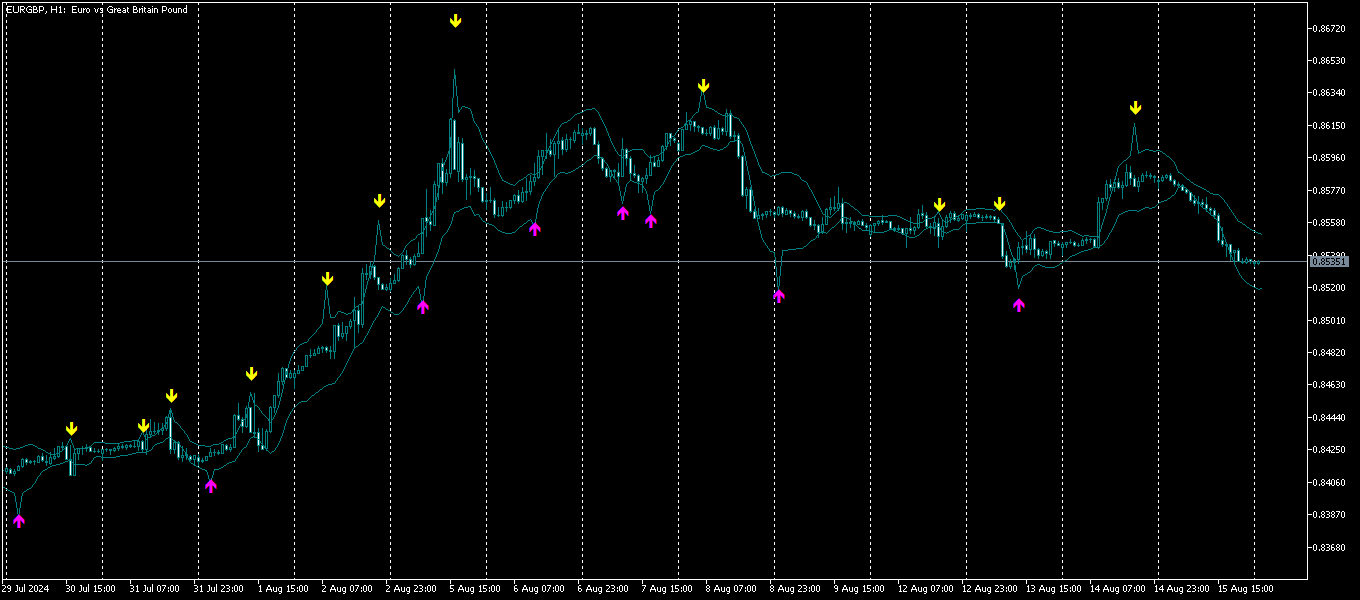
Um conjunto de indicadores que reconhecem pontos de viragem. Deteta topos e fundos de combinações de velas após subtraí-los a dois MAs. Aplicável para sistemas de negociação ao utilizar entradas antecipadas. Pode ser utilizado ao longo da tendência para scalping e negociação intradiária e para detetar reversões de tendência nas fases iniciais.
Possibilidades
Parâmetros de entrada
Possibilidades
- Os parâmetros fornecem definições flexíveis para quaisquer prazos e instrumentos de negociação.
- Existem vários tipos de alertas para sinais.
- Seta amarela - Sell signal , seta rosa - Buy signal .
- O cálculo otimizado do indicador permite abri-lo em vários gráficos sem consumir o processador.
- O indicador nunca é redesenhado, todos os sinais são apenas quando a vela fecha.
Parâmetros de entrada
- First Line - Primeiro período MA para cálculo de sinais
- Second Line - O período do segundo MA para o cálculo dos sinais (recomenda-se configurá-lo 2 a 4 vezes mais que o período do primeiro MA)
- Play Sound / Display Pop -up Message / Send Push Notification / Send Email - Utiliza notificações quando aparecem setas de sinal e stops.
- Sound for Signals - Ficheiro de som para sinais.