Congestion Breakout Pro Mt5
- Indicadores
- Noiros Tech
- Versão: 1.0
- Ativações: 10
Congestion are areas in the market where the bull and the bear match each other strength for strength , when this power struggle between supply (bull) and demand (bear) comes to an end, the victor usually define the new market trend. This makes congestion zones one of the best places to enter a trade in a market.
3.) Non-repaint, Non-Backpaint : This indicator is a non-repaint and non-backpaint indicator. Signals are confirmed on previously closed candle before display.
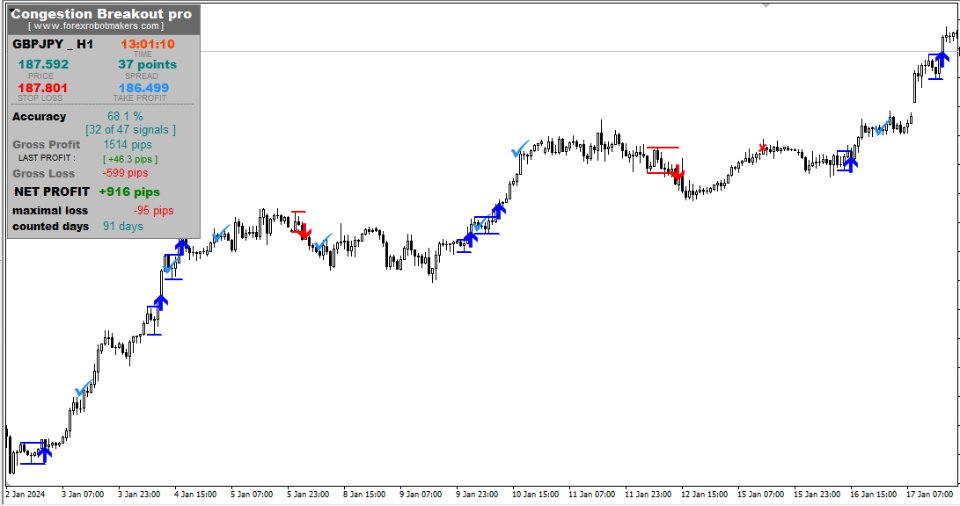
STATISTICS DASHBOARD INFORMTION
Some of the information given by the statistics dashboard includes :
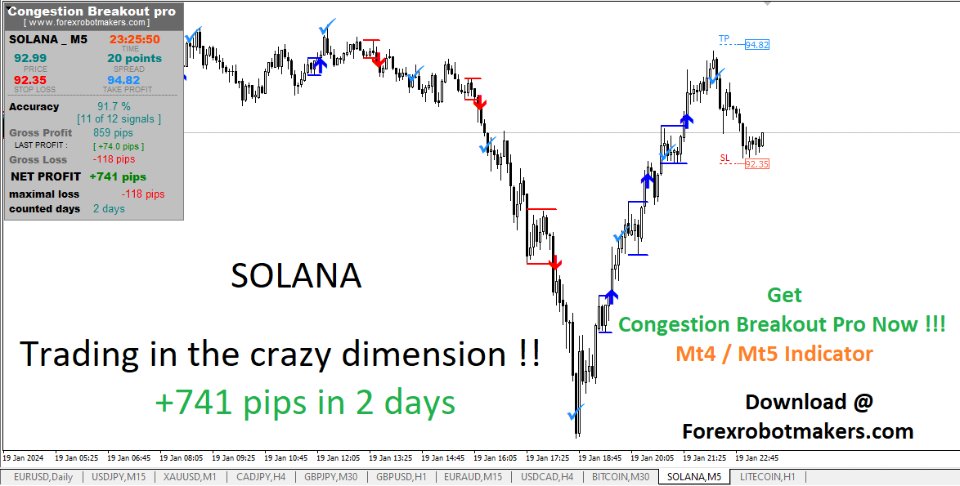
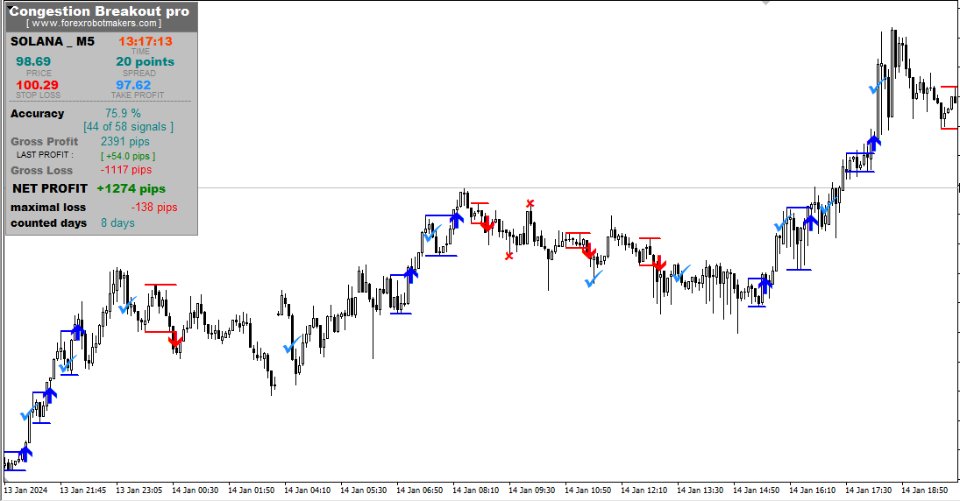
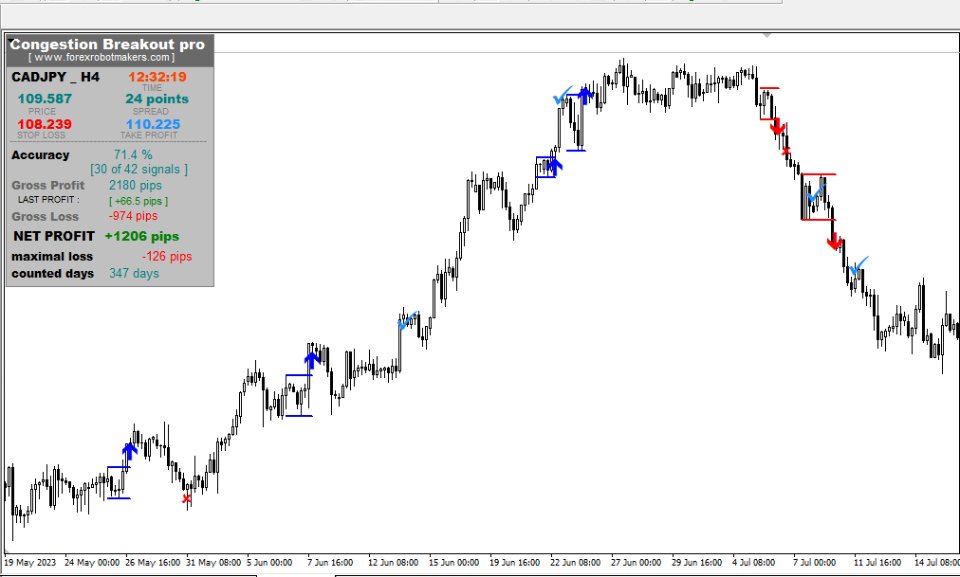
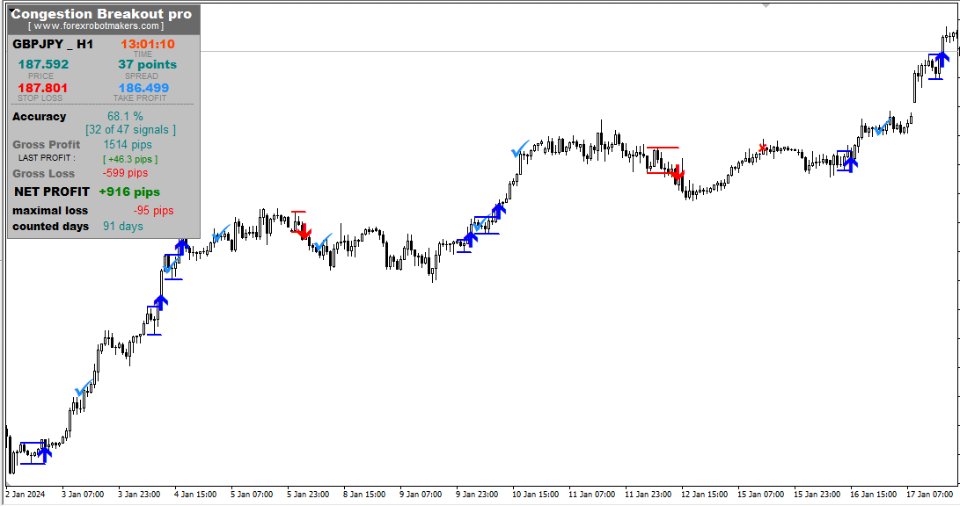
1.) Current Stop Loss & Take Profit : The stop loss and take profit of the current pattern formed is shown on the stats.
2.) Accuracy : The accuracy of all signals is calculated as the percentage of the total signals that were profitable.
Accuracy = (Profitable Signals /Total Signals)*100
Also along with the accuracy calculated the profitable signals and the total signals counted are also displayed for transparency.
3.) Gross Profit (pips) : The gross profit in pips is the total profit in pips generated from the signals before excluding the losses.
Gross Profit = profit( trade 1 ) +...+profit( trade n ) , where n is the total number of profitable trades.
4.) Gross Loss (pips) : The gross profit in pips is the total loss in pips incurred from the signals.
Gross Loss = Loss( trade 1) +...Loss(trade n) , where n is the total number of losing trades.
5.) NET PROFIT : The NET profit in pips is the total profit in pips generated from the signals after excluding the losses.
Net Profit = Gross Profit - Gross Loss6.) Maximal Loss/DrawDown (pips) : The maximal loss is the highest loss incurred on a single trade during the history of testing.
7.) Counted Days : Total number of trading days counted given the current history tested. With this information along with the Net Profit, traders can calculate their average daily profit.
HOW TO USE
We have designed this indicator to be as much as possible very easy to use by even a Novice Trader.
1.) The indicator can virtually be used with any pair/symbol and time frame
2.) Simply use the statistics dashboard to know the best pair and time frame to trade , the best pair and time frame is signed by high accuracy and high net profit.
3.) Simply change the settings to increase accuracy and watch the dashboard as you do so to get the best setting for the pair and time frame you want to trade.
4.) Set your stop loss and take profit to the indicator stop loss and take profit.
5.) Exit your trade when the check mark appears.
DEFAULT SETTING
The current default setting works better with the following pairs and time frames :
- CADJPY - H1 , M15
- NZDJPY - H1, M30
- CHFJPY - H1, M30 ,M15
- GBPJPY - H1, M15
- AUDJPY - H1 , M30
- GBPNZD - H1 , M30
- NZDCHF - H1
- USDCHF - H1 , M30
- BITCOIN - M30
- BRN ( BRENT CRUDE OIL ) - M15
- WTI CRUDE OIL - M15
- NQ100 ( NASDAQ INDEX ) - H1, M30
You can modify the settings for any pair and time frame to get the best Accuracy and Net Profit
DYNAMIC EXIT
Before a stop loss or take profit is hit ,exit signals can be given sometimes based on the market dynamics , this option is true if Scalping or Break Even exit are activated, this is designed to reduce loses while locking in necessary profits. So exit your trade when the check mark appears.
NET PROFIT vs. ACCURACY
Sometimes the indicator might show a high accuracy but with little Net profit , especially when the Scalping and Break Even options are enabled . The goal of a trader is to make profit so you should put more importance on the Net Profit than the accuracy , any accuracy above 65% is ok. So when you are adjusting the settings on the indicator , as long as your accuracy is above 65% , try to ensure the Net Profit is given more precedence .
INPUT PARAMETERs
1.) History : The History /Candle Stick Bar Count taken into consideration for testing.
2.) Moving Average Filter : Enabling the moving average filter ensures that all trades are in the direction of the moving average , buy signals are thus given above the the moving average line and sell signals are given below the moving average line
3.) Risk To Reward Ratio (TP) : This setting is used to set the take profit level of the indicator , it is the ratio of the stop loss distance to set as take profit
4.) Spread factor : Due to currency spread and volatility , price might hit a stop loss level ,only to return in the direction of your trade again immediately. The Spread Factor is an offset value added to the stop loss level to account for spread and volatility.
5.) Maximum BreakOut Ratio : The ratio just like the risk reward is measured as a ratio of the stop loss distance . It is the maximum ratio below which a breakout is valid.
6.) Minimum Profit : This is the minimum profit in pips used to adjust the take profit calculated by the risk to reward ratio. This is to ensure trades don't close too early.
7.) Allow Scalping ? (true/false) : When this option is enabled , trades are exited when there is an opposite candle formation.
8.) Allow Break Even Exit ? (true/false) : When trades exceeds a certain number of bars without closing out, the breaking even exit helps to exit the trade when price touches the opening price of the signal.
9.) Break Even Bars : Minimum number of bars to consider before activating break even exit
10.) Break Even Profit (pips) : Pips to be added to the opening price before trade is exited by the Break Even Option
YOU CAN NOW DOWNLOAD FREE VERSIONS OF OUR PAID INDICATORS . IT'S OUR WAY OF GIVING BACK TO THE COMMUNITY !

