• Visão global
  • Comentários
  • Discussão
  • O que há de novo

Delta volume AV

O delta volume é uma ferramenta poderosa utilizada em várias estratégias de operação, especialmente no trading de futuros, ações e criptomoedas. Aqui estão algumas das principais estratégias onde o delta volume é frequentemente aplicado:

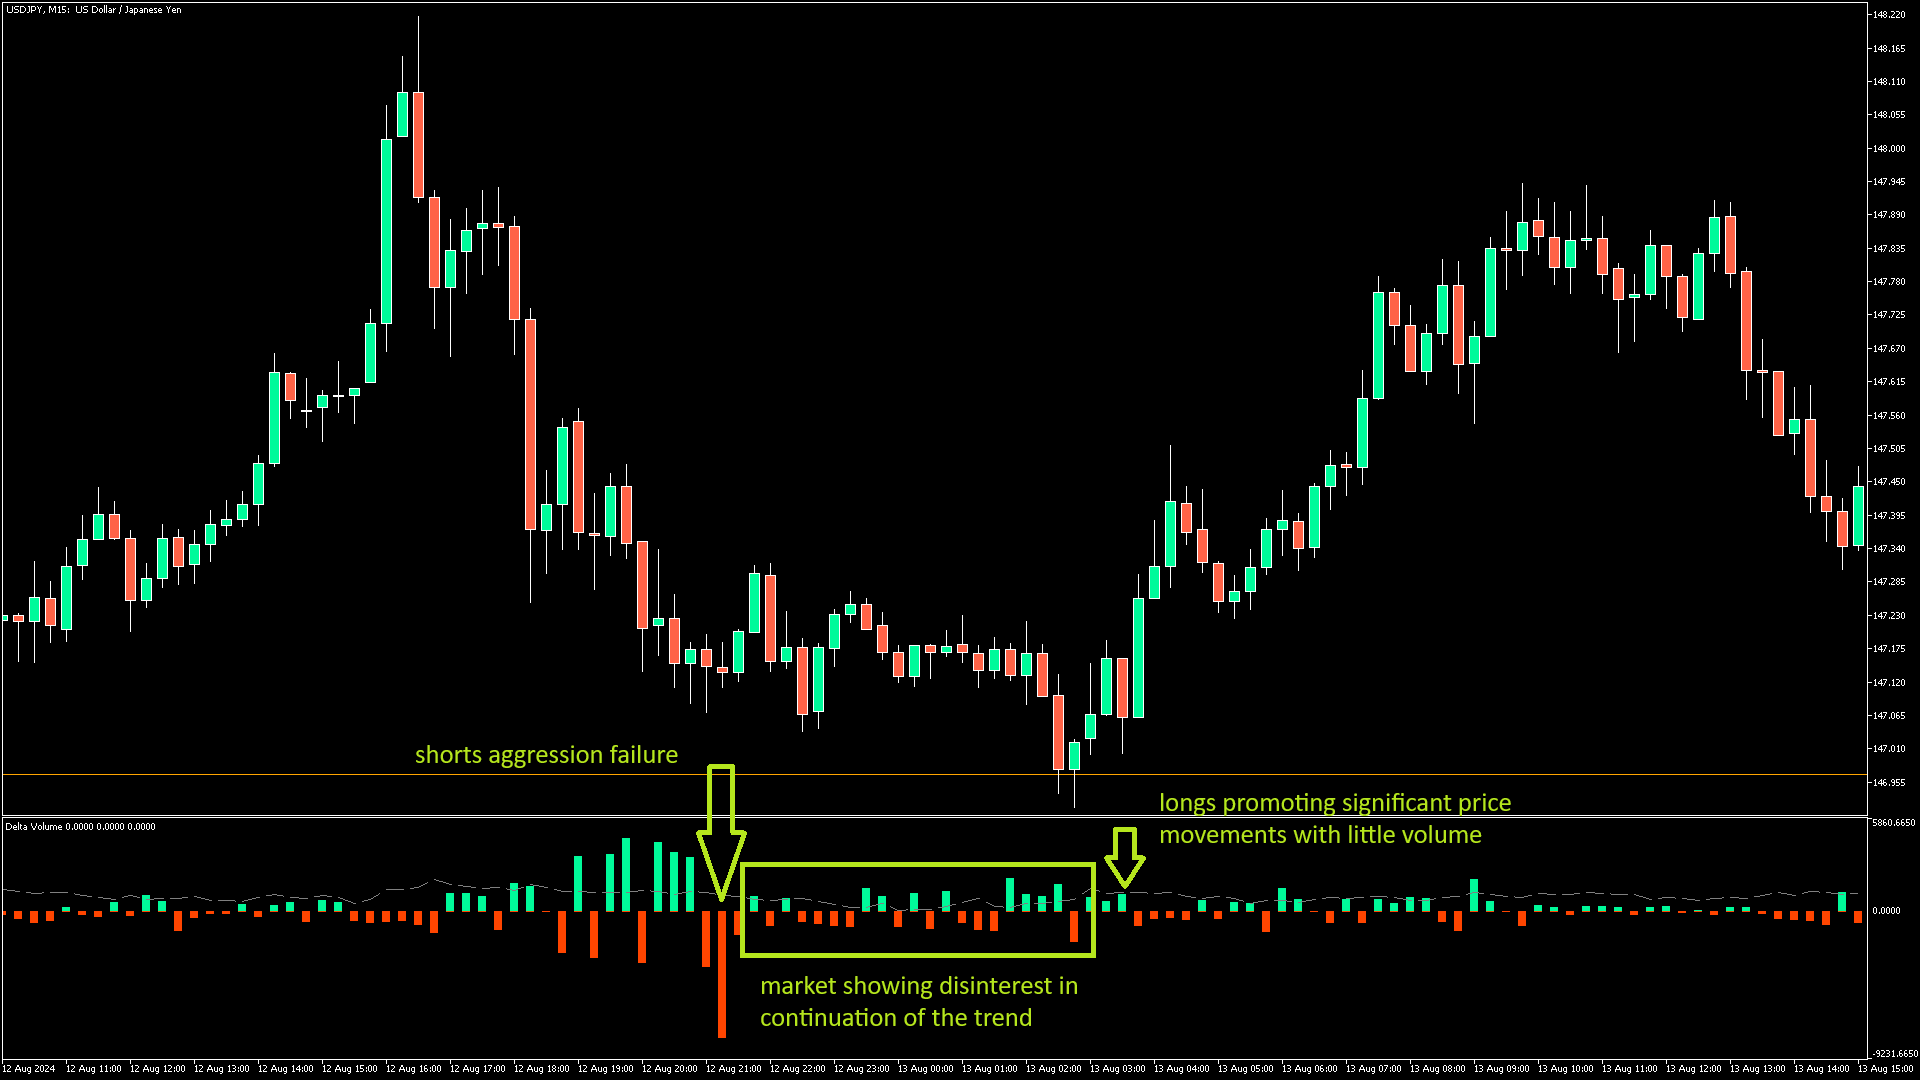
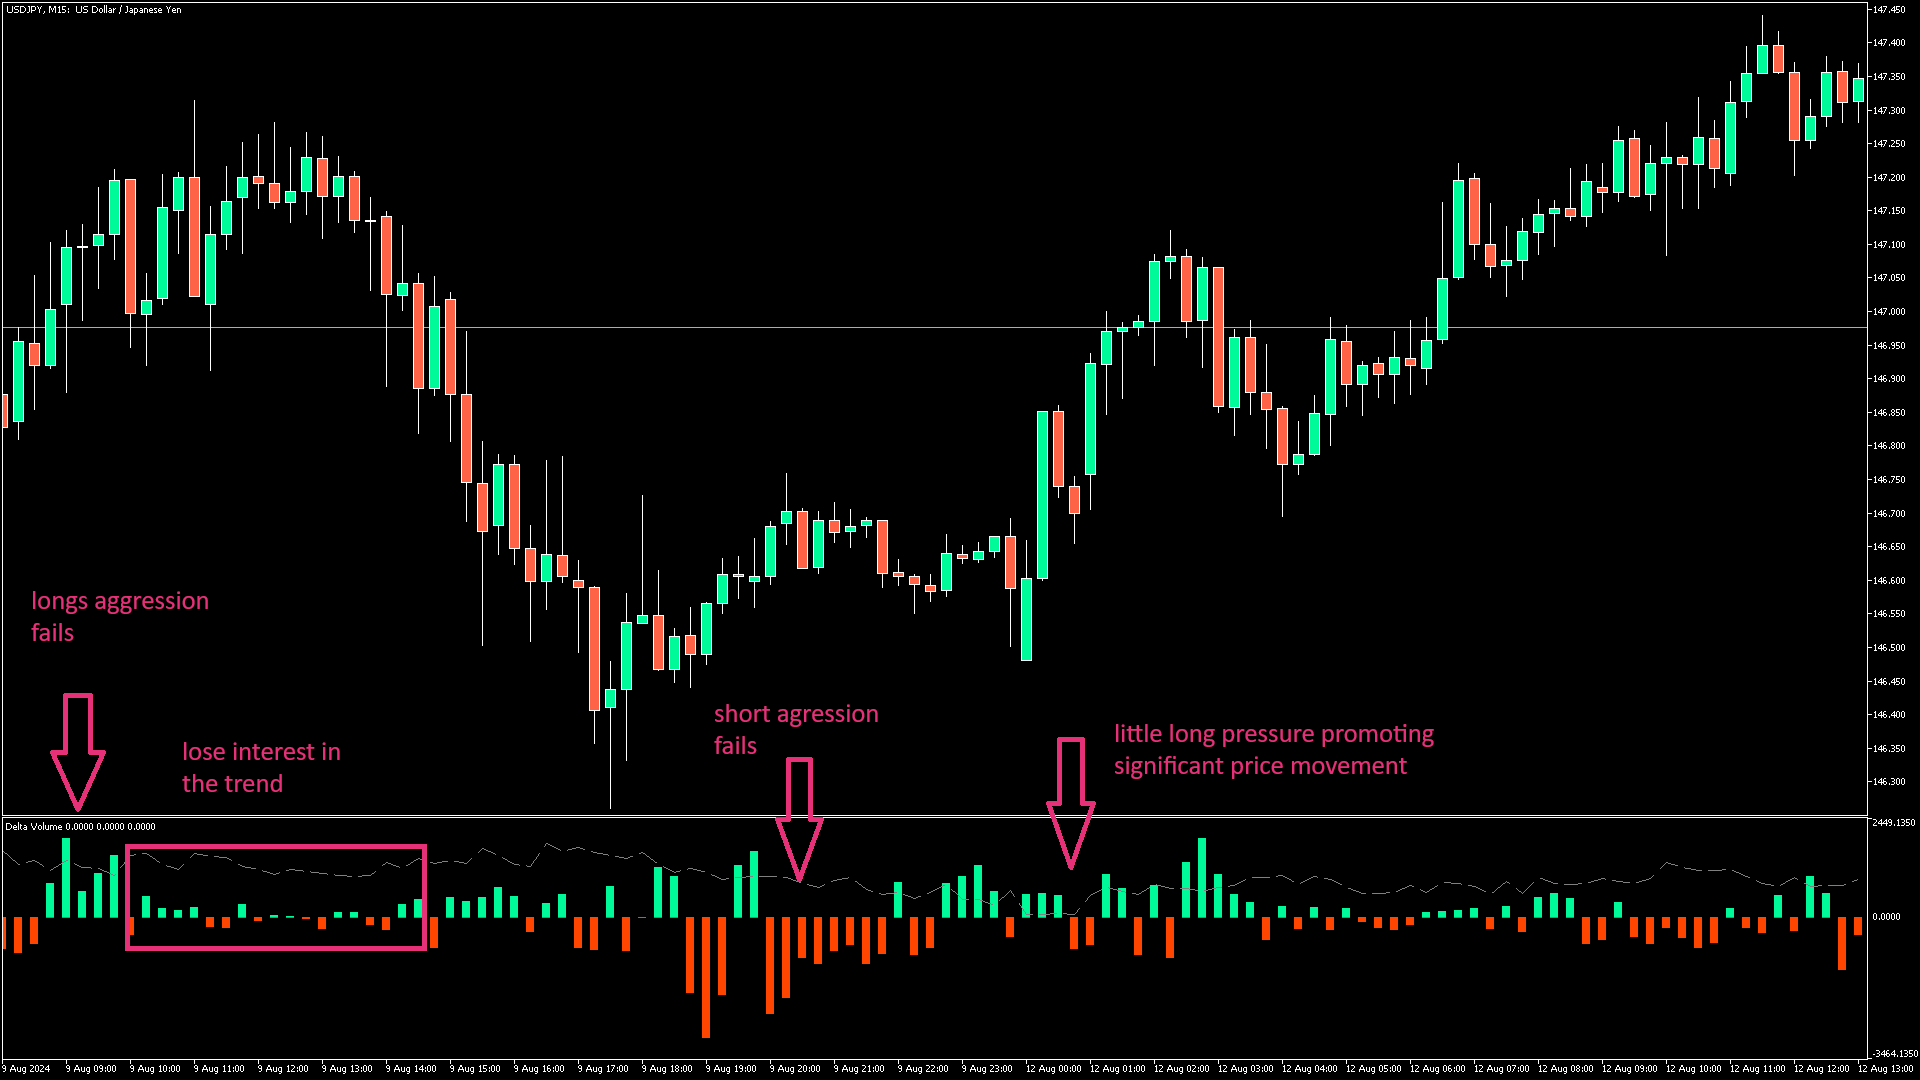
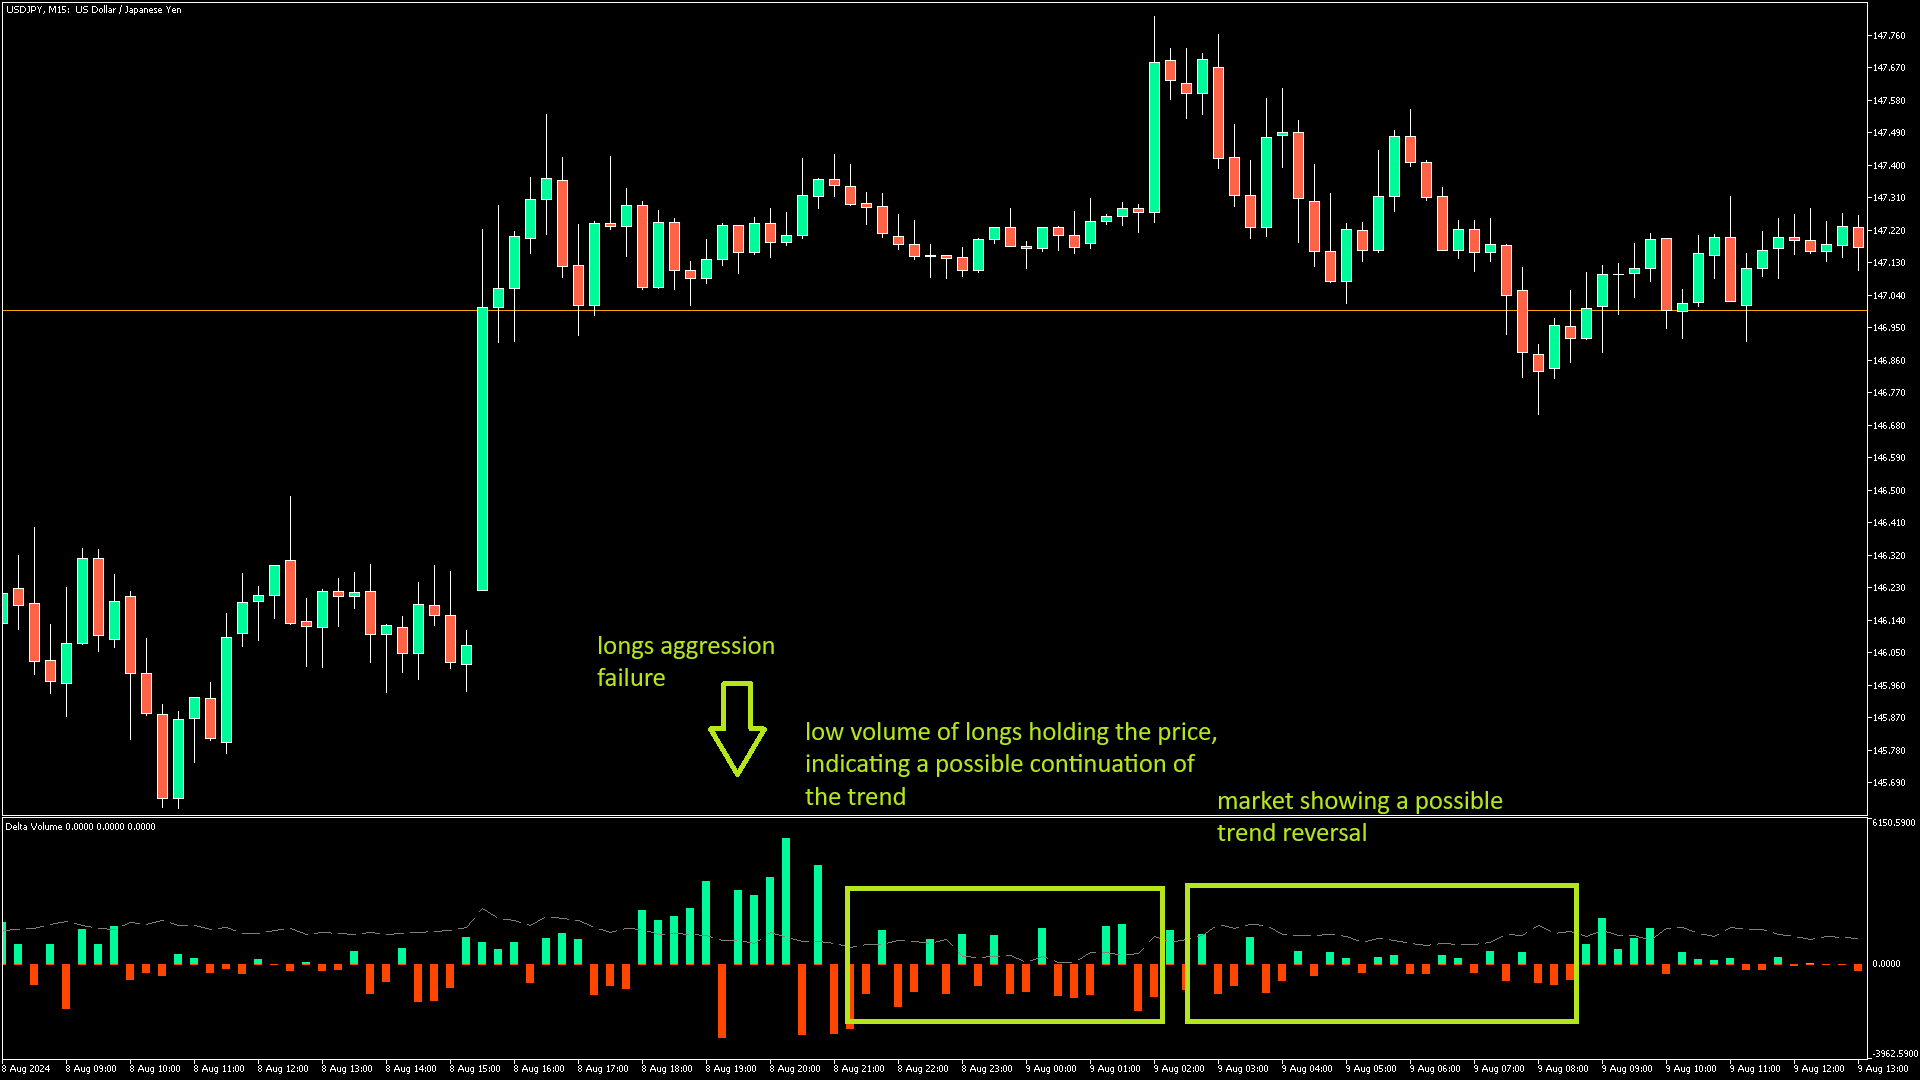
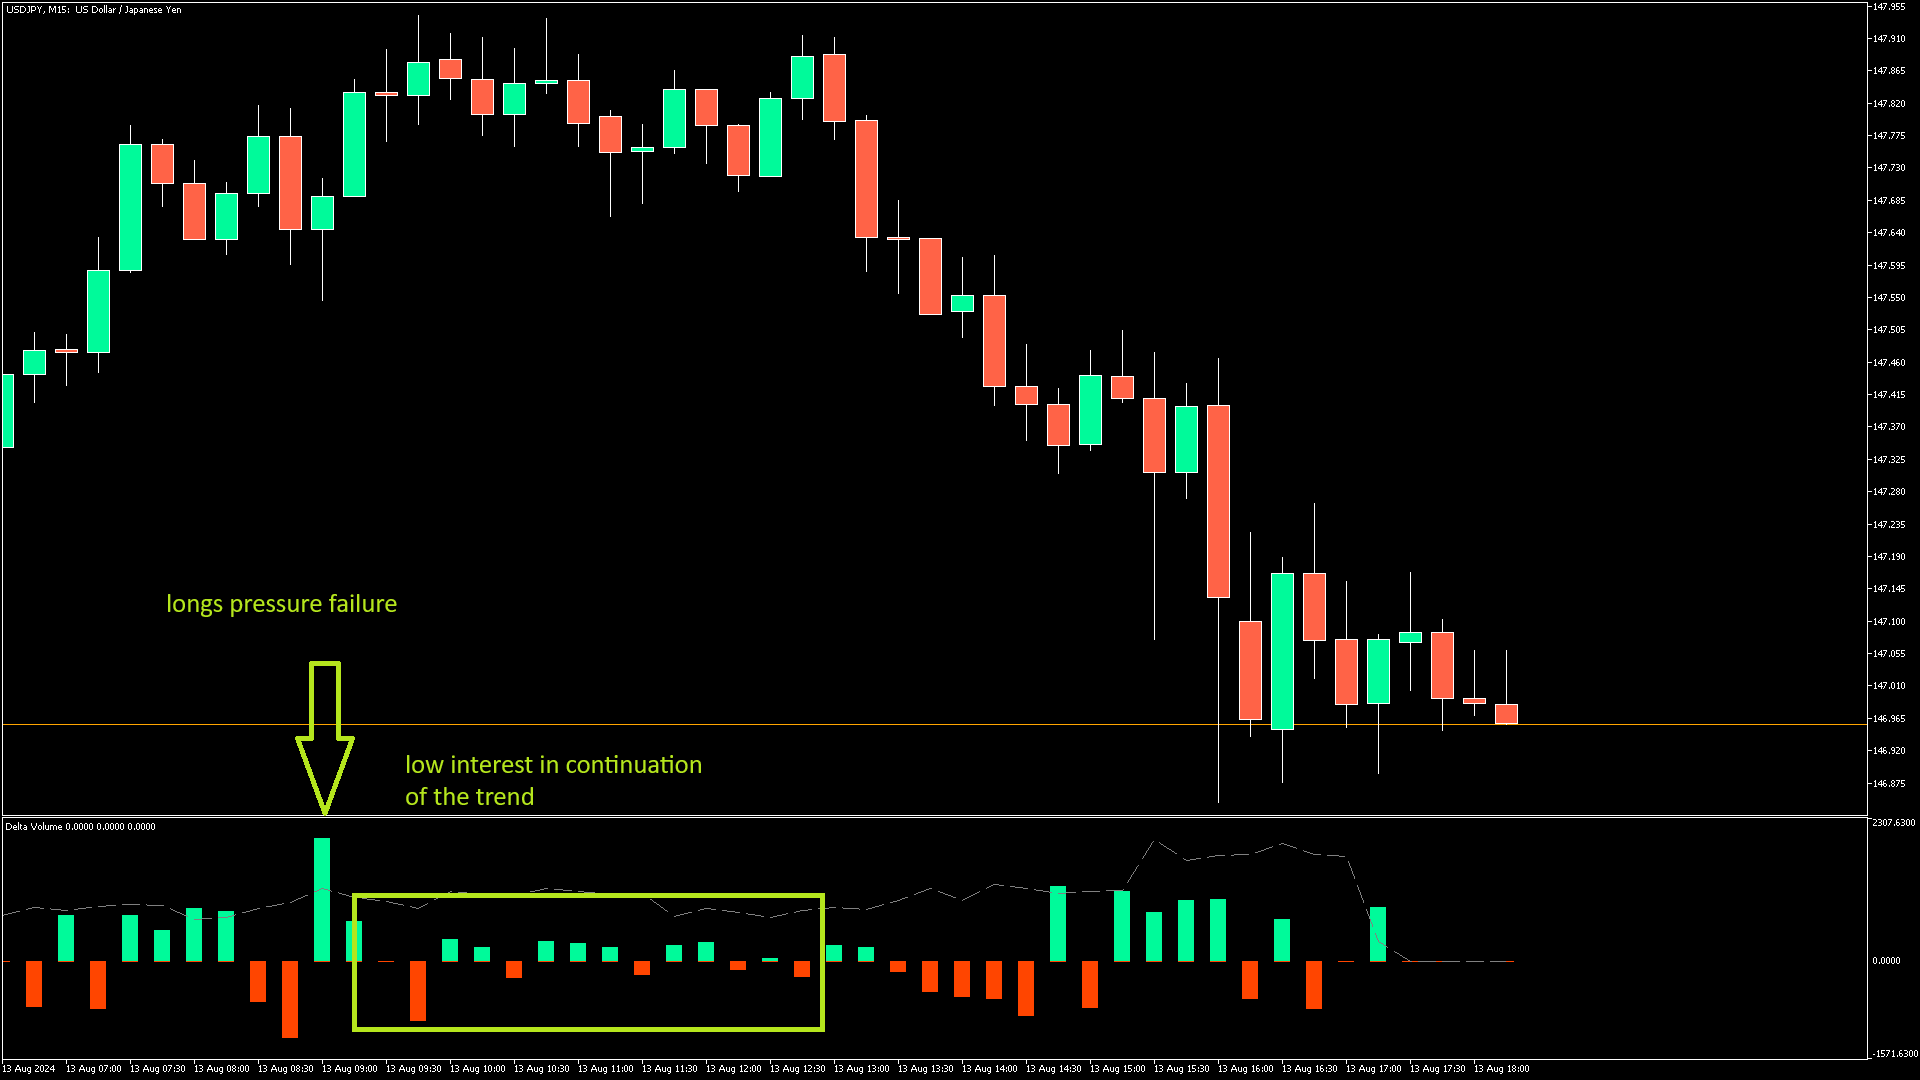
  1. Identificação de Tendências:

    • O delta volume ajuda a identificar a direção da tendência predominante, mostrando se há mais pressão de compra ou venda. Isso pode ser útil para confirmar a força de uma tendência ou identificar possíveis reversões.
  2. Confirmação de Breakouts:

    • Quando o preço rompe um nível de suporte ou resistência, o delta volume pode ser usado para confirmar a validade desse breakout. Um aumento significativo no delta volume positivo durante um breakout de alta, por exemplo, sugere que há forte pressão de compra apoiando o movimento.
  3. Divergências:

    • Os traders podem usar o delta volume para identificar divergências entre o preço e o volume. Por exemplo, se o preço está subindo, mas o delta volume está diminuindo, isso pode indicar uma fraqueza na tendência de alta e uma possível reversão.
  4. Análise de Volume em Tempo Real:

    • Em mercados de alta frequência, o delta volume pode ser usado para analisar o fluxo de ordens em tempo real, ajudando os traders a tomar decisões rápidas com base na atividade de compra e venda.
  5. Estratégias de Scalping:

    • Scalpers podem usar o delta volume para identificar oportunidades de curto prazo, aproveitando pequenos movimentos de preço baseados em mudanças rápidas no volume de compra e venda.
  6. Trailing Stops Baseados em Volume:

Essas são apenas algumas das maneiras como o delta volume pode ser utilizado em estratégias de operação. Ele é uma ferramenta versátil que pode fornecer insights valiosos sobre a dinâmica do mercado.


Produtos recomendados
Visual Heatmap Book Analyzer
Alexandre Moraes De Souza Lima
Visual Heatmap Book Analyser Este indicador revolucionário monitora efetivamente a liquidez do mercado e gera as cores a partir de ordens de padrões de quantidades e atividades de renovações no livro. Isso permite que você visualize o fluxo de ordens e identifique áreas de alta e baixa liquidez e alta e baixa atividade. O indicador utiliza técnicas machine learning para analisar o comportamento das ordens no livro. Isso significa que ele pode detectar padrões e tendências nas ordens, permiti
WAPV Weis Wave Chart Forex
Eduardo Da Costa Custodio Santos
O Weis Wave Chart Forex para MT 5 é um um indicador de Preço e Volume. A leitura de Preço e Volume foi amplamente divulgada através de Richard Demille Wyckoff com base nas três leis criadas por ele: Oferta e Demanda, Causa e Efeito e Esforço x Resultado. Em 1900 R.Wyckoff já utilizava o gráfico de Ondas em suas análises. Muitos anos depois, por volta de 1990 , David Weis Automatizou o gráfico de ondas de R. Wyckoff e hoje nós trazemos a evolução do gráfico de ondas de David Weis. Ele mo
Was: $249  Now: $99   Market Profile defines a number of day types that can help the trader to determine market behaviour. A key feature is the Value Area, representing the range of price action where 70% of trading took place. Understanding the Value Area can give traders valuable insight into market direction and establish the higher odds trade. It is an excellent addition to any system you may be using. Inspired by Jim Dalton’s book “Mind Over Markets”, this indicator is designed to suit the
VolumeDeltaBars
Stanislav Korotky
This indicator is a conventional analytical tool for tick volumes changes. It calculates tick volumes for buys and sells separately, and their delta on every bar, and displays volumes by price clusters (cells) within a specified bar (usually the latest one). The algorithm used internally is the same as in the indicator VolumeDeltaMT5 , but results are shown as cumulative volume delta bars (candlesticks). Analogous indicator for MetaTrader 4 exists - CumulativeDeltaBars . This is a limited substi
A Média Móvel é um indicador que faz parte da Análise Técnica. Com ela, é possível identificar o equilíbrio dos preços no mercado, observando tendências de alta, neutra ou baixa. Este indicador customizado traz opções extras pera definir o método de cálculo podendo-se esclolher entre SMA,EMA,SSMA,LWMA,JJMA,JurX,ParMA,T3,Vidya,AMA,HULL MA. Também conta com varias opções para escolher o método de cálculo para o preço base a ser usado no cáculo da média.
Key level wedge MT5
Presley Annais Tatenda Meck
The   Key level wedge MT5   indicator automatically draws rising wedge pattern and falling wedge pattern for you on the chart. This pattern is really good when used as a confirmation entry at key support & resistance, supply & demand and reversal zones. Advantages  The   Key level wedge MT5   block DOES NOT RE-PAINT, giving you confidence when a signal appears and also helps when looking back.  The   Key level wedge MT5   includes an on/off button on the chart to easily keep the charts cle
SmartTrendMt5
Andrey Spiridonov
The SmartTrendMt5 trend indicator generates signals based on the principle of combined analysis of calculated reference points within the Keltner channel. The indicator plots the Keltner channel in a separate window (by default, red lines and a blue line - the middle of the channel), and also draws the histogram of calculated reference points for each candle (by default, the histogram bars are yellow). The should be attached to a chart of any timeframe and any trading symbol in the usual way.
Waves PRO
Flavio Javier Jarabeck
For those who appreciate Richard Wyckoff approach for reading the markets, we at Minions Labs designed a tool derived - yes, derived, we put our own vision and sauce into this indicator - which we called Waves PRO . This indicator provides a ZigZag controlled by the market volatility (ATR) to build its legs, AND on each ZigZag leg, we present the vital data statistics about it. Simple and objective. This indicator is also derived from the great book called " The Secret Science of Price and Volum
RAD CRITICAL LEVES RAD indicator tracks “Relevant Volume” in real time, identifying accumulation and distribution processes, projecting them in the chart as SUPPORT or RESISTANCE zones. Natural   support   and resistance levels are generated by Volume Accumulation and Distribution processes. As these processes evolve, levels at which the relevant volume in the market place is positioned, become difficult areas to cross upwards or downwards. By using this information, traders can identify very s
This indicator is the same as the popular Heiken Ashi Smoothed. The Heikin Ashi indicator for MetaTrader 5 already exists, but it has two disadvantages: It paints the candles not accurate. It's not possible to change the candle width. See also Heikin Ashi in MQL5 Code Base . In this version there are no such disadvantages.
Hello My Dear Friend, im introduce about Binary Option Premium V8 it work, all currency pair 1 minute time frame, 1-5 minute expire 100% non repaint, no delay signal Alright. This indicator works on MT5 and is very easy to use. When you receive a signal from it, you wait for that candle with the signal to close and you enter your trade at the beginning of the next new candle. A red arrow means sell and a green arrow means buy. for easy identification of trade signal. Are you okay with tha
Mini Chart Indicators
Flavio Javier Jarabeck
The Metatrader 5 has a hidden jewel called Chart Object, mostly unknown to the common users and hidden in a sub-menu within the platform. Called Mini Chart, this object is a miniature instance of a big/normal chart that could be added/attached to any normal chart, this way the Mini Chart will be bound to the main Chart in a very minimalist way saving a precious amount of real state on your screen. If you don't know the Mini Chart, give it a try - see the video and screenshots below. This is a gr
Você utiliza o volume na sua leitura do mercado? Certamente muitos traders usam, e não se imaginam operando sem ele. O indicador Color Histogram Volume Set permite que o usuário escolha o valor que ele considera interessante para monitorar. Ao ultrapassar este você terá a confirmação visual e se quiser terá também o alerta sonoro que é dado pelo indicador. Claro que existem outras maneiras de tentar encontrar um volume elevado, como avaliar se o v olume está acima da média, se é o maior vo
Weis Wave Result MT5
Sant Clear Ali Costa
Características 3 tipos de torres: altista, baixista e desconhecida. A torre desconhecida surge quando os preços se movem no sentido oposto a torre atual. Texto que mostra a porcentagem restante para a mudança de torre. Permite definir a pontuação necessária para a troca de torre. Permite definir o tamanho da fonte dos textos de porcentagem. Permite definir tanto as cores das torres quanto as cores dos textos de porcentagem. Aba Parâmetros de Entrada Reversal Points - Pontos de reversão. Limit
The Accumulation / Distribution is an indicator which was essentially designed to measure underlying supply and demand. It accomplishes this by trying to determine whether traders are actually accumulating (buying) or distributing (selling). This indicator should be more accurate than other default MT5 AD indicator for measuring buy/sell pressure by volume, identifying trend change through divergence and calculating Accumulation/Distribution (A/D) level. Application: - Buy/sell pressure: above
Master OBV
Thalles Nascimento De Carvalho
O indicador MasterOBV é uma poderosa ferramenta de análise técnica que utiliza o volume, correlação positiva e uma Média Móvel (MA) para aprimorar a identificação de tendências nos mercados financeiros. Incorporando ativos com correlação positiva por meio do menu do indicador, o MasterOBV oferece uma abordagem refinada para avaliar a força e direção das tendências. A inclusão da Média Móvel proporciona uma suavização adicional aos movimentos de preços, auxiliando no rastreamento mais preciso da
Mean Reversion Supply Demand Indicator Mean Reversion Supply Demand is the indicator to detect the important supply demand zone in your chart. The concept of supply demand trading relies on the quantity mismatching between buying and selling volumes in the financial market. Typically, supply demand zone serves to predict the turning point. The wave pattern, for any supply demand zone to work as an successful trade, looks like the price must touch the base zone, move away and then return to zone
WAPV adh Supply and Demand Forex
Eduardo Da Costa Custodio Santos
O Indicador WAPV ADH Supply and Demand Forex faz parte de um conjunto de Indicadores denominado (Wyckoff Academy Wave Market) O indicador WAPV ADH Forex Supply and Demand para MT5 destina-se a identificar o lado vencedor entre compradores e vendedores. Sua leitura é muito simples, quando a linha verde está acima da linha vermelha a demanda está no comando, quando a linha vermelha está acima da linha verde a oferta está no comando. Quanto mais positivas as linhas verde e vermelha, maior a
Balance Aggression
Edson Cavalca Junior
O indicador mede o saldo de agressão para cada Candle. A fórmula é a seguinte: Agressão = Volume de Compra - Volume de Venda. Nota:  Recomenda-se utilizar os valores padrões de configuração e VPS. Não funciona em Forex. Conheça Nossos Produtos   Parâmetros : Números de dias anteriores ao atual para cálculo; Divisor do Volume e; Habilita cálculo do candle atual; Histograma Estilo da linha  e; Tamanho; Linha Estilo da linha e; Tamanho; Acompanhe-nos no nosso sites e envie sua dúvida n
Trigger Cash
Felipe Correa Carneiro
Gatilhos   são regras de negócios que você define para execução imediata após a criação ou atualização dos tickets.  Este programa indica ao usuário quando um gatilho de reversão de tendência é acionado.  Este programa me gerou bastante conforto em meus trades no mini índice.  Faça o back-teste gratuito!! Desde já muito obrigado pela sua atenção! TIP: And try together RSI (13)(9) !!! ;)
SMT (Smart Money Technique) Divergence refers to the price divergence between correlated assets or their relationship to inversely correlated assets.  By analyzing SMT Divergence, traders can gain insights into the market's institutional structure and identify whether smart money is accumulating or distributing assets.  Every price fluctuation should be confirmed by market symmetry, and any price asymmetry indicates an SMT Divergence, suggesting a potential trend reversal. MT4 Version -  https:/
Segmented Volume MT5
Eduardo Da Costa Custodio Santos
O indicador Volume Segmentado MT5 foi criado para facilitar quem opera utilizando  análise preço e volume, VSA, VPA, Método Wyckoff e Smart Money System . O Segmented volume funciona em qualquer Mercado ( Cripto, CFD, Forex, Futuros, ações ...) e funciona em qualquer tempo Gráfico. Veja como é fácil sua interpretação: #Verde: Volume muito maior que a média do mercado #Rosa escuro: Volume Maior que a média #Azul: Volume normal positivo #Vermelho: volume normal Negativo #Rosa: Baixo
This indicator has been developed to identify and display these trends quickly and easily, allowing you to see instantly, those currency pairs which are trending, and those which are not – and in all timeframes, with just one click. The 28 currency pairs are displayed as a fan as they sweep from strong to weak and back again, and this is why we call it the ‘currency array’. All 28 pairs are arrayed before you, giving an instant visual description of those pairs that are trending strongly, those
Golden Limit
Renato Fridschtein
Não há limites! O indicador Golden Limit é a ferramenta definitiva para ter uma leitura clara e fácil dos movimentos do preço no gráfico. Ele projeta faixas de suporte e resistência, calculadas por modelos estatísticos envolvendo Price Action e a sequência de Fibonacci, revelando de antemão o comportamento dos preços e os melhores locais para operar (e para não operar). Ainda conta com duas médias móveis para auxiliar na escolha das melhores entradas. O Método Golden Limit foi criado a p
Z Score Plus MT5
Eduardo Da Costa Custodio Santos
Em finanças, o Z Score são medidas da variabilidade de uma observação e podem ser usados ​​pelos traders para ajudar a determinar a volatilidade do mercado. As pontuações Z revelam aos Traders se uma pontuação é típica para um conjunto de dados especificado ou se é atípica. As pontuações Z também possibilitam que os analistas adaptem as pontuações de vários conjuntos de dados para fazer pontuações que possam ser comparadas entre si com mais precisão. # Na Prática, temos o ZScore com o ponto zero
Your Trend Friend
Luigi Nunes Labigalini
5 (1)
A tendência é sua amiga! Veja a cor do indicador e faça suas operações nessa direção. Ele não repinta. Ou seja, depois que cada candle se fecha, a cor dele é definitiva e não irá se alterar. Você pode focar em movimentos mais curtos e rápidos ou tendências mais longas, basta testar o que melhor se encaixa no seu operacional de acordo com o ativo e tempo gráfico usado. Altere o parâmetro de entrada "Length" e o indicador irá se adaptar automaticamente (quanto maior ele for, maior a tendência a
Market Profile Heat indicator  — is a classic Market Profile implementation that can show the price density over time, outlining the most important price levels, value area, and control value of a given trading session. This indicator can be attached to timeframes between M1 and D1 and will show the Market Profile for daily, weekly, monthly, or even intraday sessions. Lower timeframes offer higher precision. Higher timeframes are recommended for better visibility. It is also possible to use a f
O SafeProfit Market Profile é o indicador de rastreamento mais avançado do Mercado de Forex. Ele foi desenvolvido para rastrear o perfil de mercado de cada sessão do dia: Asiática, Européia e Americana. Com este indicador você irá operar o Intraday sorrindo... sabendo exatamente para onde os Big Players estão posicionados e o momento exato para onde eles estão indo. O indicador é simples, rápido e objetivo rastreando no preço cada movimento dos Big Players. Saia da estatística dos 95% que só per
Este indicador mostrará os valores de TP e SL (naquela moeda) que você já definiu para todos os pedidos nos gráficos (fechados na linha de transação/pedido) que o ajudarão muito a estimar seus lucros e perdas para cada pedido. E também mostra os valores de PIPs. o formato mostrado é "Valores de moeda de nossos valores de Lucro ou Perda / PIPs". O valor TP será mostrado na cor verde e o valor SL será mostrado na cor vermelha. Para qualquer dúvida ou mais informações, sinta-se à vontade para en
X Tick Chart
Artur Zas
4.75 (8)
The indicator combines the features of both the Tick charts and Volume Bar charts. The mode can be selected in the indicator's settings. Tick charts measure the number of transactions per bar. To give you an example if you have a 233 tick chart, each bar measures 233 transactions per bar and a new bar is plotted after 233 transactions. You can choose any number of ticks per bar but most traders choose Fibonacci numbers (1, 2, 3, 5, 8, 13, 21, 34, 55, 89, 144, 233...). Volume bar charts are desi
Os compradores deste produto também adquirem
Atomic Analyst MT5
Issam Kassas
4.79 (19)
Primeiramente, vale ressaltar que este Indicador de Negociação não repinta, não redesenha e não apresenta atrasos, tornando-o ideal tanto para negociação manual quanto automatizada. Manual do utilizador: configurações, entradas e estratégia. O Analista Atômico é um Indicador de Ação de Preço PA que utiliza a força e o momentum do preço para encontrar uma vantagem melhor no mercado. Equipado com filtros avançados que ajudam a remover ruídos e sinais falsos, e aumentam o potencial de negociação.
Primeiramente, vale ressaltar que este Sistema de Trading é um Indicador Não Repintado, Não Redesenho e Não Atrasado, o que o torna ideal tanto para o trading manual quanto para o automatizado. Curso online, manual e download de predefinições. O "Sistema de Trading Inteligente MT5" é uma solução completa de trading projetada para traders novos e experientes. Ele combina mais de 10 indicadores premium e apresenta mais de 7 estratégias de trading robustas, tornando-o uma escolha versátil para dive
TPSproTREND PrO MT5
Roman Podpora
4.89 (9)
TPSpro TREND PRO  - is a trend indicator that automatically analyzes the market and provides information about the trend and each of its changes, as well as giving signals for entering trades without redrawing! The indicator uses each candle, analyzing them separately. referring to different impulses - up or down impulse. Exact entry points into transactions for currencies, crypto, metals, stocks, indices!  Version MT4               DETAILED DESCRIPTION               R ecommended to use with an
TPSpro RFI Levels MT5
Roman Podpora
4.67 (9)
Reversal First Impulse levels (RFI)      INSTRUCTIONS        RUS       -       ENG              R ecommended to use with an indicator   -   TPSpro  TREND PRO -  Version MT4                 A key element in trading is zones or levels from which decisions to buy or sell a trading instrument are made. Despite attempts by major players to conceal their presence in the market, they inevitably leave traces. Our task was to learn how to identify these traces and interpret them correctly. Main functi
XQ Indicator MetaTrader 5
Marzena Maria Szmit
5 (1)
Step into the realm of Forex trading with confidence and precision using XQ, a cutting-edge Forex indicator designed to elevate your trading game to unprecedented heights. Whether you're a seasoned trader or just stepping into the world of currency exchange, XQ Forex Indicator empowers you with the insights and signals needed to make informed trading decisions. The signal conditions are a combination of three indicators, and XQ Forex Indicator only display  medium and long-term trends . The ind
Introduction to X3 Chart Pattern Scanner X3 Cherart Pattern Scanner is the non-repainting and non-lagging indicator detecting X3 chart patterns including Harmonic pattern, Elliott Wave pattern, X3 patterns, and Japanese Candlestick patterns. Historical patterns match with signal patterns. Hence, you can readily develop the solid trading strategy in your chart. More importantly, this superb pattern scanner can detect the optimal pattern of its kind. In addition, you can switch on and off individu
AT Forex Indicator MT5
Marzena Maria Szmit
5 (4)
The AT Forex Indicator MT5 is a sophisticated trading tool designed to provide traders with a comprehensive analysis of multiple currency pairs. This powerful indicator simplifies the complex nature of the forex market, making it accessible for both novice and experienced traders. AT Forex Indicator uses advanced algorithms to detect trends, patterns and is an essential tool for traders aiming to enhance their forex trading performance. With its robust features, ease of use, and reliable signal
Elliott Wave Trend was designed for the scientific wave counting. This tool focuses to get rid of the vagueness of the classic Elliott Wave Counting using the guideline from the template and pattern approach. In doing so, firstly Elliott Wave Trend offers the template for your wave counting. Secondly, it offers Wave Structural Score to assist to identify accurate wave formation. It offers both impulse wave Structural Score and corrective wave Structure Score. Structural Score is the rating to sh
IVISTscalp5
Vadym Zhukovskyi
5 (5)
Apresentamos a você o indicador iVISTscalp5, que não é apenas único, mas também eficaz em operações de negociação. Este indicador é baseado em dados de tempo e é o resultado de muitos anos de experiência e análise aprofundada dos mercados financeiros. O indicador iVISTscalp5 é uma excelente ferramenta para negociação manual. Conveniência, simplicidade e visualização - toda a complexidade está escondida dentro dele. Simplificamos as configurações e o uso do indicador iVISTscalp5 ao máximo. O indi
Este é sem dúvida o indicador de reconhecimento automático de formação de preço harmônico mais completo que você pode encontrar para a MetaTrader Platform. Ele detecta 19 padrões diferentes, leva as projeções de Fibonacci tão a sério quanto você, exibe a Zona de Reversão Potencial (PRZ) e encontra níveis adequados de stop loss e take-profit. [ Guia de instalação | Guia de atualização | Solução de problemas | FAQ | Todos os produtos ] Detecta 19 formações harmônicas de preços diferentes Tr
Introduction to Fractal Pattern Scanner Fractal Indicator refers to the technical indicator that makes use of the fractal geometry found in the financial market. Fractal Pattern Scanner is the advanced Fractal Indicator that brings the latest trading technology after the extensive research and development work in the fractal geometry in the financial market. The most important feature in Fractal Pattern Scanner is the ability to measure the turning point probability as well as the trend probabil
PZ Trend Trading MT5
PZ TRADING SLU
3.67 (3)
O Trend Trading é um indicador projetado para lucrar o máximo possível com as tendências que ocorrem no mercado, cronometrando retrocessos e rupturas. Ele encontra oportunidades de negociação analisando o que o preço está fazendo durante as tendências estabelecidas. [ Guia de instalação | Guia de atualização | Solução de problemas | FAQ | Todos os produtos ] Negocie mercados financeiros com confiança e eficiência Lucre com as tendências estabelecidas sem ser chicoteado Reconhecer retrocesso
FxaccurateLS
Shiv Raj Kumawat
WHY IS OUR FXACCCURATE LS MT5 THE PROFITABLE ? PROTECT YOUR CAPITAL WITH RISK MANAGEMENT Gives entry, stop and target levels from time to time. It finds Trading opportunities by analyzing what the price is doing during established trends. POWERFUL INDICATOR FOR A RELIABLE STRATEGIES We have made these indicators with a lot of years of hard work. It is made at a very advanced level. Established trends provide dozens of trading opportunities, but most trend indicators completely ignore them!
PZ Swing Trading MT5
PZ TRADING SLU
5 (4)
Swing Trading é o primeiro indicador projetado para detectar oscilações na direção da tendência e possíveis oscilações de reversão. Ele usa a abordagem de negociação de linha de base, amplamente descrita na literatura de negociação. O indicador estuda vários vetores de preço e tempo para rastrear a direção da tendência agregada e detecta situações nas quais o mercado está sobrevendido ou sobrecomprado em excesso e pronto para corrigir. [ Guia de instalação | Guia de atualização | Solução de prob
PZ Day Trading MT5
PZ TRADING SLU
2.83 (6)
Este indicador detecta reversões de preços em zigue-zague, usando apenas análise de ação de preços e um canal donchiano. Ele foi projetado especificamente para negociações de curto prazo, sem repintar ou retroceder. É uma ferramenta fantástica para traders astutos, com o objetivo de aumentar o tempo de suas operações. [ Guia de instalação | Guia de atualização | Solução de problemas | FAQ | Todos os produtos ] Surpreendentemente fácil de negociar Fornece valor em cada período de tempo Imple
The iChannels
BeeXXI Corporation
5 (1)
Ultra-fast recognition of parabolic channels (as well as linear, horizontal and wavy channels) throughout the depth of history, creating a hierarchy of channels. Required setting: Max bars in chart: Unlimited This indicator is designed primarily for algorithmic trading, but can also be used for manual trading.  This indicator will have a very active evolution in the near future and detailed descriptions on how to apply to create robots
Dragon Multi Indicator MT5
Mansour Babasafary
5 (5)
3 Indicators in 1 indicator Strategy based on price action Made specifically for the best forex currency pairs Can be used in the best time frame of the market at a very reasonable price This indicator is basically 3 different indicatos . But we have combined these 3 indicators in 1 indicator so that you can use 3 indicators at the lowest price. All three strategies are based on price action. But based on different trends. Long term, medium term and short term Attributes : No repaintin
TPA True Price Action indicator reveals the true price action of the market makers through 100% non-repainting signals strictly at the close of a candle! TPA shows entries and re-entries, every time the bulls are definitely stronger than the bears and vice versa. Not to confuse with red/green candles. The shift of power gets confirmed at the earliest stage and is ONE exit strategy of several. There are available now two free parts of the TPA User Guide for our customers. The first "The Basics"
Matreshka
Dimitr Trifonov
5 (1)
Matreshka self-testing and self-optimizing indicator: 1. Is an interpretation of the Elliott Wave Analysis Theory. 2. Based on the principle of the indicator type ZigZag, and the waves are based on the principle of interpretation of the theory of DeMark. 3. Filters waves in length and height. 4. Draws up to six levels of ZigZag at the same time, tracking waves of different orders. 5. Marks Pulsed and Recoil Waves. 6. Draws arrows to open positions 7. Draws three channels. 8. Notes support and re
Volatility Trend System - é um sistema de negociação que fornece sinais para entradas. O sistema de volatilidade fornece sinais lineares e pontuais na direção da tendência, bem como sinais para sair dela, sem redesenhar ou atrasos. O indicador de tendência monitora a direção da tendência de médio prazo, mostra a direção e sua mudança. O indicador de sinal é baseado em mudanças na volatilidade e mostra as entradas no mercado. O indicador está equipado com diversos tipos de alertas. Pode se
[ MT4 Version ] Only the next 10 units at current price! Final price: $299 Are you tired of spending months on demo or live accounts to test your trading strategies? The Backtesting Simulator is the ultimate tool designed to elevate your backtesting experience to new heights. Utilizing Metatrader historical symbol information, it offers an unparalleled simulation of real market conditions. Take control of your testing speed, test ideas quickly or at a slower pace, and witness remarkable improve
How to use Pair Trading Station Pair Trading Station is recommended for H1 time frame and you can use it for any currency pairs. To generate buy and sell signal, follow few steps below to apply Pair Trading Station to your MetaTrader terminal. When you load Pair Trading Station on your chart, Pair Trading station will assess available historical data in your MetaTrader platforms for each currency pair. On your chart, the amount of historical data available will be displayed for each currency pai
Piranha version 2
Maria Strudov
5 (1)
"Piranha" - an autonomous trading system that determines overbought and oversold levels on the chart. Red and blue zones represent overbought and oversold levels respectively. Entry points are marked with arrows: a downward arrow in the red zone for "sell" and an upward arrow in the blue zone for "buy". The Take profit level is indicated by the green moving average. Key features: Adjusting the Take profit level as the green moving average changes position. Averaging ability when a new market e
Introducing the South African Sniper indicator created by a small group of traders with a few years trading trading the financial market profitably . This is a plug and play indicator that provides you with  BUY and SELL (SNIPER ENTRY) signals with TARGET and trail stops. The indicator Works with all MT5 trading instruments. The indicator uses previous  chart data as receipt to speculate on future market moves.  "The South African Sniper indicator community are very happy with the indicator an
Difícil de encontrar e com pouca frequência, as divergências são um dos cenários de negociação mais confiáveis. Este indicador localiza e verifica automaticamente divergências ocultas e regulares usando seu oscilador favorito. [ Guia de instalação | Guia de atualização | Solução de problemas | FAQ | Todos os produtos ] Fácil de trocar Encontra divergências regulares e ocultas Suporta muitos osciladores conhecidos Implementa sinais de negociação baseados em fugas Exibe níveis adequados de
Limited Offer:    Take advantage of our limited-time offer on the FxBears Powers Indicator! When you purchase this powerful tool, you'll also receive the renowned FxBears EA, an expert advisor that automatically executes the indicator's signals. Don't miss out on this unbeatable combination to enhance your trading strategy! No more losses with this indicator, test it for years ago and see if there is losses in one day results. but before testing it please see the explaining video down here. 
Contact us to receive a comprehensive user guide after purchasing. William Delbert Gann, commonly known as W.D. Gann, was an exceptional market analyst renowned for his unique trading style in the early 20th century.  His trading techniques were based on a blend of mathematics, geometry, astrology, and ancient mathematics. Gann believed that stock market movements followed specific patterns and cycles, rather than being random. His methodologies, celebrated for their accuracy and relevance, con
MetaForecast M5
Vahidreza Heidar Gholami
5 (2)
MetaForecast prevê e visualiza o futuro de qualquer mercado com base nas harmonias nos dados de preços. Embora o mercado nem sempre seja previsível, se houver um padrão nos preços, o MetaForecast pode prever o futuro com a maior precisão possível. Em comparação com outros produtos similares, o MetaForecast pode gerar resultados mais precisos ao analisar as tendências do mercado. Parâmetros de entrada Past size (Tamanho do passado) Especifica o número de barras que o MetaForecast usa para criar
The indicator is designed to close positions on the market in time. For example: to take profits ahead of schedule if the price has not reached TakeProfit, and the market is turning around. The indicator analyzes the momentum, not the trend. He does not give any information about the trend. The indicator is well suited for finding divergence. The Ershov 38 Parrots indicator dynamically adjusts to the market and detects price movement impulses of medium and high amplitude. It almost does not rea
Mega Spikes Max
Niccyril Chirindo
Boom and Crash Indicator - MT5 Spike Detector with Trade Alerts "Unlock the secrets of trading Boom and Crash spikes with our powerful MT5 indicator! This spike detection tool provides accurate buy and sell signals, trade alerts, and profit maximization. Perfect for scalping, day trading, and swing trading. Get the best Boom and Crash strategy with our Deriv Boom and Crash spike indicator. Key Features & Benefits: Accurate Boom and Crash spike detection Reliable buy and sell signals with no
Filtro:
Sem comentários
Responder ao comentário
Versão 1.6 2024.08.13
Corrigido a troca de cores do histograma