Azurean Expert
- Experts
- Ruengrit Loondecha
- Versão: 24.806
- Ativações: 10
---------------------------------------------------------
---------------------------------------------------------
Azurean Expert MT5
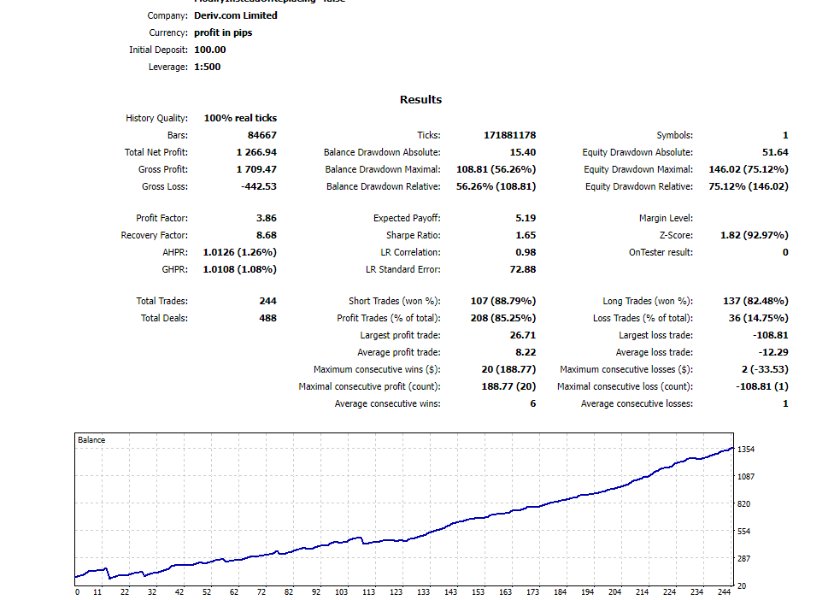
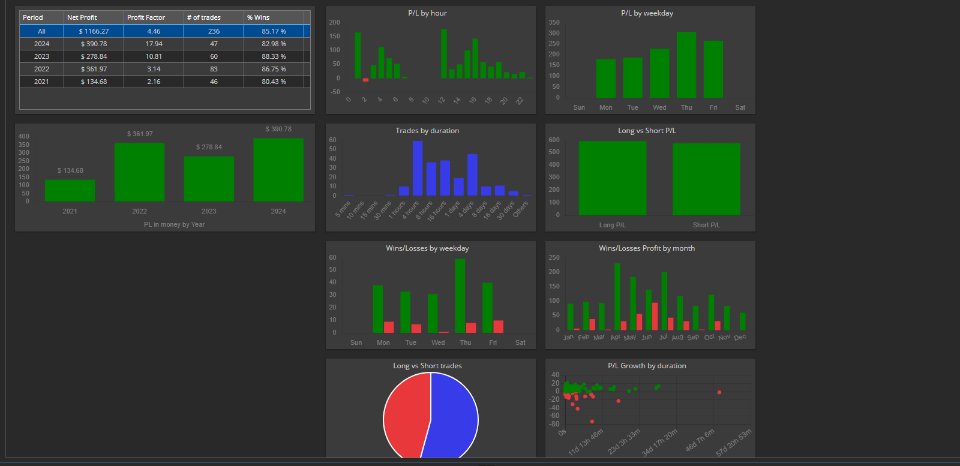
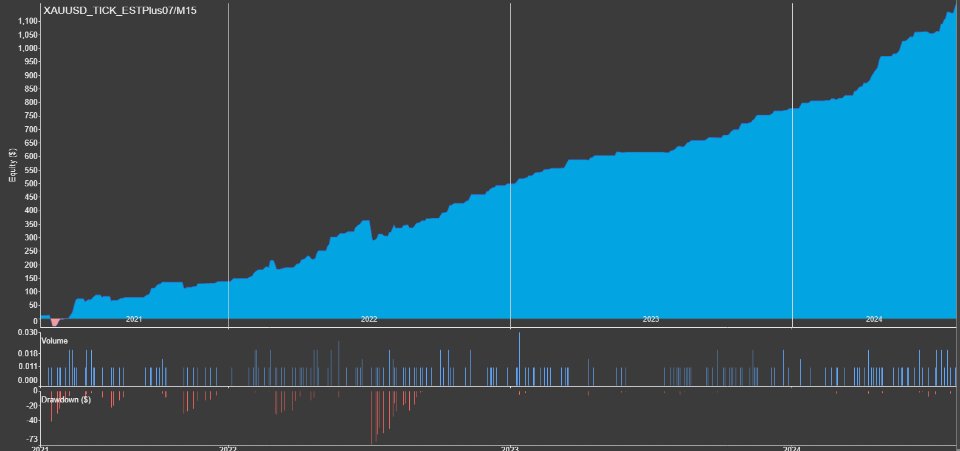
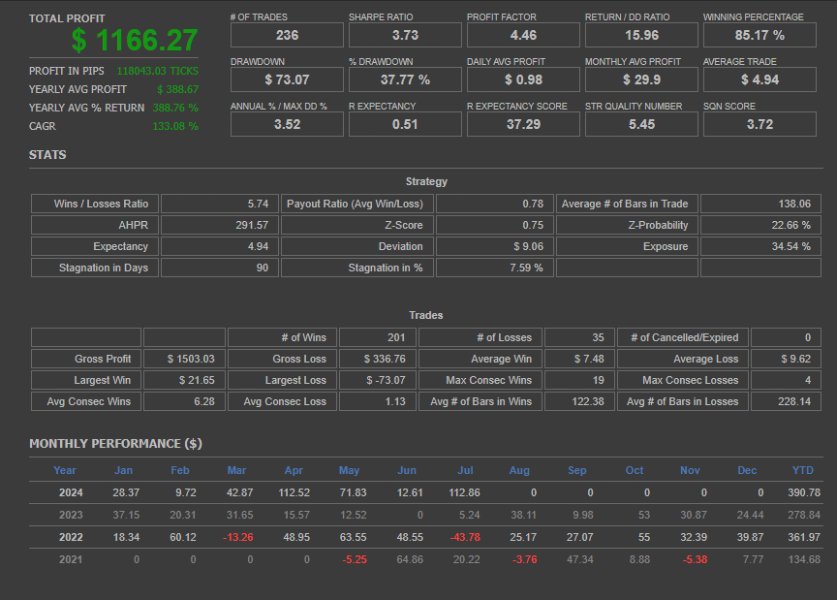
- Optimal Performance: Designed to work best with GOLD on the M15 timeframe.
- Capital Requirements: Minimum starting capital of $200-$500 for a 0.01 lot size (AutoLot feature included).
- Continuous Optimization: Monthly updates to enhance performance and adapt to market conditions.
- Stay Informed: Updates and performance reports in the comments section.
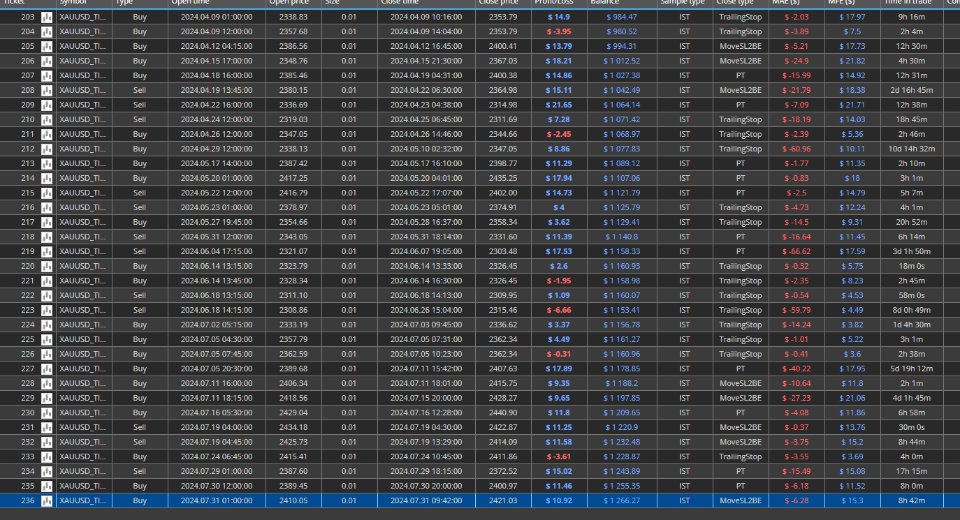
- Live Trading: Follow our live trades at https://t.me/lullfrx
---------------------------------------------------------
Indicators and Concepts
-
Average Volume (AvgVolume):
- The Average Volume indicator calculates the average trading volume over a specified period. It helps identify the strength of price movements, as high volume often indicates strong market interest and potential trend continuation, while low volume may suggest weaker trends or consolidation.
-
Ichimoku Kinko Hyo:
- The Ichimoku indicator provides a comprehensive view of market conditions, including trend direction, support and resistance levels, and momentum. It consists of five lines: Tenkan-sen (Conversion Line), Kijun-sen (Base Line), Senkou Span A (Leading Span A), Senkou Span B (Leading Span B), and Chikou Span (Lagging Span). The Ichimoku cloud (Kumo) helps visualize the overall trend and potential reversal points.
-
Quantitative Qualitative Estimation (QQE):
- QQE is an enhanced version of the RSI that incorporates smoothing and volatility filters. It helps identify trend strength and potential reversals with reduced noise, providing clearer signals for market entries and exits.
-
Average Directional Index (ADX):
- ADX measures the strength of a trend, regardless of its direction. It is often used in conjunction with the +DI and -DI lines to determine whether a market is trending and the strength of that trend. ADX values above 25 typically indicate a strong trend, while values below 20 suggest a weak or non-trending market.
-
Moving Average Convergence Divergence (MACD):
- MACD is a momentum indicator that shows the relationship between two moving averages of a security's price. It includes the MACD line, the signal line, and the histogram. MACD helps identify trend changes, buy and sell signals, and the strength of momentum.
Trade Style
-
Entry Orders:
- Entry orders are placed based on signals generated by the combination of the indicators. For example, a buy order may be triggered when the Ichimoku cloud indicates an uptrend, MACD signals a bullish crossover, and ADX confirms a strong trend.
-
Stop Loss (SL) by Percentage:
- The stop-loss level is set as a fixed percentage away from the entry price. This approach establishes a predefined risk level for each trade, ensuring consistent risk management.
-
Take Profit (TP) by ATR Coefficient:
- The take-profit level is determined using a multiple of the Average True Range (ATR). This method adjusts the TP target based on market volatility, allowing for flexible and adaptive profit-taking strategies.
-
Break Even (BE) with Add Pips * ATR:
- The stop-loss is moved to the break-even point (entry price) once the trade moves favorably. In addition to moving to BE, a number of pips determined by multiplying the ATR by a specified factor is added to the break-even level. This approach helps lock in some profit while minimizing risk.
-
Trailing Stop by HighDaily:
- The trailing stop is set based on the highest price of the day (HighDaily). This approach helps lock in profits by following the market's daily high, adjusting the stop-loss as the price reaches new highs. It allows the trade to capture more profits while protecting against potential reversals.

