ATS Swing Four Hour Timeframe
- Indicadores
- Andy Ismail
- Versão: 208.19
- Atualizado: 26 agosto 2019
- Ativações: 5
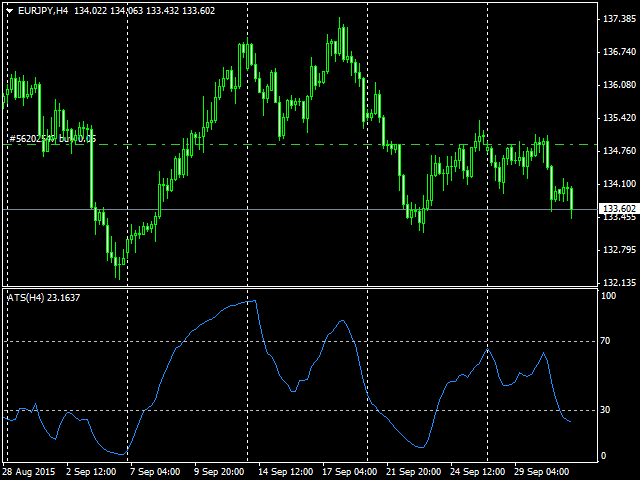
This indicator based on Alpha Trend Spotter, Moving Average, and RSI Indicators. Its Customized for H4 (Four Hour) Timeframe where the price do real swing.
This indicator doesn't have setting value, just plug and play in H4 Timeframe. Best performance with pairs:
- EURUSD
- GBPUSD
- EURJPY
- GBPJPY
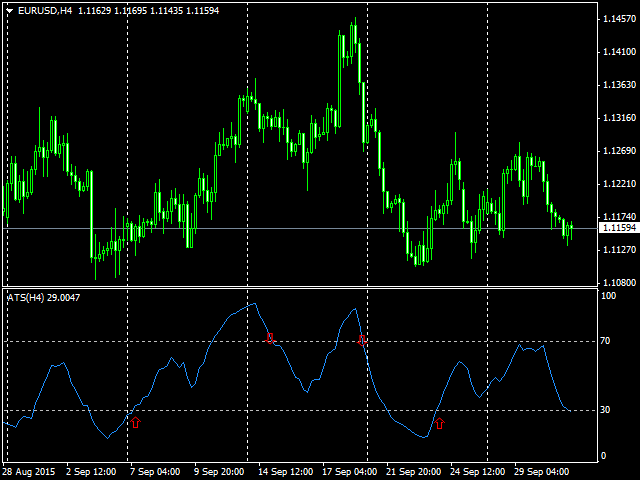
Entry conditions:
- LINE CROSS ATS < 30, HOLD and then line TOUCHING BACK TO 30 = LONG ENTRY
- LINE CROSS ATS > 70, HOLD and then line TOUCHING BACK TO 70 = SHORT ENTRY
Exit conditions:
- LONG CLOSE IF CROSS ATS > 70, or exit when price CROSSED ATS > 70 wait until moving back to 70 and then exit
- SHORT CLOSE IF CROSS ATS < 30 or exit when price CROSSED ATS < 30 wait until moving back to 30 and then exit