• Visão global
  • Comentários
  • Discussão

Indicator Combiner Into One Indicator

Optimize your trading strategy of your custom indicators with the "Indicator Combiner Into One Indicator". This advanced tool combines multiple indicators, including your custom indicators, into a single, user-friendly interface. It generates an arrow signal based on your  custom indicators, simplifying your decision-making process. Ideal for traders of all levels, this indicator offers:

  •     Arrow Signals: Get a clear, single arrow signal that combines insights from your custom indicators, making it easier to interpret market trends.
  •     Custom Indicator Integration: Seamlessly incorporate your own custom indicators to tailor the signal to your unique trading strategy.
  •     Real-Time Alerts: Receive timely alerts during candle formation to capitalize on market movements as they happen.
  •     Enhanced Signal Accuracy: Benefit from a filtered signal that enhances the relevance and precision of your trading decisions.
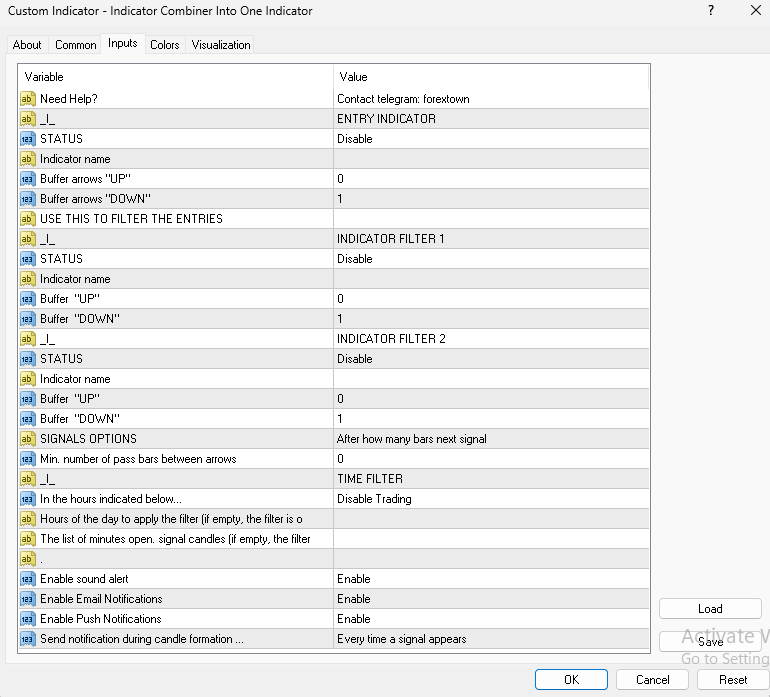

        // ENTRY INDICATOR 
 STATUS=Disable/Enable
Indicator name = " Insert indicator name here ";
 Buffer arrows "UP" = 0;
 Buffer arrows "DOWN" = 1;
        //USE THIS TO FILTER THE ENTRIES
"INDICATOR FILTER 1"    
 STATUS=Disable/Enable
Indicator name = " Insert indicator name here ";
 Buffer arrows "UP" = 0;
 Buffer arrows "DOWN" = 1;

"INDICATOR FILTER 2"    
 STATUS=Disable/Enable
Indicator name = " Insert indicator name here ";
 Buffer arrows "UP" = 0;
 Buffer arrows "DOWN" = 1;

        //AFTER HOW MANY BARS NEXT SIGNAL 
Min. number of pass bars between arrows = " 0 "; 0 - means disabled

        //TIMEFILTER  
 STATUS=Enable Trading / Disable Trading
Hours = " 01 ";
Minutes= " 60 ";

        //ALERTS
 
Enable sound alert=Enable / Disable
Enable Push Notifications=Enable / Disable
Enable Email Notifications=Enable / Disable


Upgrade your trading trategy  experience with the "Indicator Combiner Into One Indicator" and achieve greater trading efficiency and clarity. Use it now to transform your trading approach!
Mais do autor
Supply Demand Zone Pro Indicator works with all products and timeframes. It is using a new calculation method, and now you can select the desired zone on any timeframe! Strongest Zones are already enabled by default This is a great advantage in trading.This indicator has a built in backtester enabled by default, just move the chart. Supply and Demand ? Supply is a price zone where sellers outnumbered buyers and drove the price lower. Demand is a price zone where buyers outnumbers sellers and
This EA is to be based on buying /selling via buffers. NEW UPDATE COMING SOON! ADDED: MARTINGALE, FILTERING CUSTOM INDICATOR, READ SIGNALS FROM OBJECT, and many more.    This is based on the calling of a custom signal indicator.    Here are the INPUTS below and I will give a description of how each INPUT works. Please see below.        EA INPUTS        Variable                Value        TP Mode                 Basket/Individual    Lot Size                0.01    TP (IN $)         
FREE
Price action is among the most popular trading concepts. A trader who knows how to use price action the right way can often improve his performance and his way of looking at charts significantly. However, there are still a lot of misunderstandings and half-truths circulating that confuse traders and set them up for failure. Using PA Trend Reversal will be possible to identify high probability exhaustion moves of a trend. ️ AVOID NEWS AND SPEECHES - most of the bad signals are during the news/sp
Nygma Binary Options is a momentum indicator that measures the magnitude of recent price changes to evaluate overbought or oversold conditions in the price of a stock or other asset with few major tweaks. This is NOT RSI. Features V3: Added Supply/Demand Filter: You must add your own S/R indicator .  You get alerts when prices is entering on a specific supply/demand zone. How to use the S/R Filter? Load the Nygma_Mod.ex4 into the chart, after that load your S/R indicator on the chart. In orde
Mr Pip Scalping Indicator is a momentum indicator that measures the magnitude of recent price changes to evaluate overbought or oversold conditions in the price of a stock or other asset with few major tweaks. This is NOT RSI. Features V2: Added Supply/Demand Filter You can select which zone to see on the chart ( Important Resistance/Support; Verified Resistance/Support; etc ).  You get alerts when prices is entering on a specific supply/demand zone. How to use? When the signal comes, you wi
Mr Pip Trend indicator combines powerful price action analysis and sophisticated algorithmic data analysis to provide traders with high-accuracy chart analysis and support the decision-making process. You can use Mr Pip Trend Indicator to trade all the markets (all Forex pairs, all CFDs and Cryptocurrencies) on all timeframes!   Mr Pip Trend Indicator provides chart analysis that is effective at detecting new trends but finds the exact sweet-spot between early and late entries. What is different
Reversals typically refer to large price changes, where the trend changes direction. Small counter-moves against the trend are called pullbacks or consolidations.When it starts to occur, a reversal isn't distinguishable from a pullback. A reversal keeps going and forms a new trend, while a pullback ends and then the price starts moving back in the trending direction. Difference Between a Reversal and a Pullback A reversal is a trend change in the price of an asset. A pullback is a counter-move w
Price action is among the most popular trading concepts. A trader who knows how to use price action the right way can often improve his performance and his way of looking at charts significantly. However, there are still a lot of misunderstandings and half-truths circulating that confuse traders and set them up for failure. Using PA Trend Reversal will be possible to identify high probability exhaustion moves of a trend. Features The indicator gives alerts in real-time when the conditions are me
Filtro:
Sem comentários
Responder ao comentário