FVG Fair Value Gap MT4
- Indicadores
- Lee Guan Chuan
- Versão: 1.20
- Atualizado: 31 julho 2024
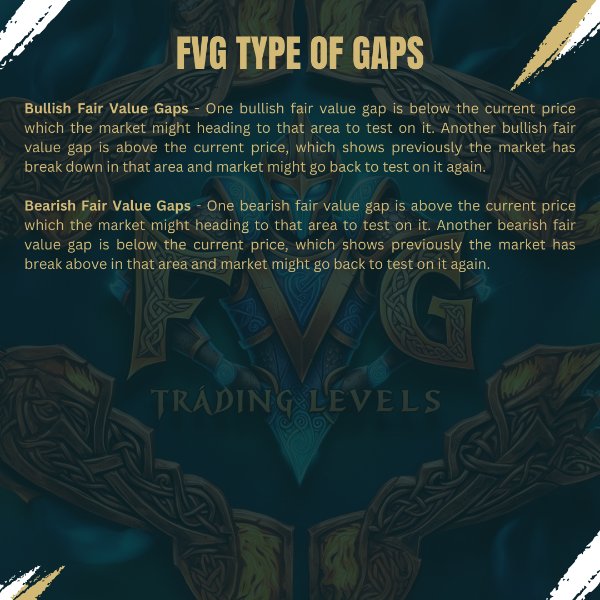
FVG Fair Value Gap is an indicator that plot rectangle for last found fair value gap. There will be a total of eight fair value gaps. Four is bullish fair value gaps and another four is bearish fair value gaps.
Bullish Fair Value Gaps
Top Bullish/Bearish Fair Value Gap is the gap that will obey the "Recent candles" and "Nearby Size In Pips" parameters. This fair value gap will be above current price. Bottom Bullish/Bearish Fair Value Gap is the gap that will obey the "Recent candles" and "Nearby Size In Pips" parameters. This fair value gap will be below current price. Recent Top Bullish/Bearish Fair Value Gap is the highest possible gap which above current price but below "Top Bullish/Bearish Fair Value Gap". Recent Bottom Bullish/Bearish Fair Value Gap is the lowest possible bullish/bearish fair value gap which below current price but above “Bottom Bullish/Bearish Fair Value Gap”.
Parameters
These are the parameters of the EA.
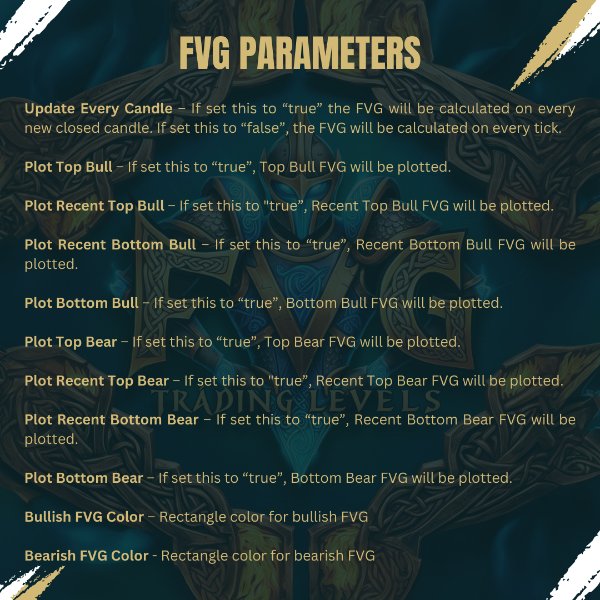
1) Update Every Candle – If set this to “true” the FVG will be calculated on every new closed candle. If set this to “false”, the FVG will be calculated on every tick.
2) Plot Top Bull – If set this to “true”, Top Bull FVG will be plotted.
3) Plot Recent Top Bull – If set this to "true”, Recent Top Bull FVG will be plotted.
4) Plot Recent Bottom Bull – If set this to “true”, Recent Bottom Bull FVG will be plotted.
5) Plot Bottom Bull – If set this to “true”, Bottom Bull FVG will be plotted.
6) Plot Top Bear – If set this to “true”, Top Bear FVG will be plotted.
7) Plot Recent Top Bear – If set this to "true”, Recent Top Bear FVG will be plotted.
8) Plot Recent Bottom Bear – If set this to “true”, Recent Bottom Bear FVG will be plotted.
9) Plot Bottom Bear – If set this to “true”, Bottom Bear FVG will be plotted.
10) Bullish FVG Color – Rectangle color for bullish FVG
11) Bearish FVG Color - Rectangle color for bearish FVG
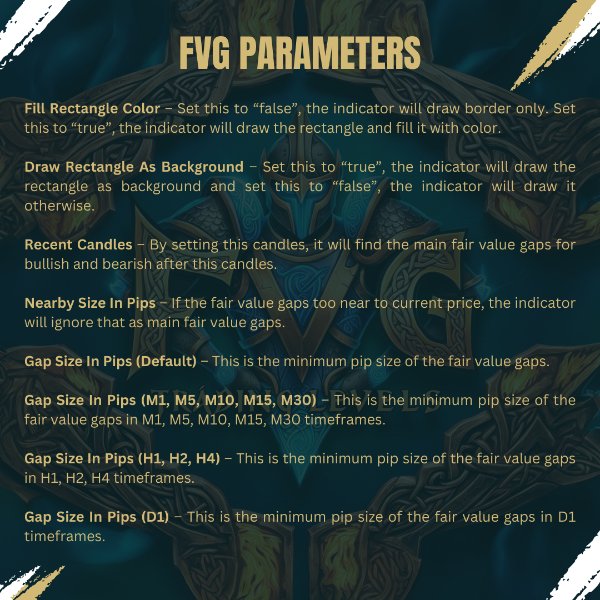
12) Fill Rectangle Color – Set this to “false”, the indicator will draw border only. Set this to “true”, the indicator will draw the rectangle and fill it with color.
13) Draw Rectangle As Background – Set this to “true”, the indicator will draw the rectangle as background and set this to “false”, the indicator will draw it otherwise.
14) Recent Candles – By setting this candles, it will find the main fair value gaps for bullish and bearish after this candles.
15) Nearby Size In Pips – If the fair value gaps too near to current price, the indicator will ignore that as main fair value gaps.
16) Gap Size In Pips (Default) – This is the minimum pip size of the fair value gaps.
17) Gap Size In Pips (M1, M5, M10, M15, M30) – This is the minimum pip size of the fair value gaps in M1, M5, M10, M15, M30 timeframes.
18) Gap Size In Pips (H1, H2, H4) – This is the minimum pip size of the fair value gaps in H1, H2, H4 timeframes.
19) Gap Size In Pips (D1) – This is the minimum pip size of the fair value gaps in D1 timeframes.
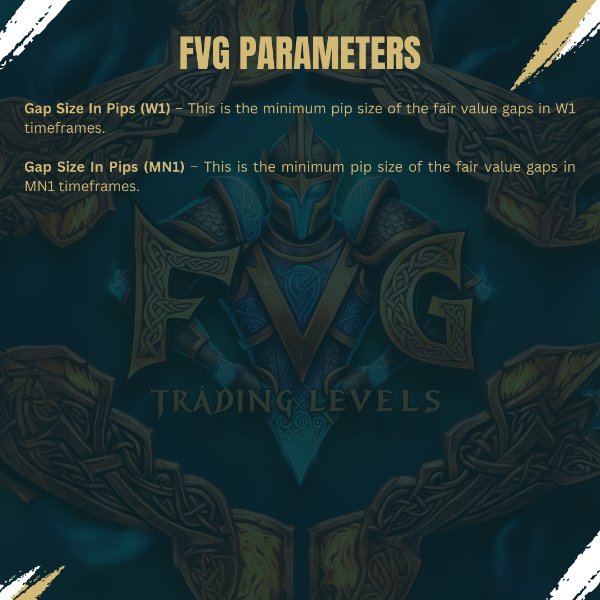
20) Gap Size In Pips (W1) – This is the minimum pip size of the fair value gaps in W1 timeframes.
21) Gap Size In Pips (MN1) – This is the minimum pip size of the fair value gaps in MN1 timeframes.

