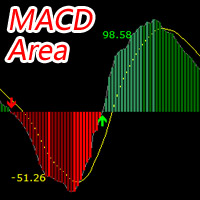
The MACD Area indicator is developed based on the system's built-in MACD indicator to enhance its functionality. The main enhancement is: average algorithm+four-color column+area value.
By default, the Exponential Average Algorithm (EMA) is used, and any of the four algorithms can be selected.
Algorithm 1: Fundamentals of Simple (SMA arithmetic moving average)
SMA, The abbreviation for arithmetic moving average is calculated by adding the closing prices of the last N days, dividing by N, and assigning the same weight to each point, presenting the average trajectory of the trend. In the trading industry, many software default moving average indicators are SMA because they are intuitive and easy to understand.
Algorithm 2: Exponential (EMA Moving Average) Agile Reactors
Unlike SMA, EMA adopts an exponential weighting method, giving higher weight to recent prices. When calculating, multiply today's closing price by a specific multiplier (such as 0.0952 for the 20 day line) plus yesterday's EMA value. This makes EMA more sensitive to price fluctuations and more sensitive to capturing short-term trends.
Algorithm 3: Smoothed (SMMA smoothed moving average) as a robust balancer
SMMA is not in a hurry to remove old data, but instead reduces weight processing. The first day calculation is the same as SMA, and then the weight of each new data point decreases. This smoothness makes SMMA smoother in trend recognition, reducing the impact of short-term fluctuations.
Algorithm 4: Linear Weighted (LWMA) is a pioneer in dynamically capturing trends
LWMA assigns higher weights to recent prices and decays linearly. After selecting the retrospective period n, the weight of each period decreases, making LWMA more responsive to price changes. When calculating, multiply the price point by point by weight and sum it up, then divide by the total weight.
Different market trends are suitable for different moving averages. A sensitive moving average provides an opportunity for early entry, but it may also lead to misjudgment; A sluggish moving average can filter out noise, but may miss out on more trades. Therefore, it is crucial to choose the most suitable moving average type based on the trading strategy. Remember, there is no absolute good or bad in trading. The key is to understand the characteristics of each indicator and accept its possible errors with a tolerant attitude. Every trading decision needs to be based on comprehensive analysis and flexible application that adapts to the market.
The most suitable variety for this indicator is XAUUSD, which can accurately capture the reversal process of trends in various time periods.
The MACD Area indicator has three main functions:
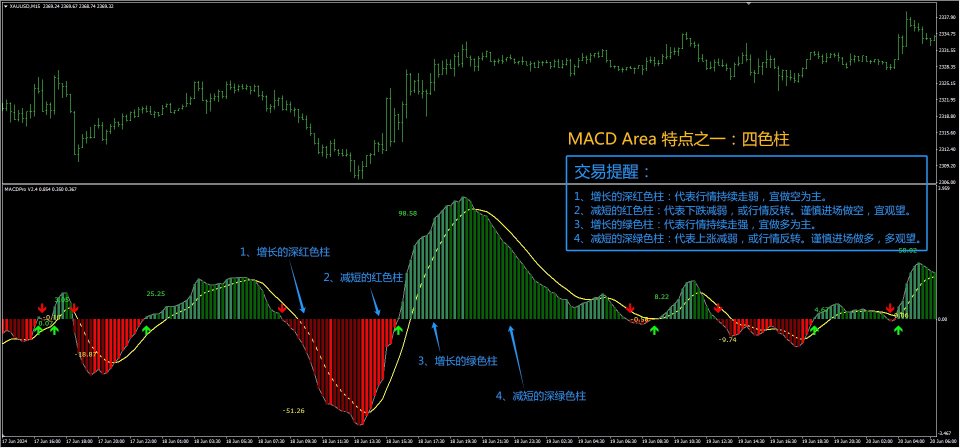
1. Four color MACD column
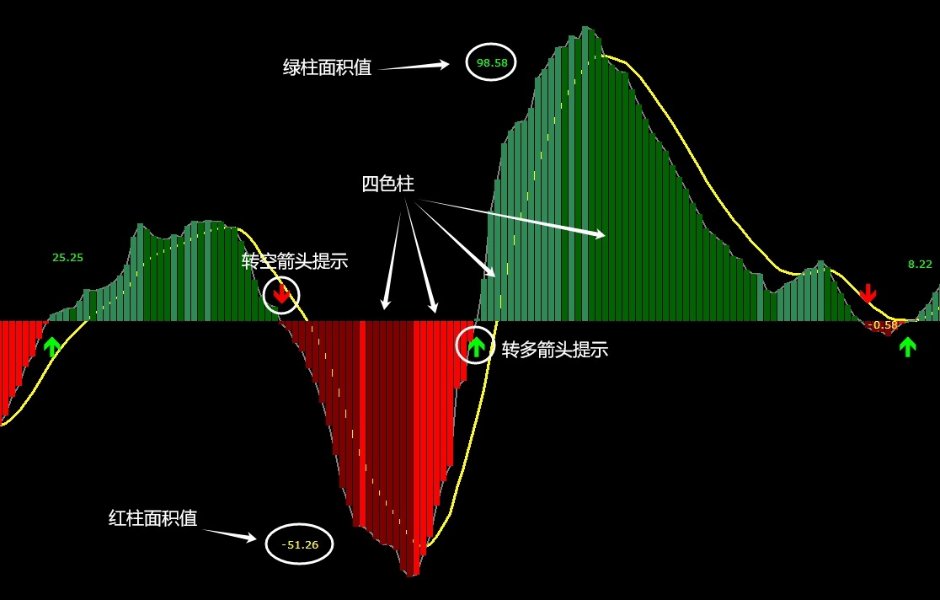
The horizontal line of the indicator is 0, usually referred to as the zero axis. The green bar below the zero axis usually represents bullish strength, while the red bar below the zero axis usually represents bearish strength. The longer the red bar, the stronger the bearish power, and the faster the market usually falls. The longer the green bar, the stronger the bullish power, and the faster the market rises.
Above the zero axis, displayed with a dual color green bar, the rising phase is green and the falling phase is dark green.
Below the zero axis, displayed with a two-color red bar, the descending phase is dark red and the ascending phase is red.
By using a color changing column, it is easy and clear to see the turning point position of the market trend.
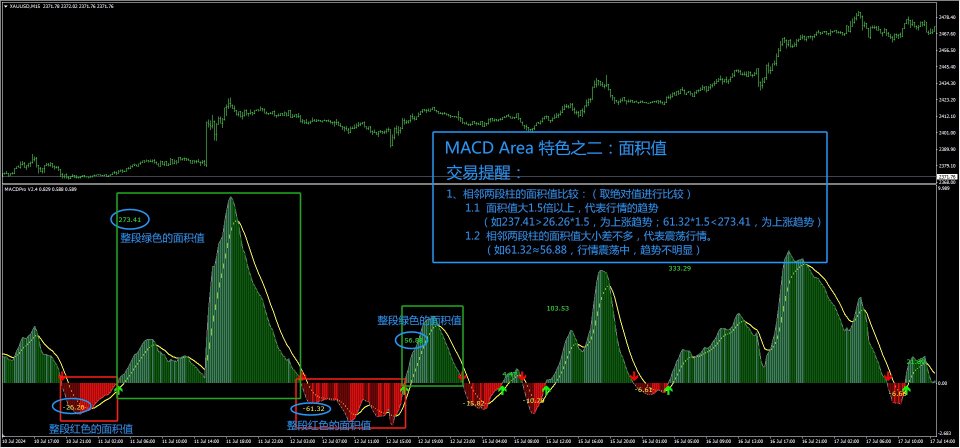
2. The area value of the entire red or green column
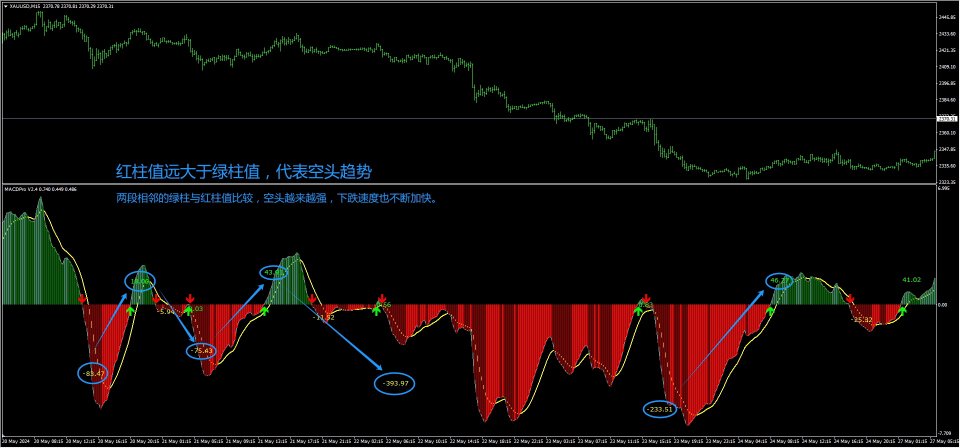
I have conducted statistical analysis on the values of each measuring column and displayed them in the indicators by color using the area value, which I call the area value, but it is not very accurate. Compared to the highest and lowest values of a single MACD column, the area value can more accurately reflect the strength magnitude. Because the area value not only includes the highest and lowest values, but also accumulates the duration of the market. If the duration is longer, the accumulated area value will be larger.
The method of judging the market based on the area value:
1、 The comparison between the area values of adjacent red and green bars can quickly determine the direction of the market.
A high red bar value indicates a short position, with a focus on short selling. A high green bar value indicates a long position, with a focus on long positions.
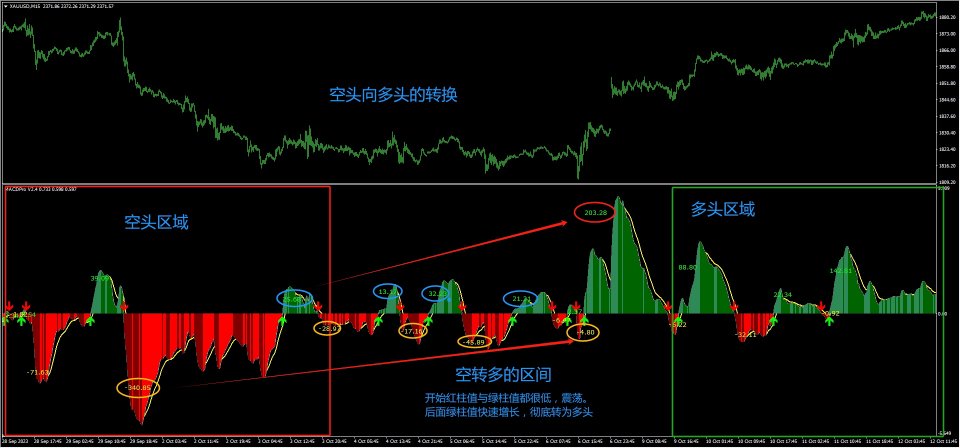
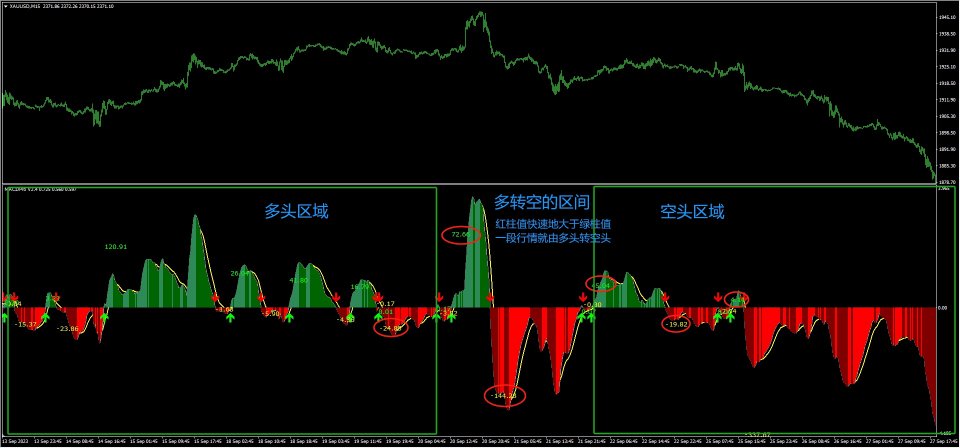
2、 The change in the values of two equally colored bars separated reflects the gradual transformation of power.
The area value of the red bar gradually decreases, while the area value of the green bar gradually increases, which is a process of transitioning from bearish to bullish. The final bullish value quickly surpassed the red bar value and completely turned into a bullish trend. The area value of the green bar gradually decreases, while the area value of the red bar gradually increases, which is a process of gradually transforming from bullish to bearish. The final bearish value quickly surpassed the green bar value and completely turned into a bearish trend.
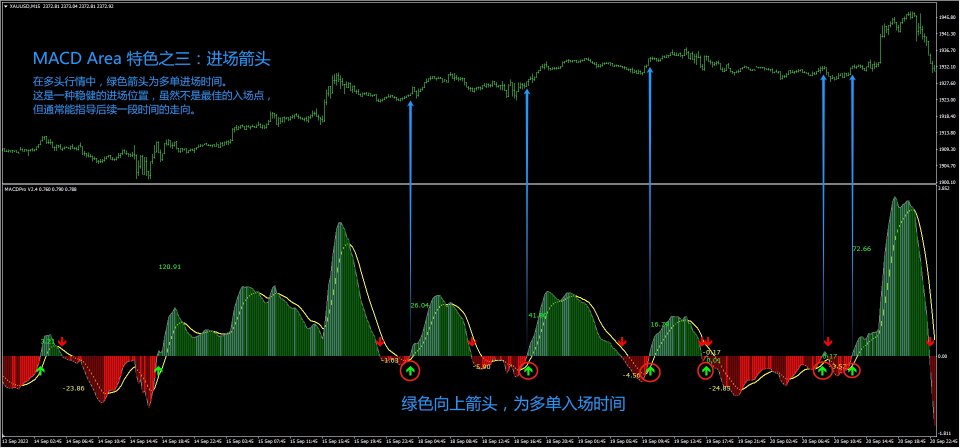
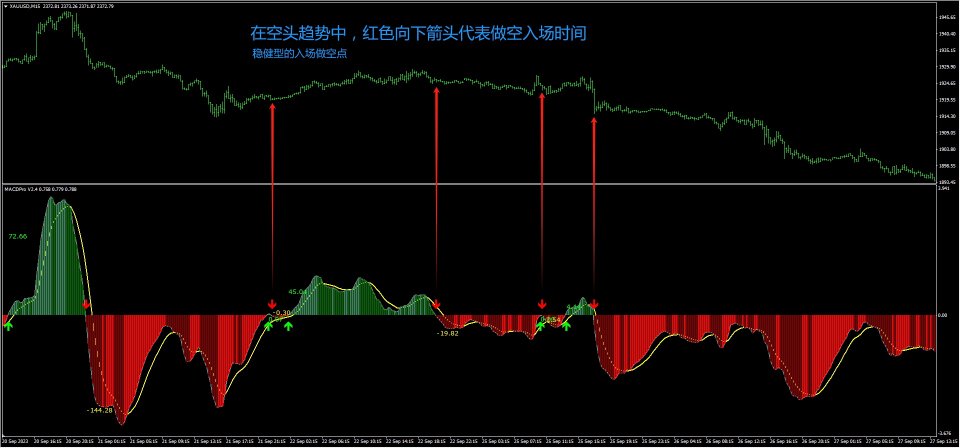
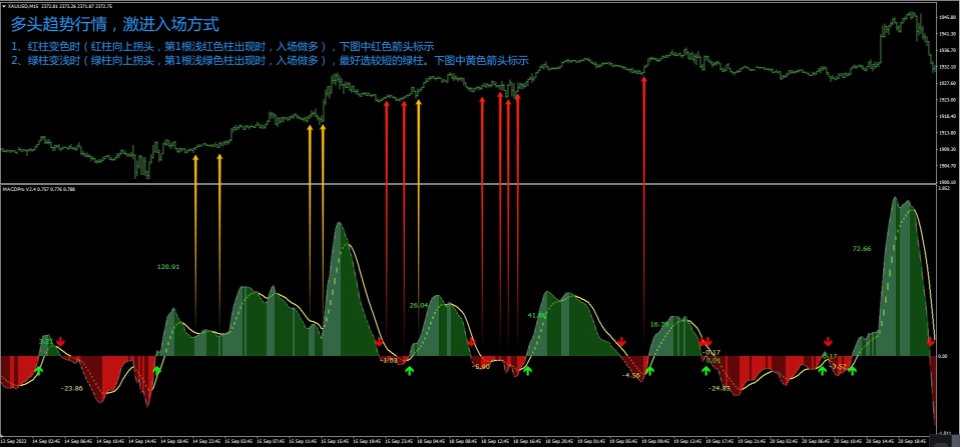
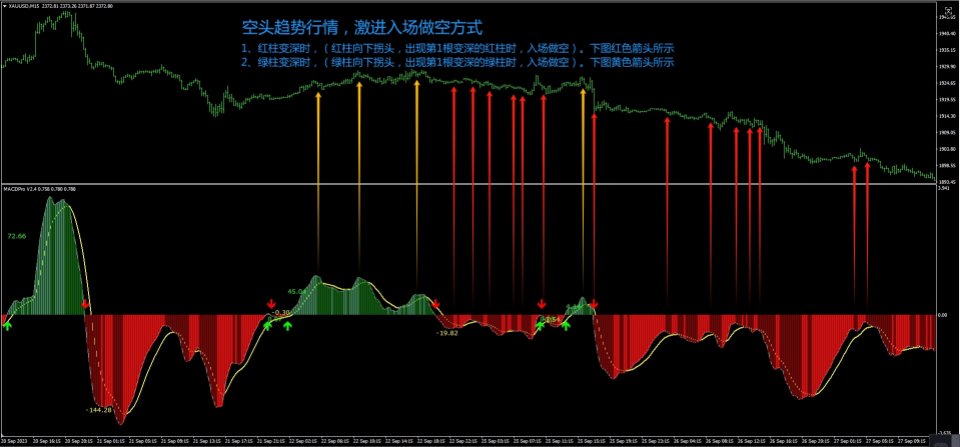
3. Indicator arrows remind entry or exit.
When the first red bar appears, a red arrow will be displayed to remind you to enter the short position bar area. If it is a bearish trend, you can follow the red arrow to enter the market with a short position. If holding multiple orders, this is the time to appear.
When the first green bar appears, a green arrow will be displayed to remind you to enter the multi head volume bar area. If it is a bullish trend, you can follow the red arrow to enter the market with multiple orders. If you hold a short position, this is the exit time.
