Triple Top Bottom Scan v4
- Indicadores
- Elif Kaya
- Versão: 1.0
- Ativações: 5
Introduction
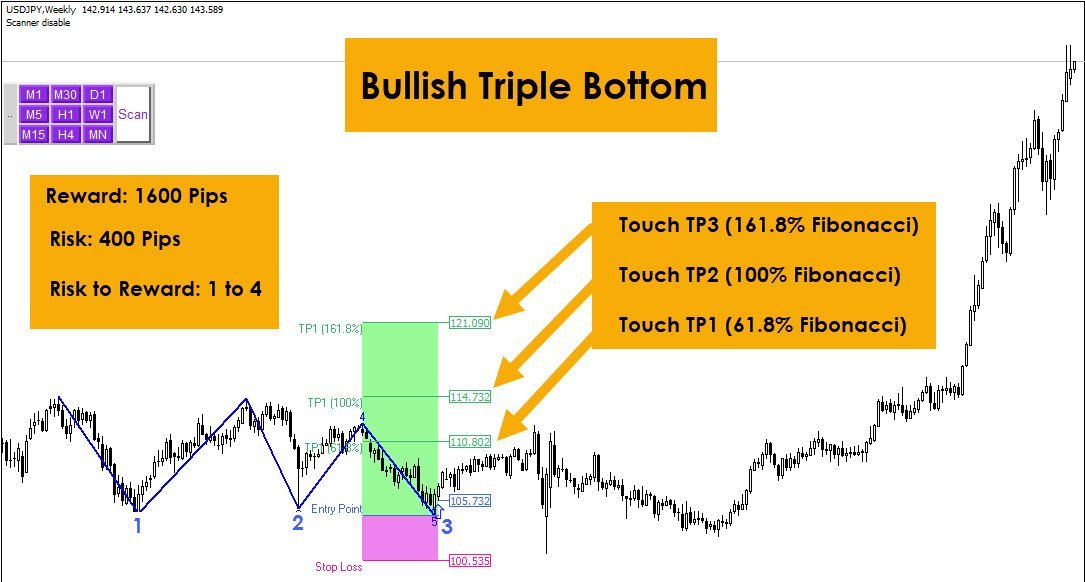
Chart patterns are an essential tool traders and investors use to analyze the future price movements of securities. One such pattern is the triple bottom or the triple top pattern, which can provide valuable insights into potential price reversals. This pattern forms when a security reaches a low price level three times before reversing upward or reaches a high price level three times before reversing downward.
Triple Top Bottom Pattern Scanner Indicator
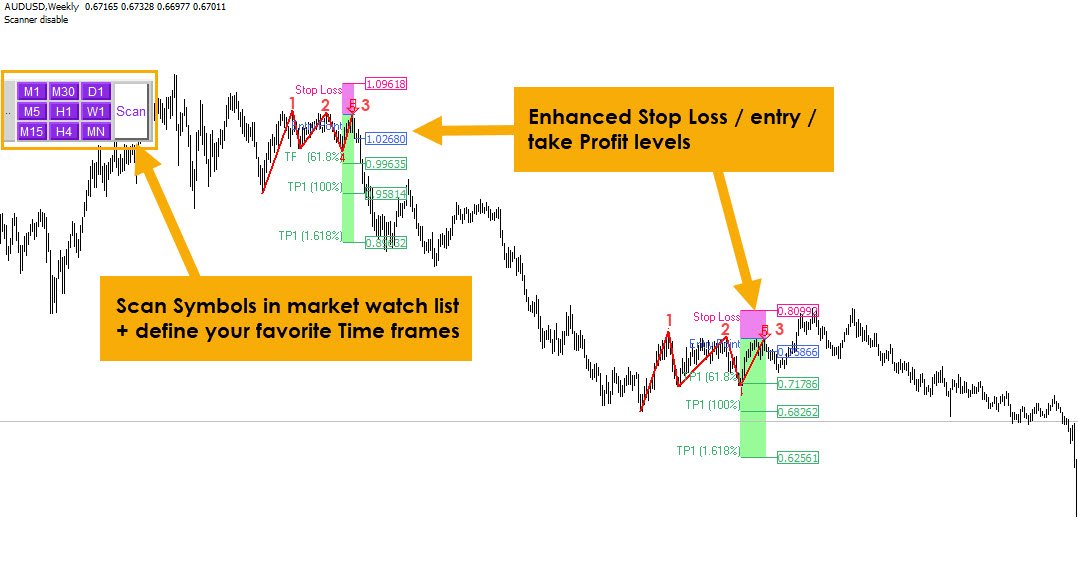
It is usually difficult for a trader to recognize classic patterns on a chart, as well as searching for dozens of charts and time frames will take time, and there is also a possibility of a trader's mistake in calculations. This indicator can automatically search all charts and time frames to find possible patterns in in one chart.
Searching, Fibonacci calculations and pattern recognition are completely the responsibility of the indicator; All you have to do is "press the scan button".
How To Trade?
All parameters necessary to enter the trade are calculated, such as entry point, stop-loss, and take-profit.
By observing the signal and deciding to trade, we enter the trade with the "set and forget" method.