Bayesian Trend analysis for MT4
- Indicadores
- Minh Truong Pham
- Versão: 1.1
- Ativações: 5
Bayesian methods can be effectively applied to predict price trends in financial markets, including Forex, stocks, and commodities. Here’s how Bayesian techniques can be used for trend prediction:
1. Bayesian Linear Regression
- Bayesian linear regression can be used to model the relationship between time and price. This method allows for the incorporation of prior beliefs about the trend and updates the trend as new data comes in.
Example:
Suppose you want to predict the price trend of a currency pair. You can start with a prior belief about the trend and update this belief as new price data becomes available.
2. Bayesian Moving Average
- Similar to traditional moving averages, Bayesian moving averages provide a way to smooth price data and identify trends. The Bayesian approach allows for the incorporation of uncertainty and updates with new data.
3. Bayesian Inference for Trend Identification
- Bayesian inference can be used to identify the probability of different trend states (e.g., uptrend, downtrend, or no trend). This involves specifying a model for the price process and using Bayesian methods to estimate the posterior probabilities of different trend states.
4. Bayesian Change Point Detection
- Change point detection methods can identify points where the statistical properties of the time series change. This is useful for detecting trend reversals or shifts in market regimes.
5. Bayesian Networks for Market Factors
- Bayesian networks can model the relationships between various market factors and the price trend. This helps in understanding how different variables, such as interest rates, economic indicators, and geopolitical events, influence the price trend.
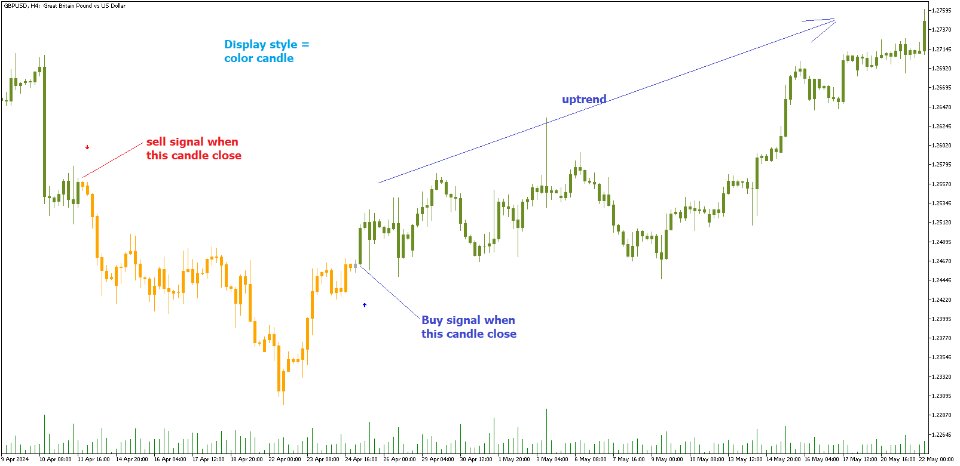
The "Bayesian Trend Indicator" is a sophisticated technical analysis tool designed to assess the direction of price trends in financial markets. It combines the principles of Bayesian probability theory with moving average analysis to provide traders with a comprehensive understanding of market sentiment and potential trend reversals.
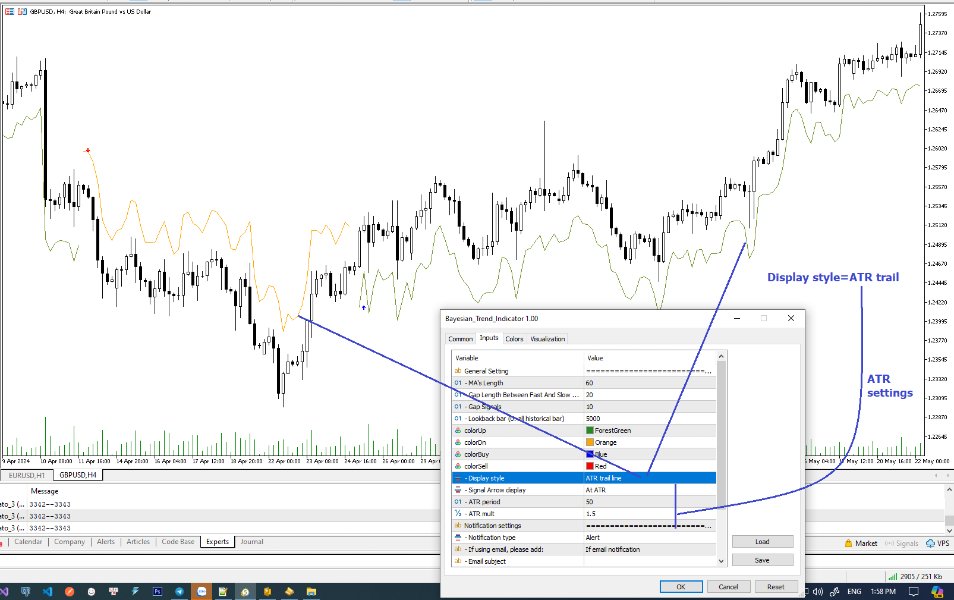
At its core, the indicator utilizes multiple moving averages, including the Exponential Moving Average (EMA), Simple Moving Average (SMA), Double Exponential Moving Average (DEMA), and Volume Weighted Moving Average (VWMA). These moving averages are calculated based on user-defined parameters such as length and gap length, allowing traders to customize the indicator to suit their trading strategies and preferences.
The indicator begins by calculating the trend for both fast and slow moving averages using a Smoothed Gradient Signal Function. This function assigns a numerical value to each data point based on its relationship with historical data, indicating the strength and direction of the trend.
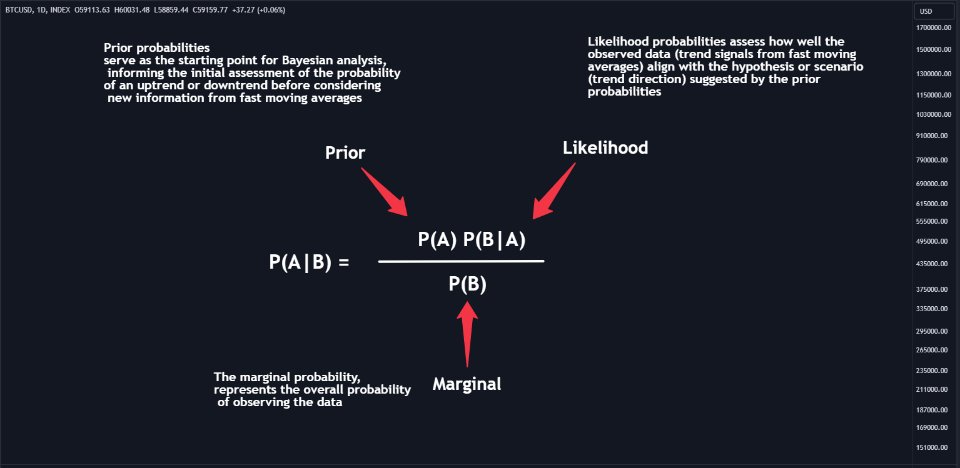
Next, the indicator calculates prior probabilities using the trend information from the slow moving averages and likelihood probabilities using the trend information from the fast moving averages. These probabilities represent the likelihood of an uptrend or downtrend based on historical data.
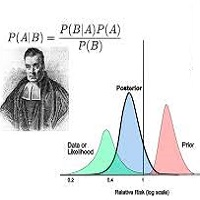
Using Bayes' theorem, the indicator then combines the prior and likelihood probabilities to calculate posterior probabilities, which reflect the updated probability of an uptrend or downtrend given the current market conditions. These posterior probabilities serve as a key signal for traders, informing them about the prevailing market sentiment and potential trend reversals.
