• Visão global
  • Comentários
  • Discussão

One day relative performance FINVIZ 1

In Forex trading, the 1-day relative performance statistic gives an overview of the movements of various currency pairings in a single day. For traders who want to quickly make trading decisions and comprehend short-term market movements, this statistic is essential. Here's a thorough explanation of the 1-day relative performance, its importance, and a closer look at several particular Finviz cases.

Understanding 1-Day Relative Performance

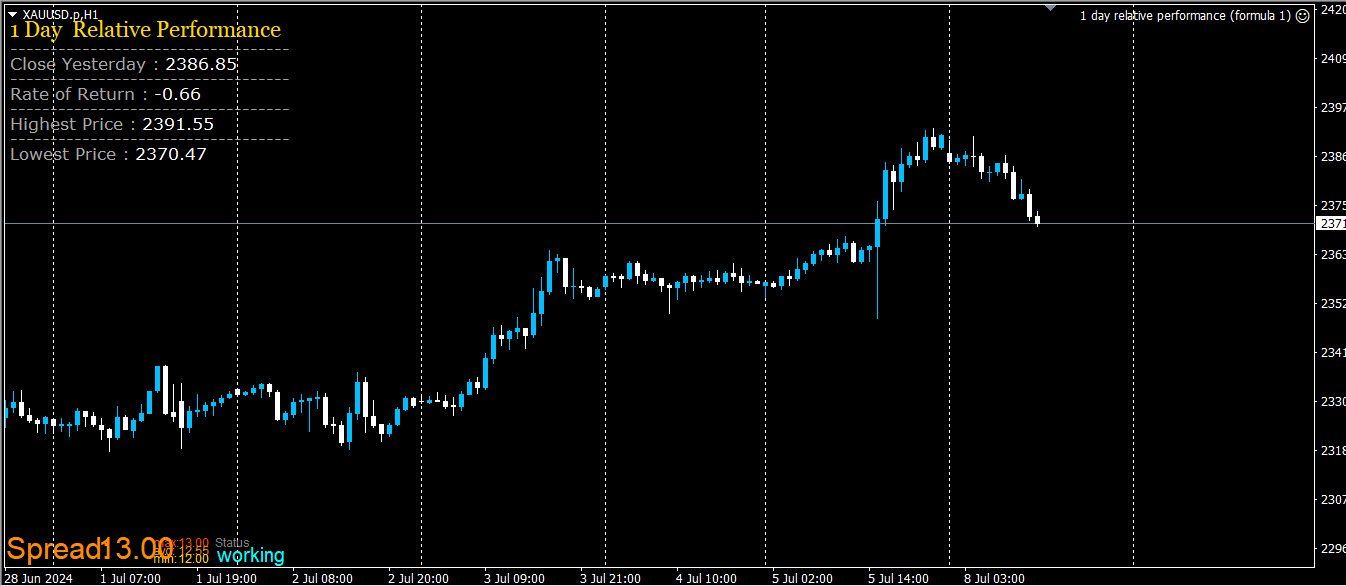
The percentage change in a currency pair's value between the close of the prior day and the close of the current day is measured by 1-day relative performance. For day traders and short-term investors who must monitor daily market changes, this performance statistic is essential. It offers insights into possible trading opportunities by assisting in determining whether currencies are strengthening or weakening in relation to one another.

Important Elements

  • Percentage Change: This shows the percentage change in value of a currency pair over the previous day. A positive percentage denotes appreciation and a negative percentage denotes depreciation of the currency pair.
  • A currency pair is any pair of two currencies that are being compared, such as EUR/USD, GBP/JPY, etc. For traders that concentrate on particular economies or areas, the performance of these pairs is critical.
  • Volatility: Daily performance information can also reveal a currency pair's volatility. strong percentage changes frequently indicate strong volatility, which may be brought on by changes in market mood, geopolitical events, or economic news.

Significance of 1-Day Relative Performance

  1. Sentiment in the Market: Daily performance measurements offer perceptions into the mood of the market. A currency like the USD, for example, may be a sign of strong investor confidence in the US economy if it is performing well across various pairs.
  2. Trading signals: To determine when to enter and quit the market, short-term traders employ these variables. A currency pair that has been trending higher for a few days, for instance, would indicate a buy opportunity.
  3. Risk management: Traders can better control their risk by knowing which currencies are volatile. Although they may present greater gains, pairs with high volatility also carry a higher risk.

Finviz example
Finviz offers comprehensive measures for Forex performance, such as relative performance over one day. These are a few instances derived from the available data:
  • BTCUSD: The one-day relative performance of the cryptocurrency pair BTC/USD was -0.21%. This suggests that during the previous day, Bitcoin lost 0.21% of its value relative to the US dollar
  • EURUSD: The EUR/USD currency pair, another significant one, may display a distinct performance indicator. A 0.40% increase, for example, would mean that the value of the Euro increased by 0.40% in a single day relative to the US Dollar.
  • GBPJPY: The British Pound has depreciated by 0.10% vs the Japanese Yen, according to the GBP/JPY pair's 1-day relative performance of -0.10%.
  • Click here to view an example of applying the FINVIZ theory to create the EA Forex.

Interpretation of Data

In analyzing 1-day relative performance data, traders frequently search for trends. constant daily gains, for instance, might point to an upward trend, whereas constant losses might point to a downward trend. To prevent making judgments based on short-term volatility, single-day performance should be considered in the larger context of weekly and monthly performance.

Practical Use in Trading Strategies

  • Scalping: Traders who engage in scalping look for small profits from minute-to-minute price changes. The 1-day relative performance helps identify which pairs are experiencing significant movement and might offer scalping opportunities.
  • Day Trading: Day traders, who open and close positions within the same trading day, use 1-day performance metrics to make informed decisions. They might look for pairs that have moved significantly to capture profit from reversals or continuation patterns.
  • Swing Trading: Even swing traders, who hold positions for several days, can use 1-day performance data to confirm the direction of their trades.

Conclusion

The 1-day relative performance is a crucial metric in Forex trading, providing valuable insights into daily market movements. Tools like Finviz offer comprehensive data that traders can use to gauge market sentiment, identify trading opportunities, and manage risk effectively. By understanding and utilizing this performance data, traders can make more informed and strategic decisions in the fast-paced Forex market. If you want to buy a .mq file, please get in touch with us via eaforexcenter.com
Mais do autor
Ichinoku Japan EA
Taman Talappetsakun
The Ichimoku Japan EA is a trading algorithm that uses two indicators, EMA and Ichimoku, to make decisions. While it was initially created for trading USD/JPY, it can also be used for EUR/USD and GBP/USD. The risk ratio for this EA is 1:2, meaning that the potential reward is twice the risk. The stop loss, take profit levels, and Lot size are determined by market volatility. Trading statistics List Details Initial Deposit $100 (minimum) but $1,000 is   recomment Currency Pair USD/JPY, EUR/USD, G
Hanuman Gold
Taman Talappetsakun
Hanuman gold is an EA Forex that is created based on EMA indicator and grid system. The strategy of Hanuman gold is very simple and is designed for XAU/USD trading. This EA Forex is good and friendly with investors. Read more detail : www.eaforexcenter.com Backtesting detail Tick data 99.9% for 5 years Spread variable 1-30 Leverage 1:500 Optimize Slippage Delay of market 20-40 ms Delay of pending 20-40 ms Time Frame: H1
Stoch Trend EA
Taman Talappetsakun
This EA Forex is developed based on a stochastic oscillator indicator. It sets the parameters including %K, Slowing, %D, Price filed, and MA method to fit with XAUUSD trading. The grid martingale is used to improve the trading strategy also. Recommend List Details Initial Deposit $1,000 OR 10,000 USC Currency Pair XAU/USD Time Frame M30 Relative DD 61.23% Profit  135% per year Winrate 75.10% Duraion 2-24 hr. Account ECN, STD, Cent account See more details about this EA Forex https://eaforexcente
Euro Capital EA
Taman Talappetsakun
This EA was developed based on EUR/USD currency but was also used for trading other currency pairs. The Euro capital ea is a dynamic grid martingale EA that can adjust the number of orders, but we recommend this value of just 3 orders per trade. In addition, the auto lot size was used to increase the performance of EA and money management. However, we have 2 setting modes for this ea. Using the Lot_Ratio as 25000 for STD mode and 35000 for Safe mode. If you have the quations, please get in touch
The One percent EA
Taman Talappetsakun
The 'One Percent Profit EA' is an algorithmic trading system that primarily uses the fractal indicator as its strategy. This EA is classified as a grid martingale EA. The lot size is calculated using a formula that adjusts the lot size automatically. The EA can also be switched to the fixed lot size mode to control drawdown. To secure your profits, you can choose to close orders by percentage or by monetary value. Trading statistics (2023-2024) List Details Initial Deposit $1,000 Currency Pair X
UltraGold EA
Taman Talappetsakun
This EA was designed for xauusd trading. Three indicators were used as the stretagy. The lot size can be multiplied by 2.0 and 3.0 (martingale). Maximun order can be adjusted to be 6 to 9 orders. Recommend List Details Initial Deposit $1,000 OR 10,000 USC Currency Pair XAU/USD Time Frame M1 Relative DD 48.55% CAGR 54.29% Profit factor 13.94 Winrate 61.99% Account ECN, STD, Cent account See more details about this EA Forex https://eaforexcenter.com
Euro Invester EA
Taman Talappetsakun
This EA is developed based on an RSI indicator that can trade on EUR/USD, GBP/USD, and AUD/USD. However, it is designed to trade on H4 only. The martingale is used as the strategy, but the fixed lot size also works. In addition, when the fix lot function is ignored, the lot size will be calculated automatically (Lot ratio = 10,000 is recomment). The Risk Ratio (SL:TP) is 1:1.2. --> This is the eighth wonder of the world. (compound interest), so it is worth the investment.  Trading statistics Lis
Double SAR EA
Taman Talappetsakun
This EA is based on twin Parabolic SAR indicators, with a Risk ratio of 1 per 4 and a 1.5-time martingale money management. Trading statistics (2018-2024) List Details Initial Deposit $500 (minimum), $1,000 Currency Pair NZD/USD, GBP/JPY Time Frame H4 Max DD 31.27% Relative DD 31.27% CAGR 50.95% Profit factor 2.60 Winrate 30.5% Account ECN, STD, Cent account See more details about this EA Forex ->  https://eaforexcenter.com
The Trend Diamond Analyzer, also known as Trend Advisor Diamond, is a market theory cycle used to analyze both the "buy side" and "sell side" and can identify various market phases. This tool was created by eaforexcenter.com based on the theory developed by Chuck Dukas. It combines technical indicators and market behavior, making it an excellent tool for analyzing market trends and phases.
Japanese Trend EA
Taman Talappetsakun
The Japanese Trend is an algorithmic trading system that uses the EMA indicator to detect bullish or bearish trends. The strategy involves the use of pullback technical and RSI indicators. This EA places orders when the super trend appears and applies a hedging strategy to minimize potential losses. The risk/reward ratio is set at 1:17 and the martingale is adjusted to 1.3. Trading statistics (2021-2024) List Details Initial Deposit $300-1,000 Currency Pair USD/JPY Time Frame H4 Max DD 49.78% Re
RSI pro bot
Taman Talappetsakun
The RSI Pro-EA is an algorithmic trading system that utilizes the RSI indicator and the 1-day rate of change as its strategy. The grid and martingale are calculated using fundamental knowledge, with a martingale ratio of 1.3 and a maximum of 3 orders. The system's weakness lies in its susceptibility to super trends. Trading statistics (2020-2024) List Details Initial Deposit $100 is minimum but $1,000 is Recommend Currency Pair AUD/CAD Time Frame M15 Max DD 24.68% Relative DD 32.25% CAGR 32.56 %
The EA is a trend analysis tool that utilizes the moving average (MA) to assess the strength of a trend. You have the ability to customize the MA period, time frame, and digits. This tool offers information about the trend percentage, direction, and strength. It is developed by eaforexcenter.com using software called fxDreema. If you are interested in exploring other tools, please visit us at eaforexcenter.com .
Volatility LOT EA
Taman Talappetsakun
This EA is developed using fxDreema software. The Bollinger Band and Parabolic SAR were used as the strategy of this EA. The risk ratio is one per one point two. This EA is designed to trade on GBP/JPY (H4). The lot size is calculated based on volatility and balance. Trading statistics List Details Initial Deposit $3,500 ( recomment ) but $1,000 is   high risk Currency Pair GBP/JPY Time Frame H4 Max DD 46.29% Relative DD 26.84 % AHPR 0.98 % Profit factor 2.15 Winrate 83.52 % Account ECN, STD, Ce
Filtro:
Sem comentários
Responder ao comentário