• Visão global
  • Comentários
  • Discussão
  • O que há de novo

Divergence Force

Divergence Force 1.0 Indicador de Divergência

Descrição

Divergence Force é um indicador projetado para identificar divergências entre o preço de um ativo e o MACD (Moving Average Convergence Divergence). Este indicador traça automaticamente as linhas de tendência nos máximos e mínimos do preço e do MACD, destacando as potenciais oportunidades de negociação.

Principais Funcionalidades

  • Identificação Automática de Divergências: O indicador detecta automaticamente divergências altistas e baixistas entre o preço e o MACD.
  • Rastreamento de Linhas de Tendência: Traça automaticamente as linhas de tendência nos máximos e mínimos consecutivos do preço e compara a tendência com os máximos e mínimos do MACD.
  • Sinais de Compra e Venda: Exibe claramente no gráfico sinais de compra ("Buy") e venda ("Sell") quando divergências são identificadas. Mostra "Neutral" quando nenhuma divergência é detectada.
  • Parâmetros Padrão do MACD: Utiliza os parâmetros padrão do MACD (12, 26, 9) para o cálculo, garantindo resultados confiáveis e reconhecidos.
  • Compatibilidade com Diferentes Timeframes: Otimizado para funcionar em um timeframe de 1 hora, mas pode ser aplicado a outros timeframes de acordo com as preferências do usuário.

Como Utilizar

  1. Instalação: Adicione o indicador à pasta Indicators da sua plataforma MetaTrader 5.
  2. Aplicação ao Gráfico: Carregue o indicador no gráfico desejado. O indicador começará automaticamente a traçar as linhas de tendência e a identificar as divergências.
  3. Interpretação dos Sinais:
    • Buy: Quando uma divergência altista é detectada, o indicador exibirá um sinal de "Buy".
    • Sell: Quando uma divergência baixista é detectada, o indicador exibirá um sinal de "Sell".
    • Neutral: Quando nenhuma divergência é detectada, o indicador exibirá "Neutral".

Exemplos Visuais

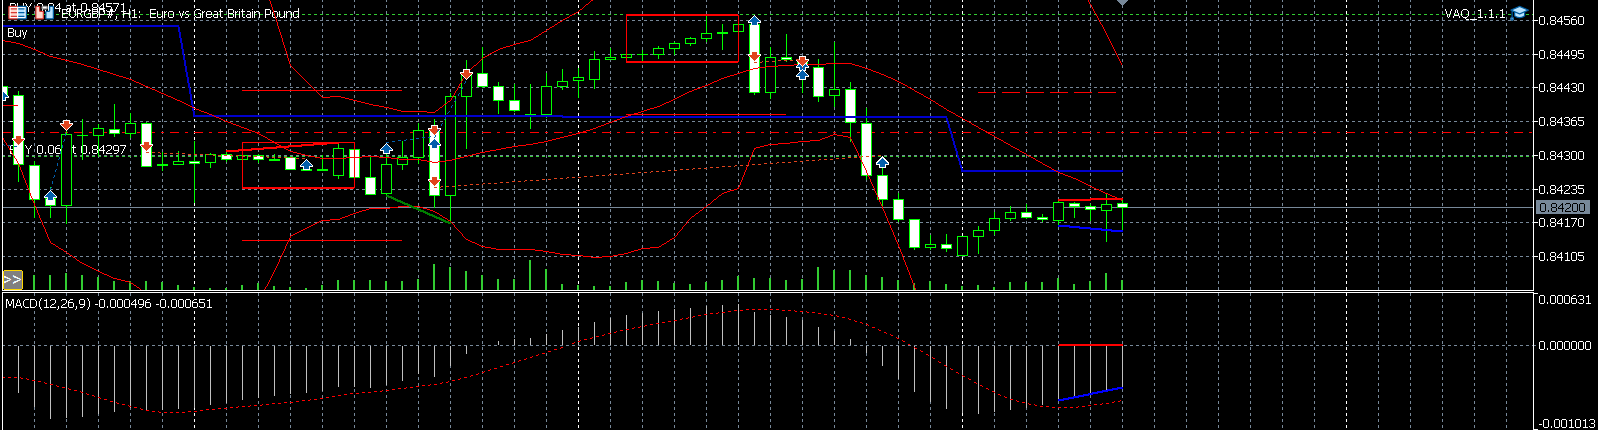
Divergência Altista (Buy):

  • Dois mínimos consecutivos do preço em aumento enquanto os correspondentes mínimos do MACD estão em diminuição.

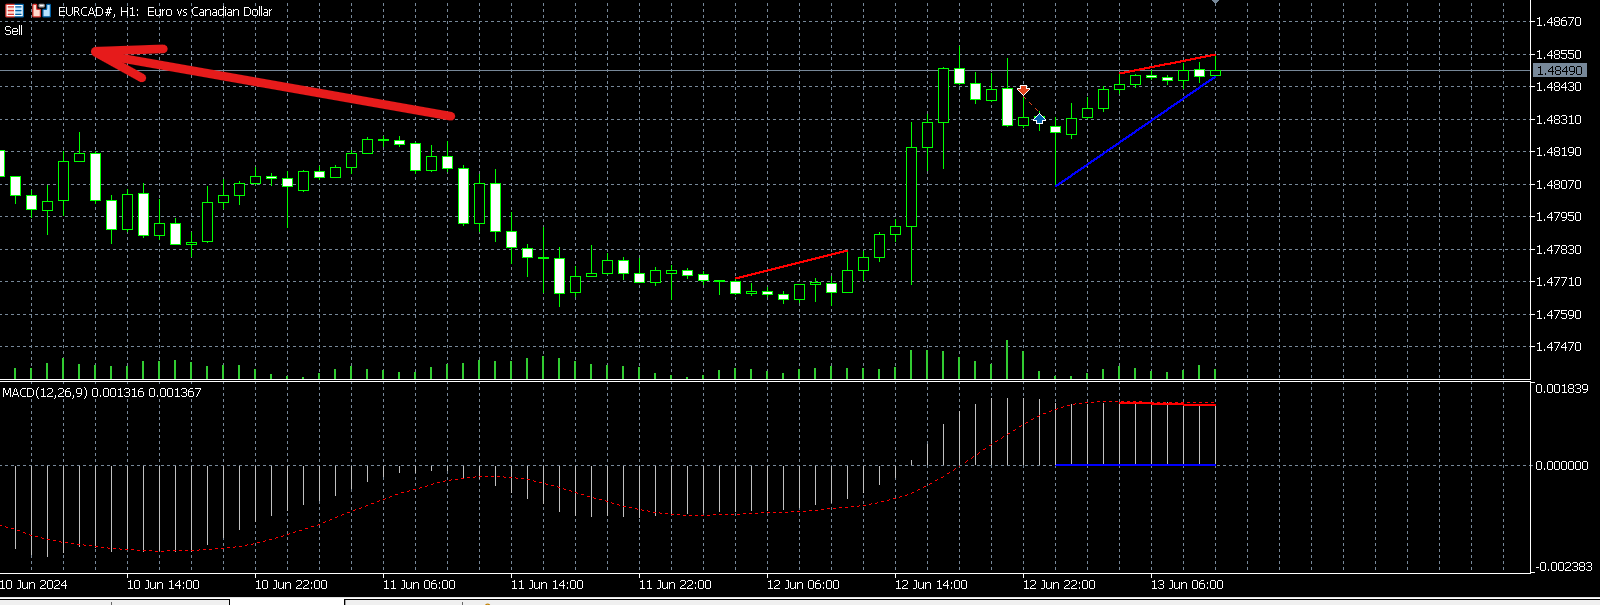
Divergência Baixista (Sell):

  • Dois máximos consecutivos do preço em diminuição enquanto os correspondentes máximos do MACD estão em aumento.

Conclusão

Divergence Force é um indicador útil para obter confirmações adicionais na sua estratégia de negociação. Com sua facilidade de uso e funcionalidades avançadas, este indicador pode ajudá-lo a melhorar suas estratégias de negociação e aumentar sua eficácia operacional.

Baixe Divergence Force hoje mesmo e leve sua negociação para o próximo nível!

Produtos recomendados
A professional tool for trading - the divergence indicator between the WPR and the price, which allows you to receive a signal about a trend reversal in a timely manner or catch price pullback movements (depending on the settings). The indicator settings allow you to adjust the strength of the divergence due to the angle of the WPR peaks and the percentage change in price, which makes it possible to fine-tune the signal strength. The indicator code is optimized and is tested very quickly as par
FREE
The indicator plots a curve of the difference between the values ​​of two trading instruments (currency pairs). The purpose of the indicator is to observe the processes of divergence and convergence of the values ​​of two trading instruments. The results obtained can be used for trading strategies of statistical arbitrage, pair trading, correlation, and others. Trading strategy The indicator is attached to the chart of any trading instrument. In the input parameters, the names of trading i
FREE
A professional tool for trading - the divergence indicator between the  MACD and the price, which allows you to receive a signal about a trend reversal in a timely manner or catch price pullback movements (depending on the settings). The indicator settings allow you to adjust the strength of the divergence due to the angle of the  MACD peaks and the percentage change in price, which makes it possible to fine-tune the signal strength. The indicator code is optimized and is tested very quickly as
FREE
Just another   Auto Fibonacci Retracement indicator . However, this is the most   Flexible   &   Reliable   one you can find for FREE. If you use this indicator and you like it, please leave a review/comment. If you are looking for a more advanced Fibo indicator, check this Free  Trend-Based Fibo indicator . ### FEATURES ### Auto-calculate up to 7 Fibonacci levels on your customized frame. Adjust levels as your need. Use High/Low price or  Open/Close price to calculate. Freeze the levels and don
FREE
A professional tool for trading - the divergence indicator between the MACD and the price, which allows you to receive a signal about a trend reversal in a timely manner or catch price pullback movements (depending on the settings). The indicator settings allow you to adjust the strength of the divergence due to the angle of the MACD peaks and the percentage change in price, which makes it possible to fine-tune the signal strength. The indicator code is optimized and is tested very quickly as p
FREE
Curver Arrows
Francis Dube
4 (9)
Este indicador é uma porta em linha reta de um conhecido indicador MetaTrader 4 que está disponível gratuitamente na Internet. Ele não redesenha. Ele implementa um tipo de estratégia de fuga. As setas indicam a direção do mercado. Use o indicador em gráficos M15 e superior.
FREE
Divergence Rsi Trader EA
Igor Widiger
4.43 (7)
Divergence RSI Trader is based on divergences in the chart and indicator (RSI Level 14). Divergence RSI Trader's strategy to find lows and highs on the chart and RSI indicator, analyze them and then open positions. EA was tested in the EURUSD H1 in the strategy tester and adjusted to this currency by default. EA has also been tested with other settings at GBPUSD M5 for 10 years and completed with good results. Because this is a free version, there will be no more tests and only updates. Please
FREE
RSI Divergence F
Andrey Dik
4.67 (6)
A professional tool for trading - the divergence indicator between the RSI and the price, which allows you to receive a signal about a trend reversal in a timely manner or catch price pullback movements (depending on the settings). The indicator settings allow you to adjust the strength of the divergence due to the angle of the RSI peaks and the percentage change in price, which makes it possible to fine-tune the signal strength. The indicator code is optimized and is tested very quickly as par
FREE
Original MACD
Kirill Paskhin
5 (4)
Moving Average Convergence/Divergence — схождение/расхождение скользящих средних — технический индикатор, разработанный Джеральдом Аппелем (Gerald Appel), используемый в техническом анализе для проверки силы и направления тренда, а также определения разворотных точек. Встроенный в MetaTrader 5 индикатор MACD не соответствует задумке автора (Gerald Appel): -линия MACD графически изображена в виде гистограммы, однако гистограммой отражается разница между линией MACD и сигнальной линией;  -сигнал
FREE
A professional tool for trading - the divergence indicator between the RSI and the price, which allows you to receive a signal about a trend reversal in a timely manner or catch price pullback movements (depending on the settings). The indicator settings allow you to adjust the strength of the divergence due to the angle of the RSI peaks and the percentage change in price, which makes it possible to fine-tune the signal strength. The indicator code is optimized and is tested very quickly as par
FREE
MACD indicators https://mql5.com This MACD indicator looks slightly different from the MACD indicator found in many other charting software. When the value of the signal line parameter is greater than the value of the MACD parameter, the indicator will give a buy prompt, and when the signal line parameter is less than the value of the MACD parameter, the indicator will give a sell prompt.
FREE
Insidious Me
Bin Jumahat Johan
4 (1)
This EA uses the RVI Crossovers. A crossover above the signal line is a bullish indicator, while a crossover below the signal line is a bearish indicator. The Relative Vigor Index (RVI) is a momentum indicator used in technical analysis. It measures the strength of a trend by comparing a security's closing price to its trading range while smoothing the results using a simple moving average (SMA). The Relative Vigor Index is considered a leading indicator, meaning it changes before the trend
FREE
Auto Fibonacci
Ali Gokay Duman
5 (2)
This indicator calculates fibonacci levels via moving averages trend and draw these lines. You can change fast and slow Moving Averages settings for customization. Inputs: Fast MA Time Period :  64 Fast MA Shift: 0 Fast MA Method: Smoothed Fast MA Apply To: Median Price Slow MA Time Period: 32 Slow MA Shift: 0 Slow MA Method: Smoothed Slow MA Apply To: Median Price ZigZag: False ZigZag Color: Red ZigZag Type: DashDot ZigZag Width: VeryThin Fibo Settings TrendFibonacci: True FiboTrendColor: Blac
FREE
This indicator is an automated version of the Fibonacci retracement (Fib) indicator. Deciding the best areas to use when drawing the fib can be tricky and this  indicator was made with that in mind. When you drop it on the chart it will automatically choose the best points to draw the fib with, but in case you aren't satisfied with those regions, you can adjust it as you wish.
FREE
A professional tool for trading - the divergence indicator between the  Stochastic and the price, which allows you to receive a signal about a trend reversal in a timely manner or catch price pullback movements (depending on the settings). The indicator settings allow you to adjust the strength of the divergence due to the angle of the  Stochastic peaks and the percentage change in price, which makes it possible to fine-tune the signal strength. The indicator code is optimized and is tested ver
FREE
A professional tool for trading - the divergence indicator between the  RVI and the price, which allows you to receive a signal about a trend reversal in a timely manner or catch price pullback movements (depending on the settings). The indicator settings allow you to adjust the strength of the divergence due to the angle of the  RVI peaks and the percentage change in price, which makes it possible to fine-tune the signal strength. The indicator code is optimized and is tested very quickly as p
FREE
A estratégia de negociação Moving Average Convergence Divergence (MACD) é uma ferramenta popular de análise técnica usada para identificar mudanças no impulso e direção da tendência. O MACD é calculado subtraindo a média móvel exponencial (EMA) de 26 períodos da EMA de 12 períodos. Uma EMA de 9 períodos, chamada "linha de sinal", é então plotada em cima do MACD para atuar como um gatilho para sinais de compra e venda. O MACD é considerado em território de alta quando a linha MACD está acima da l
FREE
Renko Chart
Marcin Konieczny
4.08 (12)
This indicator allows to display Renko charts in the indicator window. Renko charts show only price movements that are bigger than the specified box size. It helps to eliminate noise and allows to focus on main trends. Time is not a factor here. Only price movements are taken into account. That's why Renko chart is not synchronized with the main chart it is attached to. Indicator works in two modes: CLOSE - only close prices are taken into account while building the chart HIGH_LOW - only high/
FREE
This indicator is designed to detect high probability reversal patterns: Double Tops/Bottoms with fake breakouts . This is the FREE version of the indicator: https://www.mql5.com/en/market/product/29957 The free version works only on EURUSD and GBPUSD! Double top and bottom patterns are chart patterns that occur when the trading instrument moves in a similar pattern to the letter "W" (double bottom) or "M" (double top). The patterns usually occur at the end of a trend and are used to signal tren
FREE
Free automatic Fibonacci is an indicator that automatically plots a Fibonacci retracement based on the number of bars you select on the BarsToScan setting in the indicator. The Fibonacci is automatically updated in real time as new highest and lowest values appears amongst the selected bars. You can select which level values to be displayed in the indicator settings. You can also select the color of the levels thus enabling the trader to be able to attach the indicator several times with differe
FREE
AliPivot Points is a Meta Trader 5 Indicator that draws you the latest pivot points. You can choose from timeframes ranging from 1 Minute to 1 Month. Calculation methods for pivot points includes: Classic Pivot Points Camarilla Pivot Points Fibonacci Pivot Points Woodie Pivot Points You can personalize the line colors, style, and width to suit your preference. The indicator displays values on the right side of the chart. AliPivot Points values can also be utilized by developers for creating Expe
FREE
WatchList MACD
Wojciech Daniel Knoff
5 (1)
This is an alert based on a moving average convergence / divergence (MACD) and additional moving average indicator (for trend confirmation) similar to my other product  where you find detailed description of how it works. You get a colored table where colors are related to trading conditions (see below) with possibility to customize all indicator parameters, including Heikin Ashi calculations. Meaning of cell COLORS (can be redefined by user): GREEN - buy signal, PINK - sell signal, YELLOW - pay
FREE
HydraAlchemist
Haruki Teranaka
Apresentando HydraAlchemist, uma ferramenta de negociação automatizada inovadora. Este Expert Advisor (EA) de última geração combina habilmente vários indicadores técnicos para identificar oportunidades de negociação promissoras nos mercados financeiros. Nosso objetivo é maximizar os lucros examinando os sinais obtidos de indicadores como MACD, estocástico e RSI usando nossa própria lógica e captando com precisão as tendências do mercado e os pontos de viragem. A verdadeira força do 'HydraAlc
FREE
Este indicador inovador de medir a força das moedas da INFINITY é um assistente indispensável para cambistas e comerciantes que negociam em longo prazo. O sistema de análise de força / fraqueza das moedas é conhecido há muito tempo e é usado no mercado pelos principais traders do mundo. Qualquer negociação de arbitragem não está completa sem essa análise. Nosso indicador determina facilmente a força das moedas subjacentes em relação umas às outras. Ele exibe gráficos de linhas em todas ou no pa
FREE
Donchian Clouds
Samuel Manoel De Souza
The Indicator indicator draws 2 clouds based on Donchian Channels indicator values. The upper cloud is formed by the upper lines values and the lower cloud by the lowers lines values. The indicator allows to change the Channels parameters and the clouds colors the period of the base line and the multiplier of each Donchian Channels instance. The indicator holds 5 buffer index as follow: [0] - Outer values of the upper cloud [1]  - Inner values of the upper cloud [2]  - Base/Center line values [3
FREE
ToolBot Probabilistic Analysis
Josue De Matos Silva
4.33 (3)
ToolBot Probabilistic Analysis -  GRATUITO   Um eficaz indicador para suas negociações O indicador toolbot traz o cálculo de candles e uma análise de probabilística para que você tenha mais segurança em suas negociações.  Teste também nosso indicador de topos e fundos   GRATUITO :    https://www.mql5.com/pt/market/product/52385#description Teste também nosso indicador de  (RSI, ATR, ADX, OBV)    GRATUITO :    https://www.mql5.com/pt/market/product/53448#description Teste nosso EA ToolBo
FREE
Automatic Trendlines
Pasi Hakamaki
4.65 (51)
O indicador desenha linhas de tendência no gráfico. Este indicador possui seis entradas. O usuário pode especificar rótulos alternativos para ambas as linhas. Se várias instâncias do indicador forem usadas, os rótulos devem ser diferentes. O usuário pode definir a largura e a cor das linhas e a profundidade que especifica quais picos significativos devem ser usados. Por exemplo, Depth = 10 define as linhas de tendência usando os picos e vales atuais que têm pelo menos 10 barras à direita e à esq
FREE
Ever wanted to use MACD like you see in TradingView??? Now you can use this indicator to use same MACD in your MetaTrader5 and enjoy more time in Trading.. You can change MACD settings if you want to change and it will be ready to use for you... Now you will not spend time in TradingView to use only indicator there... Open charts , load Indicator and you are ready to do analysis in MetaTrader5 and Put Trades when you feel okay with your analysis.
FREE
SDivergence
Mobin Zarekar
1 (1)
SDivergence Indicator calculates and shows regular divergences and hidden divergences for MACD and Stochastic(for now). The benefit of this indicator is multiple input variables. Using these inputs you can modify to get more adaptive RD and HD's to your strategy. Guide : 1- First put your desired oscillator (MACD or Stochastic or Both) on the chart. 2- Run SDivergence indicator and set corresponding sub-window index of previously put oscillator in SDivergence input window. -Note: the chart sub-w
FREE
Momentum Reversal
Grigorii Matsnev
4.5 (2)
Momentum Reversal é uma ferramenta poderosa para detectar possíveis pontos de reversão e iniciar a correção, com base na análise da intensidade dos movimentos de preços e nas formações de barras. _________________________________ Como usar os sinais indicadores: O indicador forma um sinal após o aparecimento de uma nova barra de preços. Recomenda-se usar o sinal gerado após o preço romper o ponto crítico na direção especificada. O indicador não redesenha seus sinais. ___________________
FREE
Os compradores deste produto também adquirem
Atomic Analyst MT5
Issam Kassas
5 (15)
Primeiramente, vale ressaltar que este Indicador de Negociação não repinta, não redesenha e não apresenta atrasos, tornando-o ideal tanto para negociação manual quanto automatizada. Manual do utilizador: configurações, entradas e estratégia. O Analista Atômico é um Indicador de Ação de Preço PA que utiliza a força e o momentum do preço para encontrar uma vantagem melhor no mercado. Equipado com filtros avançados que ajudam a remover ruídos e sinais falsos, e aumentam o potencial de negociação.
Primeiramente, vale ressaltar que este Sistema de Trading é um Indicador Não Repintado, Não Redesenho e Não Atrasado, o que o torna ideal tanto para o trading manual quanto para o automatizado. Curso online, manual e download de predefinições. O "Sistema de Trading Inteligente MT5" é uma solução completa de trading projetada para traders novos e experientes. Ele combina mais de 10 indicadores premium e apresenta mais de 7 estratégias de trading robustas, tornando-o uma escolha versátil para dive
Quantum Trend Sniper
Bogdan Ion Puscasu
5 (46)
Apresentando       Quantum Trend Sniper Indicator   , o inovador Indicador MQL5 que está transformando a maneira como você identifica e negocia as reversões de tendência! Desenvolvido por uma equipe de traders experientes com experiência comercial de mais de 13 anos,       Indicador de Atirador de Tendência Quântica       foi projetado para impulsionar sua jornada de negociação a novos patamares com sua forma inovadora de identificar reversões de tendência com precisão extremamente alta. ***C
Gold Stuff mt5
Vasiliy Strukov
4.9 (181)
Gold Stuff mt5-um indicador de tendência projetado especificamente para o ouro, também pode ser usado em qualquer instrumento financeiro. O indicador não é redesenhado ou atrasado. O timeframe recomendado é H1. Importante! Entre em contato comigo imediatamente após a compra para obter instruções e bônus!  Você pode obter uma cópia gratuita do nosso indicador Strong Support e Trend Scanner, envie uma mensagem privada. a mim! PARÂMETRO Draw Arrow-incl.desligado. desenhar setas no gráfico. A
AT Forex Indicator MT5
Marzena Maria Szmit
5 (3)
The AT Forex Indicator MT5 is a sophisticated trading tool designed to provide traders with a comprehensive analysis of multiple currency pairs. This powerful indicator simplifies the complex nature of the forex market, making it accessible for both novice and experienced traders. AT Forex Indicator uses advanced algorithms to detect trends, patterns and is an essential tool for traders aiming to enhance their forex trading performance. With its robust features, ease of use, and reliable signal
Antes de tudo, vale ressaltar que esta Ferramenta de Negociação é um Indicador Não Repintante, Não Redesenhante e Não Atrasado, o que a torna ideal para negociação profissional. Curso online, manual do utilizador e demonstração. O Indicador de Conceitos de Ação de Preço Inteligente é uma ferramenta muito poderosa tanto para traders novos quanto experientes. Ele combina mais de 20 indicadores úteis em um único, combinando ideias avançadas de negociação como Análise do Trader do Círculo Intern
Reversal First Impulse levels (RFI)      INSTRUCTIONS        RUS       -       ENG              R ecommended to use with an indicator   -   TPSpro  TREND PRO -  Version MT4                 A key element in trading is zones or levels from which decisions to buy or sell a trading instrument are made. Despite attempts by major players to conceal their presence in the market, they inevitably leave traces. Our task was to learn how to identify these traces and interpret them correctly. Main functi
Este é um indicador para MT5 que fornece sinais precisos para entrar em uma negociação sem redesenhar. Ele pode ser aplicado a qualquer ativo financeiro: forex, criptomoedas, metais, ações, índices. Ele fornecerá estimativas bastante precisas e informará quando é melhor abrir e fechar um negócio. Assista o vídeo (6:22) com um exemplo de processamento de apenas um sinal que compensou o indicador! A maioria dos traders melhora seus resultados de negociação durante a primeira semana de negociação c
Trend Screener Pro MT5
STE S.S.COMPANY
4.88 (66)
Desbloqueie o poder da negociação de tendências com o indicador Trend Screener: sua solução definitiva de negociação de tendências, alimentada por lógica difusa e sistema de múltiplas moedas! Eleve sua negociação de tendências com o Trend Screener, o revolucionário indicador de tendências alimentado por lógica difusa. É um poderoso indicador de acompanhamento de tendências que combina mais de 13 ferramentas e recursos premium e 3 estratégias de negociação, tornando-o uma escolha versátil para to
FX Power MT5 NG
Daniel Stein
5 (5)
Receba a sua atualização diária do mercado com detalhes e screenshots através do nosso Morning Briefing aqui no mql5 e no Telegram ! O FX Power MT5 NG é a próxima geração do nosso medidor de força de moeda muito popular de longa data, o FX Power. E o que é que este medidor de força da próxima geração oferece? Tudo o que adorou no FX Power original MAIS Análise de força GOLD/XAU Resultados de cálculo ainda mais precisos Períodos de análise configuráveis individualmente Limite de cálculo personal
TPSproTREND PrO MT5
Roman Podpora
4.88 (8)
TPSpro TRENDPRO  - is a trend indicator that automatically analyzes the market and provides information about the trend and each of its changes, as well as giving signals for entering trades without redrawing! The indicator uses each candle, analyzing them separately. referring to different impulses - up or down impulse. Exact entry points into transactions for currencies, crypto, metals, stocks, indices!  -  Version MT4               DETAILED DESCRIPTION               R ecommended to use with
Apresentando       Quantum Breakout PRO   , o inovador Indicador MQL5 que está transformando a maneira como você negocia Breakout Zones! Desenvolvido por uma equipe de traders experientes com experiência comercial de mais de 13 anos,       Quantum Breakout PRO       foi projetado para impulsionar sua jornada comercial a novos patamares com sua estratégia de zona de fuga inovadora e dinâmica. O Quantum Breakout Indicator lhe dará setas de sinal em zonas de breakout com 5 zonas-alvo de lucro e
FX Volume MT5
Daniel Stein
4.94 (17)
Receba a sua atualização diária do mercado com detalhes e screenshots através do nosso Morning Briefing aqui no mql5 e no Telegram ! O Volume FX é o PRIMEIRO e ÚNICO indicador de volume que fornece uma visão REAL do sentimento do mercado do ponto de vista de um corretor. Ele fornece uma visão incrível de como os participantes do mercado institucional, como corretores, estão posicionados no mercado Forex, muito mais rápido do que os relatórios COT. Ver essas informações diretamente no seu gráfi
ICT, SMC, SMART MONEY CONCEPTS, SMART MONEY, Smart Money Concept, Support and Resistance, Trend Analysis, Price Action, Market Structure, Order Blocks, BOS/CHoCH,   Breaker Blocks ,  Momentum Shift,   Supply&Demand Zone/Order Blocks , Strong Imbalance,   HH/LL/HL/LH,    Fair Value Gap, FVG,  Premium  &   Discount   Zones, Fibonacci Retracement, OTE, Buy Side Liquidity, Sell Side Liquidity, BSL/SSL Taken, Equal Highs & Lows, MTF Dashboard, Multiple Time Frame, BigBar, HTF OB, HTF Market Structure
Matrix Arrow Indicator MT5
Juvenille Emperor Limited
5 (14)
O   Matrix Arrow Indicator MT5   é uma tendência única 10 em 1 seguindo um indicador multi-timeframe   100% sem repintura   que pode ser usado em todos os símbolos/instrumentos:   forex ,   commodities ,   criptomoedas ,   índices ,   ações .  O  Matrix Arrow Indicator MT5  determinará a tendência atual em seus estágios iniciais, reunindo informações e dados de até 10 indicadores padrão, que são: Índice de movimento direcional médio (ADX) Índice de canal de commodities (CCI) Velas clássicas de
Torne-se um Negociador Breaker e lucre com as mudanças na estrutura do mercado à medida que o preço reverte. O indicador de quebra de bloco de pedidos identifica quando uma tendência ou movimento de preço está chegando à exaustão e pronto para reverter. Ele o alerta sobre mudanças na estrutura do mercado, que normalmente ocorrem quando uma reversão ou uma grande retração está prestes a ocorrer. O indicador usa um cálculo proprietário que identifica rupturas e momento do preço. Toda vez que
Bill Williams Advanced
Siarhei Vashchylka
5 (7)
Bill Williams Advanced is designed for automatic chart analysis using Bill Williams' "Profitunity" system. The indicator analyzes four timeframes at once. Manual (Be sure to read before purchasing) Advantages 1. Automatically analyzes the chart using the "Profitunity" system of Bill Williams. The found signals are placed in a table in the corner of the screen. 2. Equipped with a trend filter based on the Alligator indicator. Most of the system signals are recommended to be used only accordi
Gartley Hunter Multi
Siarhei Vashchylka
5 (7)
Gartley Hunter Multi - An indicator for searching for harmonic patterns simultaneously on dozens of trading instruments and on all possible timeframes. Manual (Be sure to read before purchasing) | Version for MT4 Advantages 1. Patterns: Gartley, Butterfly, Shark, Crab. Bat, Alternate Bat, Deep Crab, Cypher 2. Simultaneous search for patterns on dozens of trading instruments and on all possible timeframes 3. Search for patterns of all possible sizes. From the smallest to the largest 4. A
Auto Order Block with break of structure based on ICT and Smart Money Concepts (SMC) Futures Break of Structure ( BoS )             Order block ( OB )            Higher time frame Order block / Point of Interest ( POI )    shown on current chart           Fair value Gap ( FVG ) / Imbalance   -  MTF      ( Multi Time Frame )    HH/LL/HL/LH  -  MTF      ( Multi Time Frame )  Choch  MTF      ( Multi Time Frame )  Volume Imbalance     ,  MTF          vIMB Gap’s Power of 3 Equal High
RelicusRoad Pro MT5
Relicus LLC
4.83 (23)
Agora US $ 147 (aumentando para US $ 499 após algumas atualizações) - Contas ilimitadas (PCs ou Macs) Manual do usuário do RelicusRoad + vídeos de treinamento + acesso ao grupo de discórdia privado + status VIP UMA NOVA FORMA DE OLHAR PARA O MERCADO O RelicusRoad é o indicador de negociação mais poderoso do mundo para forex, futuros, criptomoedas, ações e índices, oferecendo aos traders todas as informações e ferramentas necessárias para se manterem rentáveis. Fornecemos análises técnica
TPA True Price Action indicator reveals the true price action of the market makers through 100% non-repainting signals strictly at the close of a candle! TPA shows entries and re-entries, every time the bulls are definitely stronger than the bears and vice versa. Not to confuse with red/green candles. The shift of power gets confirmed at the earliest stage and is ONE exit strategy of several. There are available now two free parts of the TPA User Guide for our customers. The first "The Basics"
AW Trend Predictor MT5
AW Trading Software Limited
4.78 (58)
A combinação de níveis de tendência e quebra em um sistema. Um algoritmo de indicador avançado filtra o ruído do mercado, determina a tendência, os pontos de entrada e os possíveis níveis de saída. Os sinais indicadores são registrados em um módulo estatístico, que permite selecionar as ferramentas mais adequadas, mostrando a eficácia do histórico do sinal. O indicador calcula as marcas Take Profit e Stop Loss. Manual e instruções ->   AQUI   / versão MT4 ->   AQUI Como negociar com o indicador
Advanced Supply Demand MT5
Bernhard Schweigert
4.53 (15)
Atualmente com 33% de desconto! A melhor solução para qualquer Trader Novato ou especialista! Este indicador é uma ferramenta de negociação exclusiva, de alta qualidade e acessível porque incorporamos uma série de recursos proprietários e uma nova fórmula. Com esta atualização, você poderá mostrar fusos horários duplos. Você não só será capaz de mostrar um TF mais alto, mas também mostrar ambos, o TF do gráfico, MAIS o TF mais alto: MOSTRANDO ZONAS ANINHADAS. Todos os traders de Oferta e Demanda
Dark Absolute Trend   is an Indicator for intraday trading. This Indicator is based on   Trend Following  strategy but use also candlestick patterns and Volatility. We can enter in good price with this Indicator, in order to follow the main trend on the current instrument. It is advised to use low spread ECN brokers. This Indicator does   Not repaint   and   N ot lag . Recommended timeframes are M5, M15 and H1. Recommended working pairs: All. I nstallation and  Update Guide   -  Troubleshooting
Easy By Sell is a market indicator for opening and closing positions. It becomes easy to track market entries with alerts. It indicates trend reversal points when a price reaches extreme values ​​and the most favorable time to enter the market. it is as effective as a Fibonacci to find a level but it uses different tools such as an algorithm based on ATR indicators and Stochastic Oscillator. You can modify these two parameters as you wish to adapt the settings to the desired period. My othe
Este painel mostra os últimos   padrões harmónicos   disponíveis para os símbolos seleccionados, pelo que poupará tempo e será mais eficiente /   versão MT4 . Indicador gratuito:   Basic Harmonic Pattern Colunas do indicador Symbol :   aparecem os símbolos seleccionados Trend :   de alta ou de baixa Pattern :   tipo de padrão (gartley, borboleta, morcego, caranguejo, tubarão, cifra ou ABCD) Entry :   preço de entrada SL:   preço de paragem de perda TP1:   preço do 1º take profit TP2:   preç
Was: $249  Now: $99   Market Profile defines a number of day types that can help the trader to determine market behaviour. A key feature is the Value Area, representing the range of price action where 70% of trading took place. Understanding the Value Area can give traders valuable insight into market direction and establish the higher odds trade. It is an excellent addition to any system you may be using. Inspired by Jim Dalton’s book “Mind Over Markets”, this indicator is designed to suit the
ICT, SMC, Smart Money Concept, Suporte e Resistência, Análise de Tendências, Ação do Preço, Estrutura de Mercado, Blocos de Ordens, Blocos de Rompimento, Mudança de Momentum, Desbalanceamento Forte, HH/LL/HL/LH, Gap de Valor Justo, FVG, Zonas de Prêmio e Desconto, Retração de Fibonacci, OTE, Liquidez Compradora, Liquidez Vendedora, Vazios de Liquidez, Sessões de Mercado, NDOG, NWOG, Bala de Prata, modelo ICT. No mercado financeiro, uma análise de mercado precisa é crucial para os investidores
The Volume by Price Indicator for MetaTrader 5 features Volume Profile and Market Profile TPO (Time Price Opportunity). Volume and TPO histogram bar and line charts. Volume Footprint charts. TPO letter and block marker collapsed and split structure charts. Session filtering and grouping. Static, dynamic and flexible range segmentation and compositing methods with relative and absolute visualizations. Graphical layering, positioning and styling options to suit the user's analytic and aesthetic n
IX Power MT5
Daniel Stein
5 (3)
O   IX Power   traz finalmente a precisão imbatível do FX Power para símbolos não-Forex. Determina com exatidão a intensidade das tendências a curto, médio e longo prazo nos seus índices, acções, mercadorias, ETFs e até criptomoedas favoritos. Pode   analisar tudo o que   o seu terminal tem para oferecer. Experimente e veja como   o seu timing melhora significativamente   quando negoceia. Características principais do IX Power Resultados de cálculo 100% precisos e sem repintura - para tod
Filtro:
Sem comentários
Responder ao comentário
Versão 1.1 2024.06.12
Correção de erros de compilação
Declaração das variáveis IndicatorShortName e SetIndexLabel.
Correção do número de parâmetros da função iMACD.
Adição de linhas de tendência em preços e MACD
Implementação de linhas de tendência para conectar os últimos dois altos/baixos relevantes em preços e MACD.
Criação e gestão de linhas de tendência para preços e MACD.
Correção da lógica de sinalização
Adição de controles para a inclinação das linhas de tendência:
Sinal de COMPRA quando a linha de tendência dos mínimos em preços está diminuindo e a linha de tendência correspondente no MACD está aumentando.
Sinal de VENDA quando a linha de tendência dos máximos em preços está diminuindo e a linha de tendência correspondente no MACD está aumentando.
Sinal de VENDA quando a linha de tendência dos máximos em preços está aumentando e a linha de tendência correspondente no MACD está diminuindo.
Sinal de COMPRA quando a linha de tendência dos mínimos em preços está aumentando e a linha de tendência correspondente no MACD está diminuindo.
Sinal de VENDA quando a linha de tendência dos máximos em preços está aumentando e a linha de tendência correspondente no MACD está diminuindo.
Sinal de COMPRA quando a linha de tendência dos mínimos em preços está aumentando e a linha de tendência correspondente no MACD está diminuindo.
Adição da função OnDeinit para remover todas as linhas de tendência e comentários quando o indicador é removido do gráfico.