MACD Color Histogram for MT4
- Indicadores
- German David Nino Cifuentes
- Versão: 1.0
- Ativações: 5
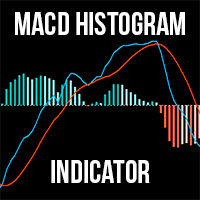
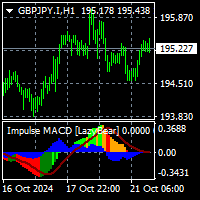
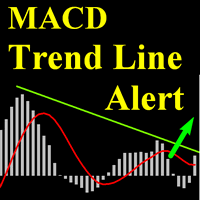
The MACD Histogram Indicator is an enhanced version of the traditional MACD indicator, offering superior insights into market trends and momentum shifts. Unlike the default MACD in MT4, this version features a histogram, making it easier for traders to visualize and interpret market conditions.
Advantages over the default MACD indicator:
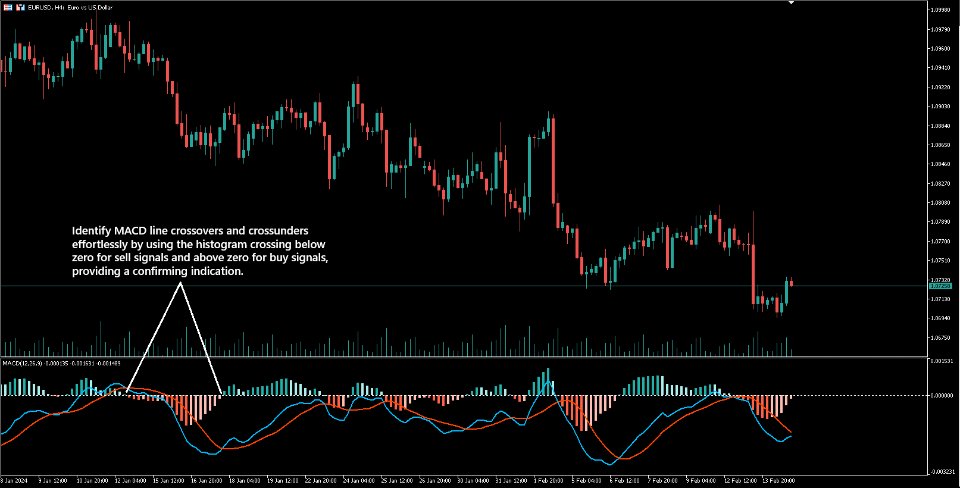
- Enhanced Visuals: The histogram provides a bar chart representation of the difference between the MACD line and the signal line, making it simpler to identify bullish and bearish trends.
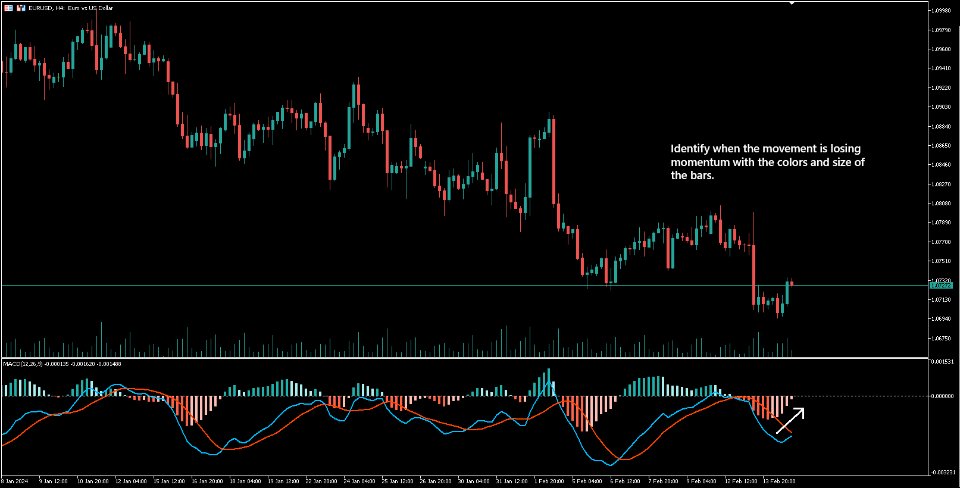
- Color-Coded Momentum Shifts: Bars change color with market momentum shifts—green for bullish and red for bearish—providing immediate visual cues for potential trend reversals.
- Customizable Display: Users can choose to hide the MACD line, signal line, or histogram based on their preferences, offering greater flexibility and customization.
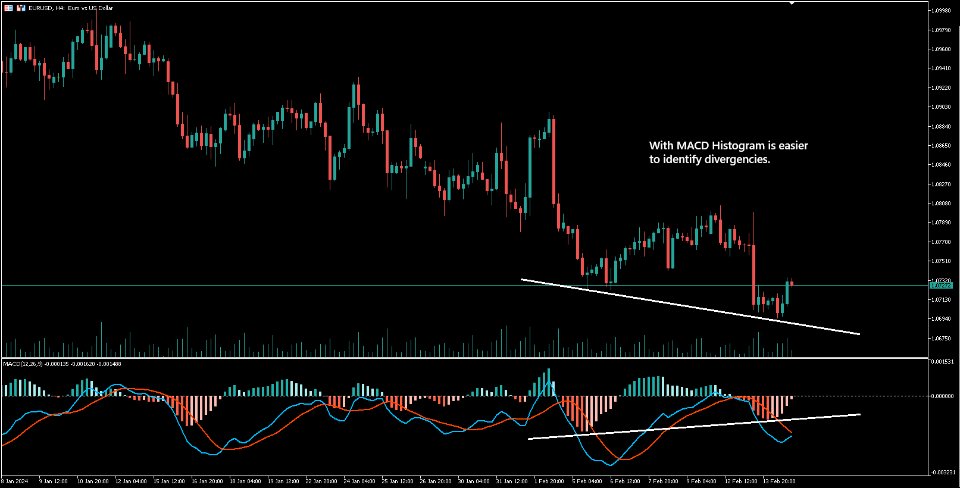
- Divergence Detection: The indicator highlights potential divergences between price movements and the MACD, signaling possible market reversals.
Inputs:
- Fast EMA Period
- Slow EMA Period
- Signal SMA Period
- Show MACD/Signal Lines
- Show Histogram
These inputs allow traders to tailor the indicator to their specific trading strategies and market conditions.
Why Choose the MACD Histogram Indicator?
- Intuitive and Easy to Use: Designed for both novice and experienced traders, this indicator simplifies the analysis of market trends with clear visual signals.
- Customizable: Adjust the settings to fit your trading style, whether you prefer detailed line analysis or clean, minimalistic charts.
- Powerful Insights: Quickly detect momentum shifts and potential reversals, enabling more informed and timely trading decisions.
Ready to elevate your trading strategy? Download the MACD Histogram Indicator today and gain a clearer, more actionable view of the markets!
