• Visão global
  • Comentários
  • Discussão

Multi Asset Monitor Panel

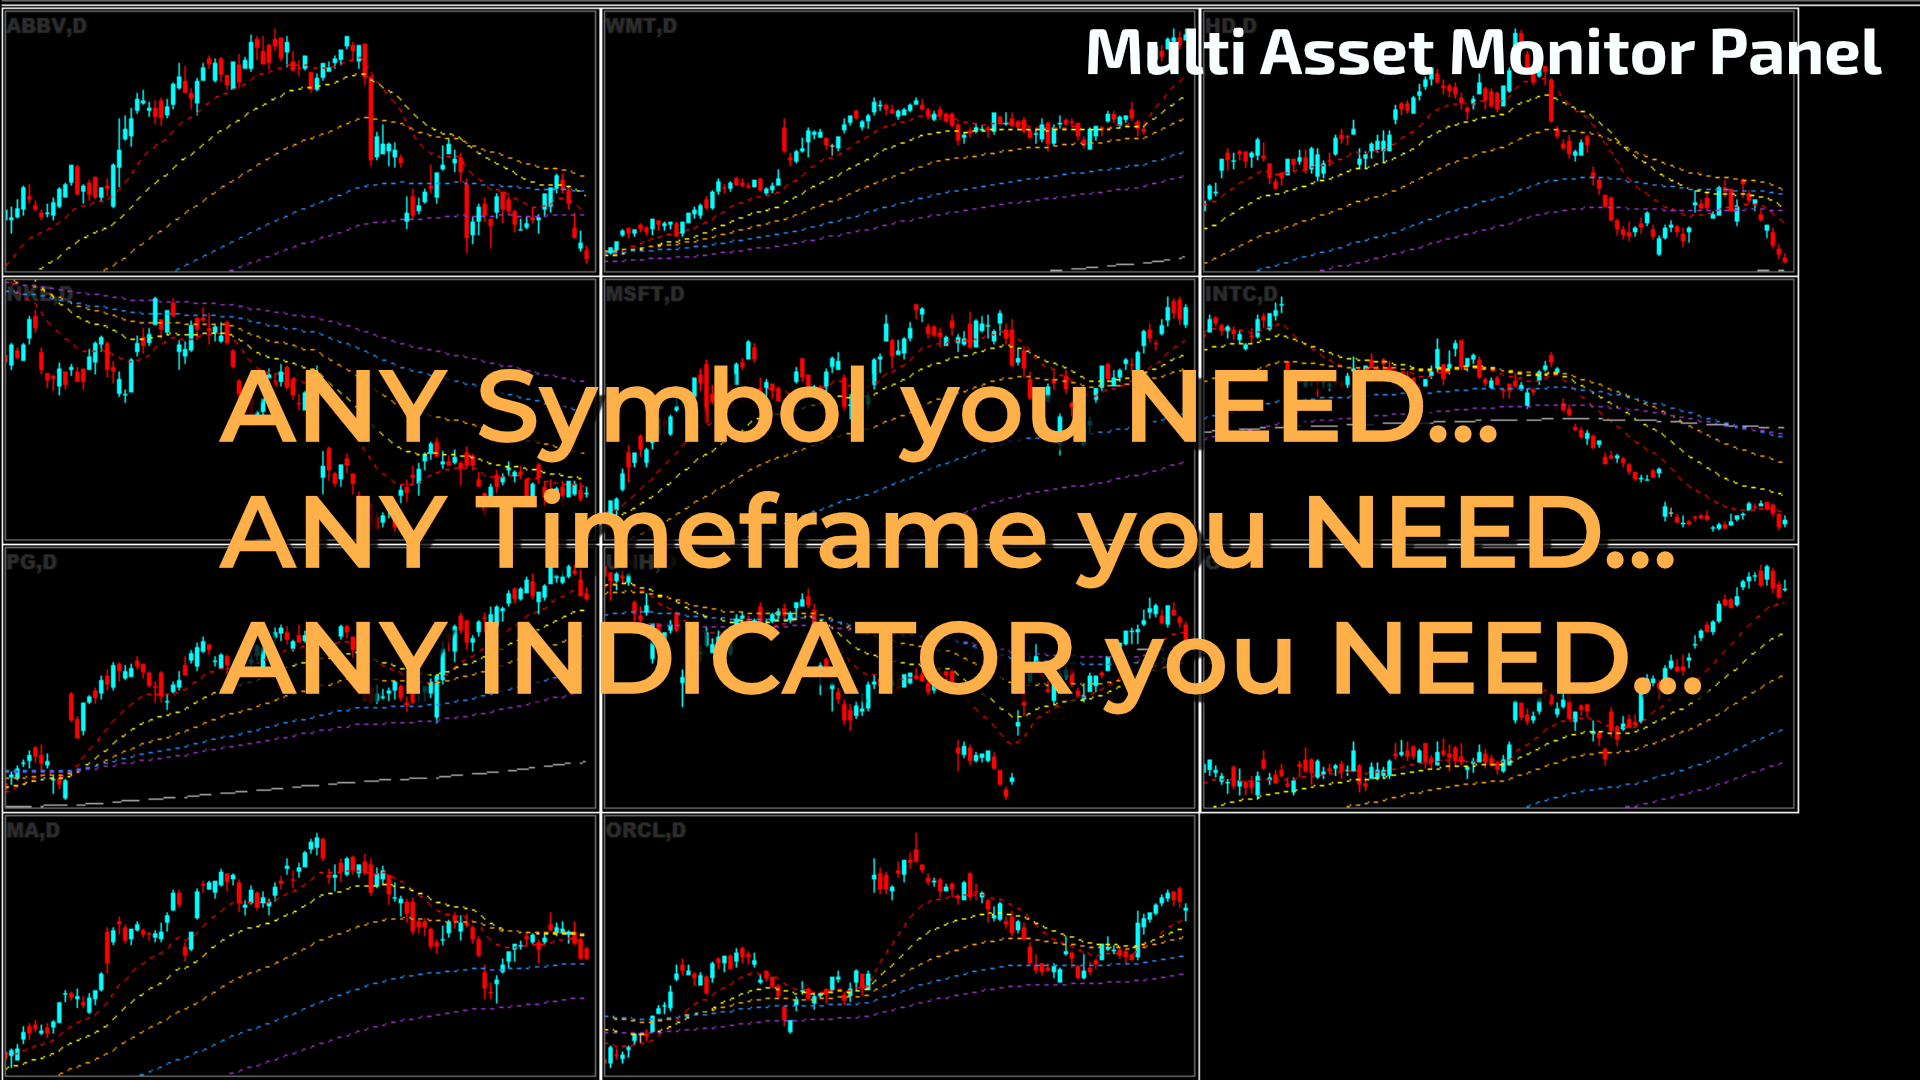
O Multi Asset Monitor Panel é uma ferramenta revolucionária para traders que precisam monitorar vários mercados simultaneamente. Este painel inovador permite que você acompanhe qualquer símbolo e qualquer timeframe de que precisar, tudo em uma única interface organizada. Com até três listas de símbolos e templates personalizáveis do MT5, você pode adaptar sua configuração de monitoramento para se ajustar à sua estratégia de negociação específica.

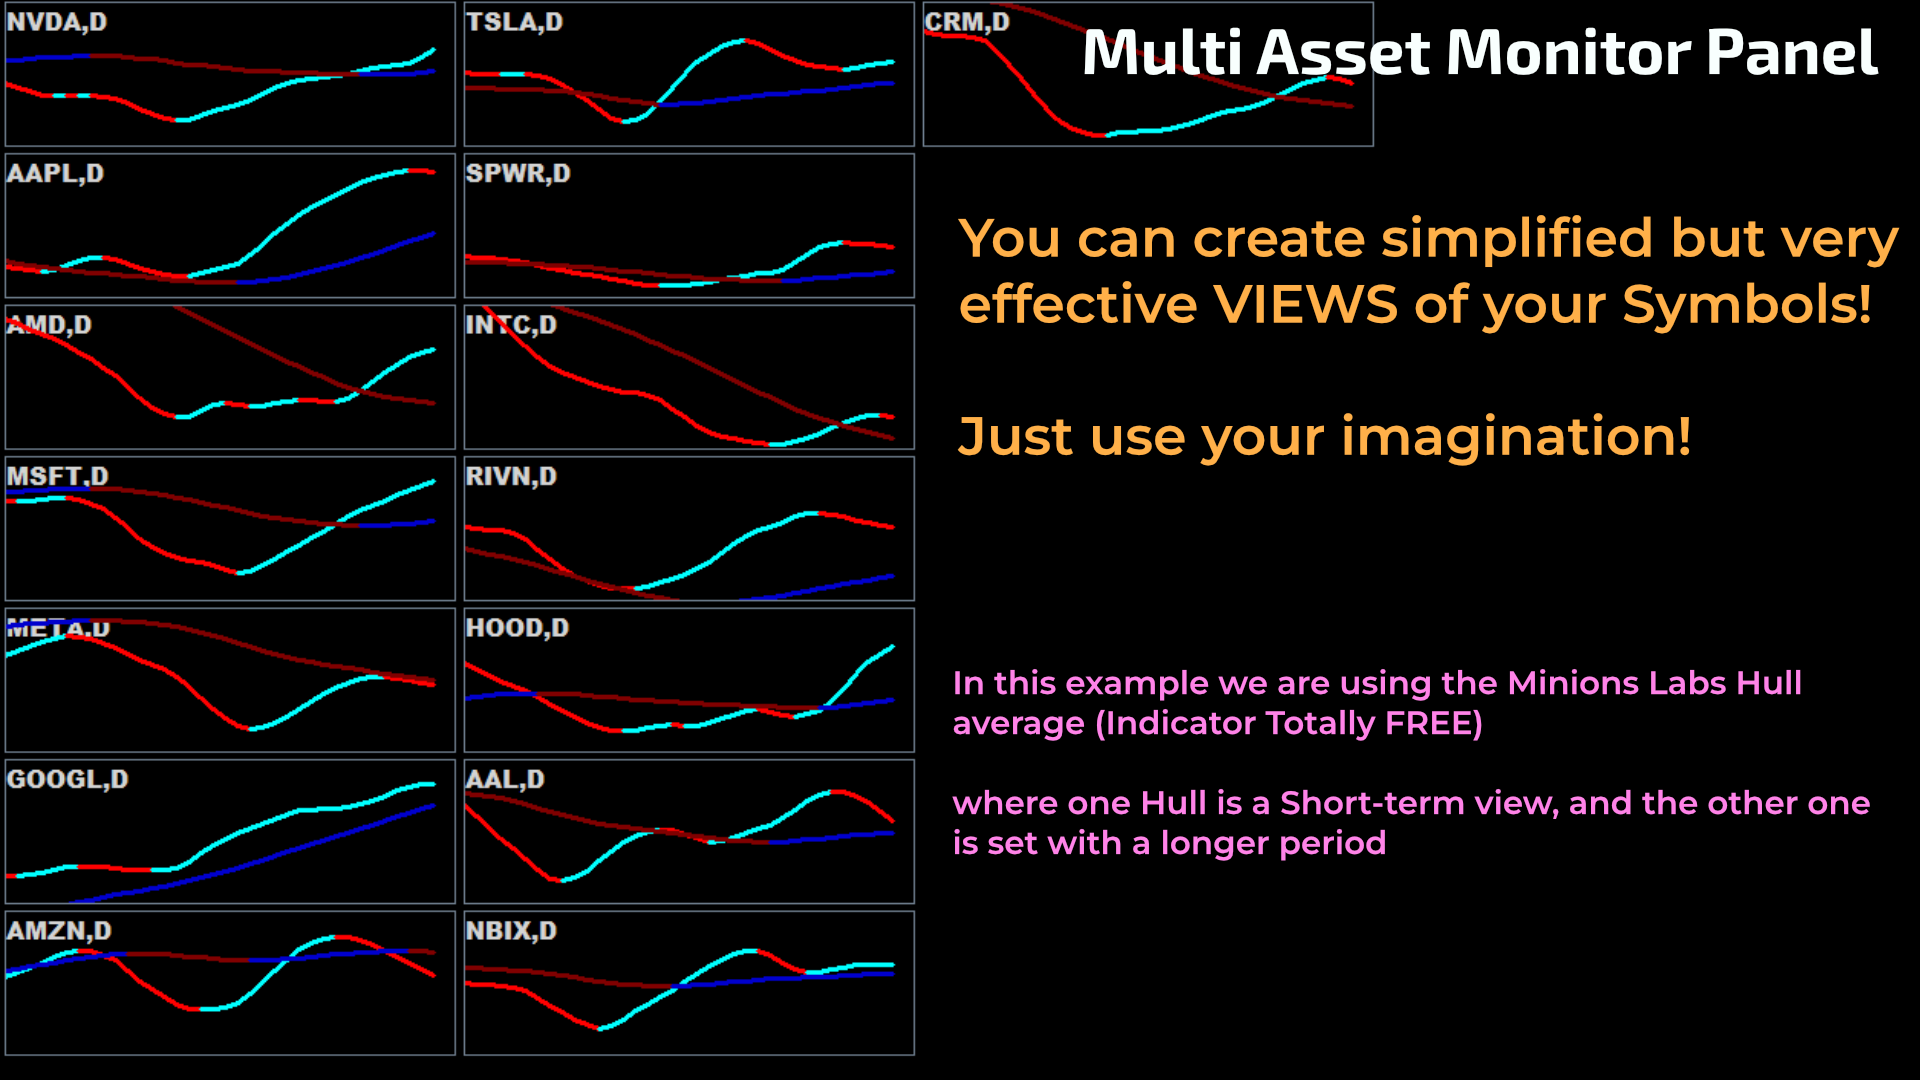
O que diferencia o Multi Asset Monitor Panel é sua flexibilidade e opções de personalização. Você pode controlar o tamanho e o layout dos mini gráficos, garantindo que seu espaço de trabalho seja o mais eficiente possível. Ao clicar duas vezes em qualquer mini gráfico, uma nova janela é aberta com o template escolhido, facilitando uma análise detalhada. Seja acompanhando ações, forex ou criptomoedas, este painel fornece uma visão abrangente dos movimentos do mercado em um piscar de olhos.


Por Que Devo Me Importar com o Multi Asset Monitor Panel?

O Multi Asset Monitor Panel oferece recursos exclusivos que são essenciais para qualquer trader sério. Sua capacidade de monitorar vários símbolos em diferentes timeframes simultaneamente significa que você pode identificar tendências e oportunidades de mercado à medida que elas acontecem. Este nível de percepção e capacidade de resposta é crucial em ambientes de negociação acelerados, onde cada segundo conta.

Além disso, os alertas personalizáveis e as visualizações claras do painel ajudam você a se manter no topo das mudanças importantes do mercado sem perder nada. O Multi Asset Monitor Panel não só melhora sua eficiência de negociação, mas também aprimora seu processo de tomada de decisões, fornecendo uma visão holística do mercado. É uma ferramenta indispensável para traders que desejam maximizar seus lucros e se manter à frente da concorrência.


Como Funciona o Multi Asset Monitor Panel?

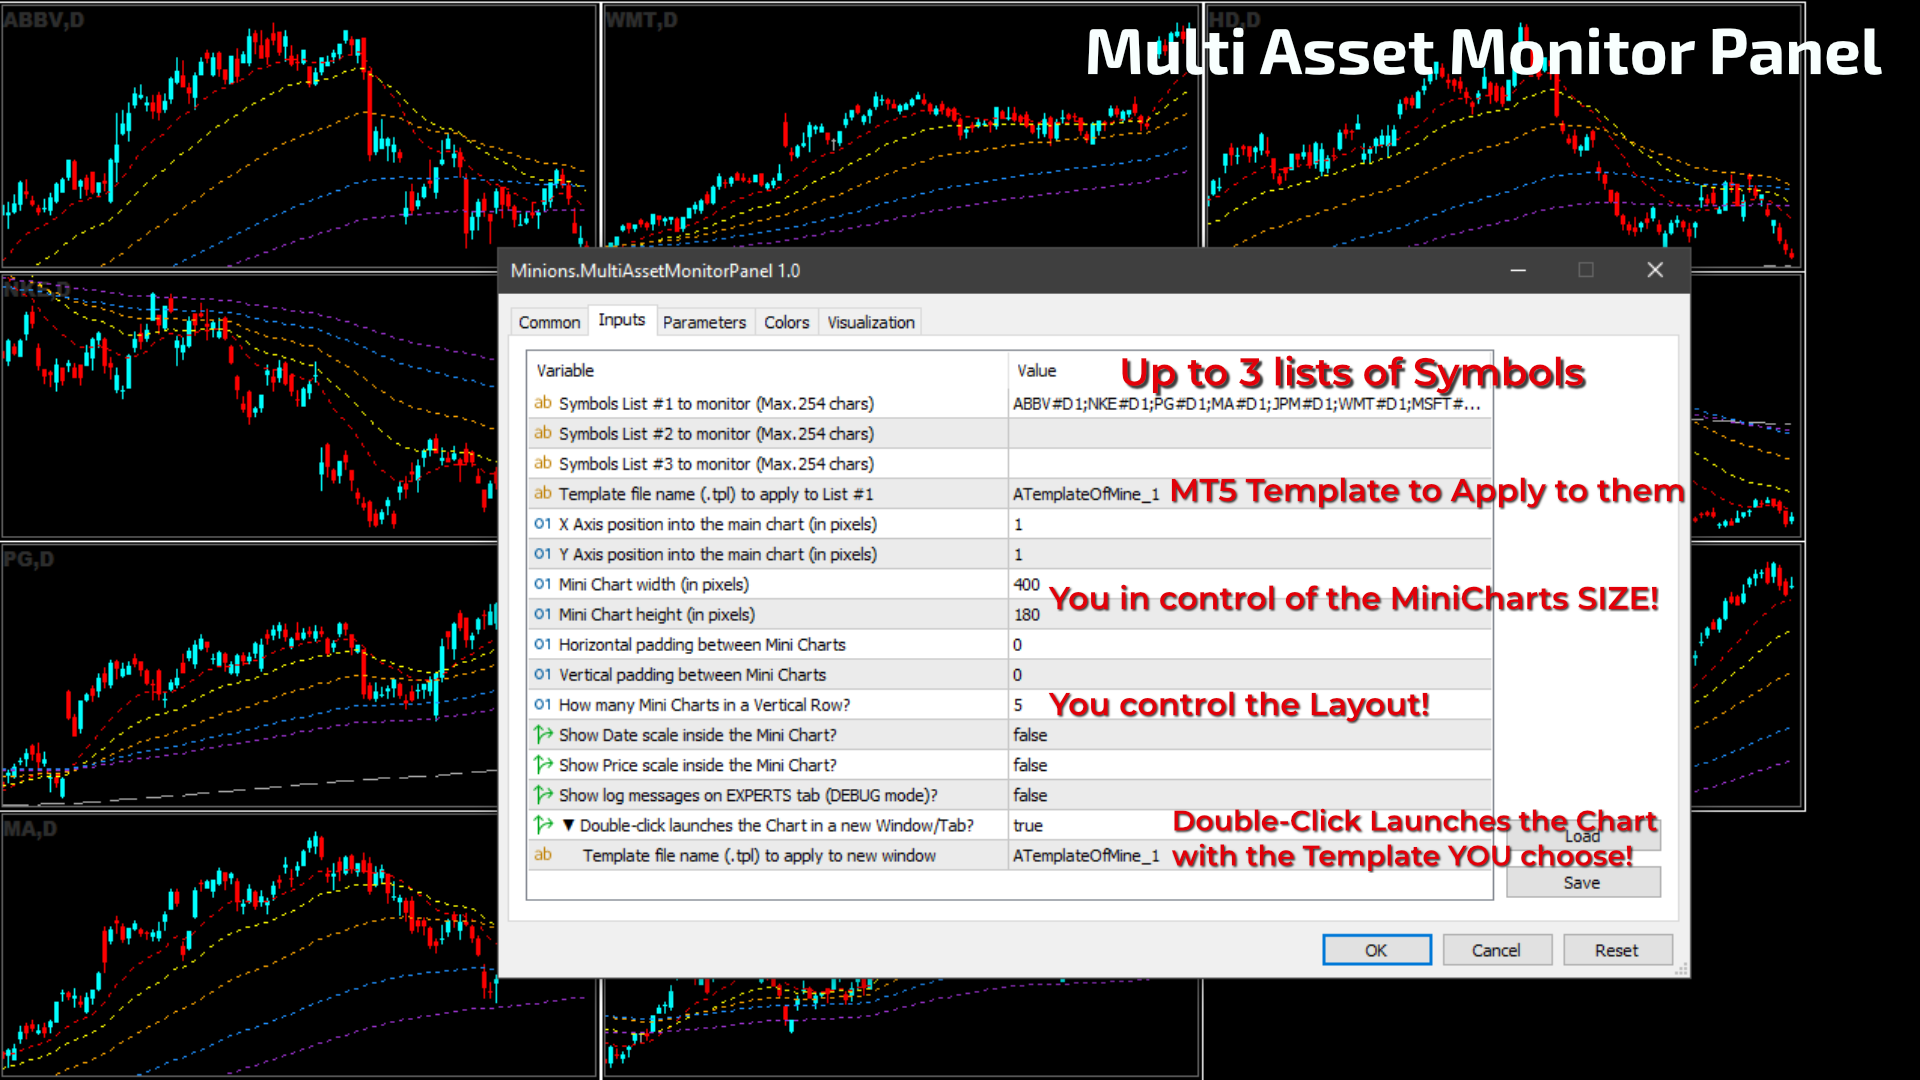
O Multi Asset Monitor Panel funciona permitindo que você configure até três listas de símbolos para monitorar. Cada lista pode ser personalizada com templates específicos do MT5, proporcionando visões personalizadas de cada símbolo. O painel exibe mini gráficos para cada símbolo, e você pode controlar seu tamanho, layout e as informações que eles exibem, como escalas de data e preço.

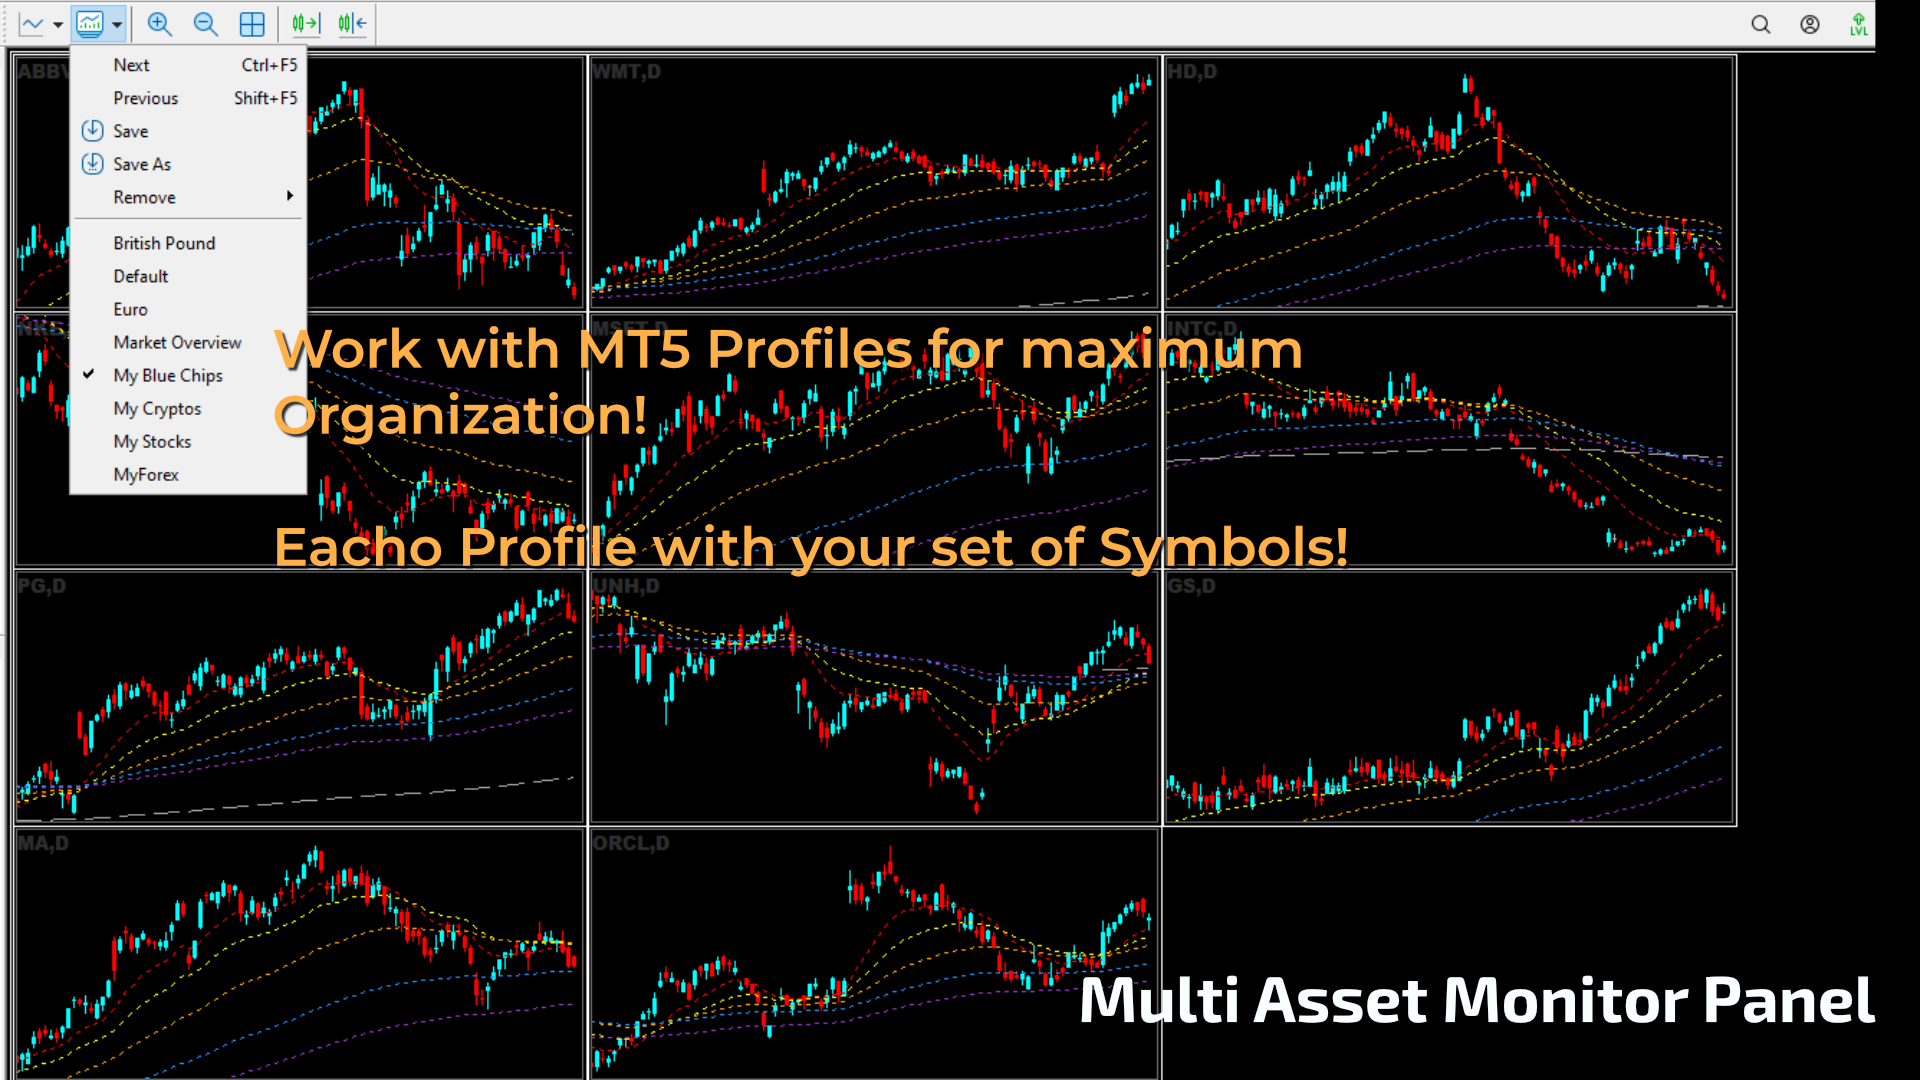
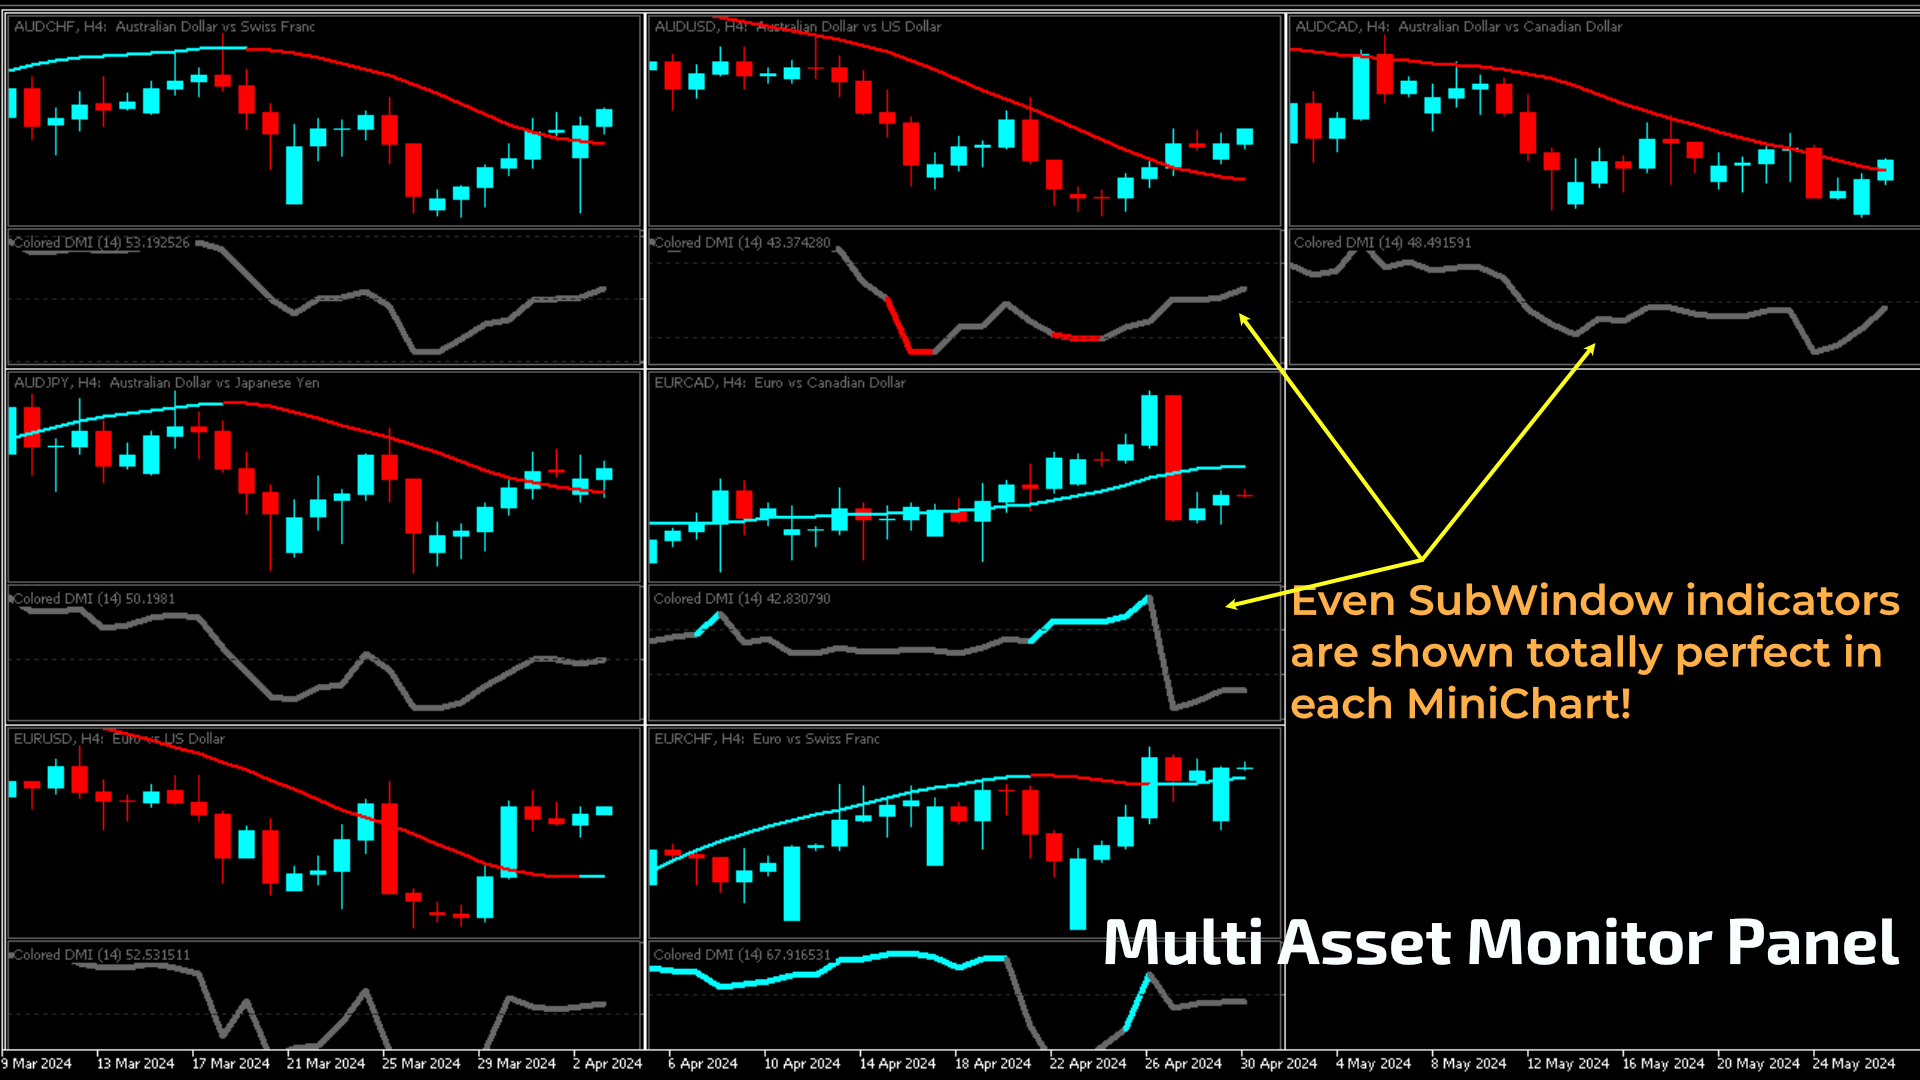
Com este painel, você pode organizar seu espaço de trabalho alinhando os mini gráficos em linhas e colunas, ajustando os espaçamentos e definindo o número de mini gráficos por linha. A integração com perfis do MT5 significa que você pode alternar rapidamente entre diferentes conjuntos de símbolos de forma eficiente. Este recurso é especialmente útil para traders que lidam com múltiplas classes de ativos. Além disso, indicadores de subjanela são totalmente suportados, garantindo que você tenha todas as informações necessárias à sua disposição.


Configurações

  • Lista de Símbolos #1 para monitorar (Máx. 254 caracteres)
  • Lista de Símbolos #2 para monitorar (Máx. 254 caracteres)
  • Lista de Símbolos #3 para monitorar (Máx. 254 caracteres)
  • Nome do arquivo de template (.tpl) para aplicar à Lista #1
  • Posição no eixo X no gráfico principal (em pixels)
  • Posição no eixo Y no gráfico principal (em pixels)
  • Largura do Mini Gráfico (em pixels)
  • Altura do Mini Gráfico (em pixels)
  • Espaçamento horizontal entre Mini Gráficos
  • Espaçamento vertical entre Mini Gráficos
  • Quantos Mini Gráficos em uma Linha Vertical?
  • Mostrar escala de data dentro do Mini Gráfico?
  • Mostrar escala de preço dentro do Mini Gráfico?
  • Mostrar mensagens de log na aba EXPERTS (modo DEBUG)?
  • Clique duplo lança o Gráfico em uma nova Janela/Aba?
    • Nome do arquivo de template (.tpl) para aplicar à nova janela

    Quer Experimentar Este Incrível Indicador de Graça?

    Explore nosso poderoso indicador sem nenhum custo! O MetaTrader 5 oferece duas maneiras de testá-lo: uma demo limitada para backtesting ou um teste completo através do nosso site, permitindo testes em contas reais. Confira este post no blog para descobrir todas as opções de teste e comece a negociar de forma mais inteligente hoje mesmo!


    Não Encontrou Uma Função Que Precisa?

    Nenhum produto é perfeito para todos. Se há uma função que você precisa e não encontrou, entre em contato conosco. Valorizamos seu feedback!


    Sobre Nós

    Flavio Jarabeck é o proprietário da MinionsLabs.com, dedicado a aprimorar as habilidades e o conhecimento de traders profissionais com robôs de negociação avançados e indicadores, permitindo que eles explorem novas estratégias em diversos mercados e ativos.


    Produtos recomendados
    ATTENTION: the utility cannot work in the Strategy Tester, if you want to try the demo version for free for a week, or have any questions, write me an email! You can find my address on my user profile. TrendLine Auto Executor is a software capable of identifying the trendlines you have drawn on the chart and opening orders as soon as they are touched or exceeded. The software allows you to manage two orders at a time for each chart by tracking two groups of trendlines, one for each order, and
    Market Sessions Time PRO
    Juan Facundo Valdes
    5 (2)
    Exibir no gráfico até 7 sessões de mercado e 3 intervalos semanais, totalmente personalizáveis Cada sessão e intervalo pode ser exibido ou ocultado e adaptado para se ajustar a períodos especiais intradia ou intrassemana de acordo com as necessidades de cada trader Defina os horários de início/fim das sessões usando qualquer um destes métodos: Hora GMT/UTC (ajustável para qualquer fuso horário) Hora do servidor/corretora (hora do gráfico) Hora local (hora do seu computador) Recursos da versão
    Gartley Hunter Multi
    Siarhei Vashchylka
    5 (7)
    Gartley Hunter Multi - An indicator for searching for harmonic patterns simultaneously on dozens of trading instruments and on all possible timeframes. Manual (Be sure to read before purchasing) | Version for MT4 Advantages 1. Patterns: Gartley, Butterfly, Shark, Crab. Bat, Alternate Bat, Deep Crab, Cypher 2. Simultaneous search for patterns on dozens of trading instruments and on all possible timeframes 3. Search for patterns of all possible sizes. From the smallest to the largest 4. A
    Indicadores de horário no mercado Forex, incluindo Sydney, Tóquio, Londres, Nova York 4 horários de mercado Considerando a troca de horário de verão do servidor e a troca de horário de verão em cada mercado input ENUM_DST_ZONE InpServerDSTChangeRule = DST_ZONE_US; // Regras de troca de horário de verão no servidor De acordo com Nova York ou Europa input int InpBackDays = 100; // máximo de dias de sorteio, por razões de desempenho input bool InpShowTextLabel = true; // exibe rótulo de text
    Save your time . Select area and the trend line will draw automatically . Draw a support and resistance line for the selected range with two mouse clicks .  If you need to, you can also draw a line for support and resistance based on separate areas. The resistance trend line is drawn based on the first and last highs inside the selected area; The support trend line is drawn based on first and last lows inside the selected area;
    KT Average Daily Range MT5
    KEENBASE SOFTWARE SOLUTIONS
    KT Average Daily Range(ADR) shows the upper and lower levels using the average daily range covered by the currency pair or the instrument. The average daily range is calculated using the chosen period in the input settings. ADR High:  ADR upper level is found by adding the average daily range value to the current day's low. ADR Low:  ADR lower level is found by subtracting the ADR value from the current day's high. Features It shows the ADR levels with several other helpful information bene
    The indicator detects and displays М. Gartley's Butterfly pattern. The pattern is plotted by the extreme values of the ZigZag indicator (included in the resources, no need to install). After detecting the pattern, the indicator notifies of that by the pop-up window, a mobile notification and an email. The pattern and wave parameters are displayed on the screenshots. The default parameters are used for demonstration purposes only in order to increase the amount of detected patterns. Parameters
    LT Rainbow Trend
    Thiago Duarte
    5 (1)
    Você, assim como eu, gosta de operar a favor da tendência? Então este indicador vai te ajudar! Rainbow Trend é um indicador de tendência, no qual utiliza várias Médias Móveis junto do gráfico. Ela mede diferentes zonas de força da tendência para diferentes prazos: muito curto, curto, médio, longo e muito longo. Cada zona tem sua cor, e é possível ter alertas sonoros quando o preço sai de uma zona e entra em outra. Sua configuração é muito simples. Se encontrou alguma falha ou tem alguma suges
    Quarterly Cycles
    Barend Paul Stander
    Quarterly Cycles Quarterly Cycles is based on the Quarterly Theory developed by Daye (  traderdaye on X ). This is an aid to the user to find Cycles and it is NOT automatic detected, user can select AMDX or XAMD  in each Cycle and it will be visually drawn on the chart.  Quarterly Cycles:   Yearly, Monthly, Weekly, Daily, 6 Hour (90 minutes) –  Yearly Cycle : The year is divided in four sections of three months each Q1 - January, February, March Q2 - April, May, June Q3 - July, August, Sept
    O indicador cria cotações atuais, que podem ser comparadas com as históricas e, com base nisso, fazer uma previsão do movimento dos preços. O indicador possui um campo de texto para navegação rápida até a data desejada. Opções: Símbolo - seleção do símbolo que o indicador exibirá; SymbolPeriod - seleção do período do qual o indicador coletará dados; IndicatorColor - cor do indicador; HorisontalShift - deslocamento das cotações desenhadas pelo indicador pelo número especificado de
    Awesome Oscillator by Bill Williams with the ability to fine-tune and replace the averaging algorithms of the indicator, which significantly expands the possibilities of using this oscillator in algorithmic trading and brings it closer in its properties to such an indicator as the MACD. To reduce price noise, the final indicator is processed with an additional Smooth averaging. The indicator has the ability to give alerts, send mail messages and push signals when the direction of movement of th
    Rainbow EA MT5
    Jamal El Alama
    Description : Rainbow EA MT5 is a simple Expert advisor based on   Rainbow MT5 indicator witch is based on Moving average with period 34. The indicator is incorporated in the EA, therefore, it is not required for the EA to operate, but if you wish, you can download it from   my product page . The Expert Advisor settings are as follows : Suitable for Timeframes up to H1 The parameters below can be set according to your trading rules. StopLoss ( Stop Loss in pips) TakeProfit ( Take Profit in pi
    一 運作方式(如下圖) 在一個單邊向上的行情中,   自動交易工具做以下動作: 當價格來到高點,等待突破訊號在進場。 當價格回調,等待回調結束要往上時在進場。 當進場下單後, 如果一直漲就持續持單,等待價格漲不上去準備下來時,在獲利離場。 但如果一直跌,就等待要上漲時在進場,進場時加倍下單,    一個做底單,動作同上等待獲利離場,    另一個單用做倉位修正,此單和第一張單在盈虧為0時會各自平倉,不造成損失。 Ps: 在一個單邊向下的行情中,動作則相反  二 設定方法(如下圖) Step1   一開始要自己指定工具的方向. 如果認為會往上走,設定i_tradeup=true, i_tradedown=false,  如果認為會往下走,設定i_tradeup=false, i_tradedown=true,   Step2   指定目標位置和止損位置 如果認為會往上走,i_top輸入目標位置,i_bottom輸入止損位置 如果認為會往下走,i_top輸入止損位置,i_bottom輸入止盈位置 當價格到達目標位置會強制平倉獲利並暫停工具運作
    FREE
    Tick StdDev
    Andrej Nikitin
    The Standard Deviation (StdDev) indicator drawn using a tick chart. After launching it, wait for enough ticks to come. Parameters: Period - period of averaging. Method - method of averaging. calculated bar - number of bars for the indicator calculation.
    This tool is used to generate a K - line reflection chart of a currency pair for foreign exchange transactions. For example, if the currency pair is EURUSD, a custom currency pair named EURUSD_ref is generated and a chart for that currency pair is opened. The price of a custom pair of currency is the inverse of the price of the original pair, which is the equivalent of a new pair of currency, the USDEUR. The usage is simple, put it on any chart, the new chart will open, and then draw the co
    ChartColorMT5
    Thomas Pierre Maurice Moine
    Customize your charts with this simple utility. Choose in the 24 pre-built color sets, or use your own colors, save them to re-use them later. You can also add a text label on your chart. --- Chart Colors-- Color Set : 24 prebuilt color sets (select "Custom" to use colors below) Background color Foreground color Grid color Chart Up color Chart Down color Candle Bull color Candle Bear color  Line color Volumes color --- Label--- Text Label : Type the text you want to appear on the chart Label
    TendecialCX
    Yojhan Estiven Villalba Suarez
    Ayuda a interpretar la tendencia del precio de mercado de acuerdo a las mediciones en tiempo real, ideal para reforzar los resultados mostrados por el RSI  las bandas de Bollinguer. Recuerde que el mercado de instrumentos financieros es altamente volatil, no opere con dinero que ponga en riesgo su estabilidad financiera. Solo use fondos que este dispuesto a perder. Resultados pasados no garantizan resultados futuros. Mantenga Siempre control sobre el riesgo.
    Price Action Trade Panel EA MT5
    Juvenille Emperor Limited
    5 (4)
    O   Price Action Trade Panel MT5   calcula o equilíbrio do nível de força de compra / venda de qualquer símbolo / instrumento, com base em dados puros de ação de preço das velas anteriores especificadas (8 por padrão). Isso lhe dará o sentimento de mercado mais próximo possível, monitorando a ação do preço de 32 símbolos / instrumentos que estão disponíveis no painel do indicador. Um nível de força de compra / venda acima de 60% dá um nível bastante sólido para comprar / vender o símbolo especí
    Indicator basic idea is buy strong currency and sell weak currency. If A/B currency pair is in an uptrend, it shows if it is due to A strength or B weakness.On these signals one can choose the most optimal pair to trade. You can use Currency Power  System for pattern trading as well, among basic patterns which can be used are: cross trend break divergencies So much for theory.  I searched for a ready-made indicator (Currency Strength) to support my trade but did not find one. Well. I have to wr
    O Captador de Tendências: A Estratégia do Captador de Tendências com Indicador de Alerta é uma ferramenta versátil de análise técnica que auxilia os traders na identificação de tendências de mercado e potenciais pontos de entrada e saída. Apresenta uma Estratégia dinâmica do Captador de Tendências, adaptando-se às condições do mercado para uma representação visual clara da direção da tendência. Os traders podem personalizar os parâmetros de acordo com suas preferências e tolerância ao risco.
    FREE
    Auto SL and TP is a program that adds StopLoss and TakeProfit automatically, so you don't need to worry about it anymore. The program checks at any time if StopLoss and TakeProfit are set correctly!!! You can enter your values via the input parameter. Input-Settings StopLoss: Boolean value, if set to true, will be executed. StopLoss in Points TakeProfit: Boolean value, if set to true, will be executed. TakeProfit in Points
    This is a multi-symbol and multi-timeframe table-based indicator designed for a candlestick patterns detection with 46 patterns for META TRADER 5. Each formation has own image for easier recognition. Here you find most popular formations such as "Engulfing", "Hammer", "Three Line Strike", "Piercing" or Doji - like candles. Check my full list of patterns on my screenshots below. Also you can not only switch all bearish or bullish patterns from input, but also select formation for a specified symb
    This tool will help you calculate position size based on the lines that you draw on the chart. It will automatically create the trading setup in the background and provide adaptive buttons for market and pending order confirmation. The design is very simple and straightforward, with just a single click you will be able to place the trading setup. Features Set your risk based on your predefined amount or percent of your account balance. Drag the lines to define the entry, take profit target and s
    The utility is designed to save funds on your trading account. There is support for three levels of minimum equity and free margin. For each level, you can set partial (by a certain percentage) or complete closing of all market orders. The partial close percentage is applied for each order separately based on its current size (i.e. the size at the time the equity or free margin reaches the appropriate level). Upon reaching the last third level, the utility can close all charts, which will make i
    Orders Executor
    Claudio Aguiar De Aragao
    Apresentando       Orders Executor , seu companheiro de negociação poderoso e eficiente, projetado para executar ordens diretamente de um arquivo texto especificado pelo usuário. Esta ferramenta de negociação inovadora agiliza o seu processo de negociação, fornecendo uma solução conveniente e automatizada para executar negociações com precisão e velocidade. Características principais   : **Integração de arquivo de texto:** Orders Executor       foi projetado para ler e interpretar facilment
    BPS Break of Structure MT5
    Barend Paul Stander
    5 (1)
    BPS BoS - Break of Structure BoS - Fractal mode , MTF BoS - Zigzag mode , MTF Show HH and LL Alerts - Popup , Push notification and eMail Option to create screenshot on alert Enable / Disable Indicator with a button on chart to select options Choose corner of button location It is not a system but a indicator to help identify break of structure points MT 4 Version : https://www.mql5.com/en/market/product/78420?source=Site+Profile+Seller Other Indicators : https://www.mql5.com/en/use
    Welcome to the Ultimate Harmonic Patterns recognition indicator that is focused to detect advanced patterns. The Gartley pattern, Bat pattern, and Cypher pattern  are popular technical analysis tools used by traders to identify potential reversal points in the market. Our Ultimate Harmonic Patterns recognition Indicator is a powerful tool that uses advanced algorithms to scan the markets and identify these patterns in real-time. With our Ultimate Harmonic Patterns recognition Indicator, you
    It is super imporant to know what the spread is on your charts! This indicator displays the Ask High of the past bars, similar to that of the backtester. This allows you to see the spread of bars in real time. The spread of the bar is the ask-bid price. The spread of a bar is the minimum spread of any ticks found within that bar. I hope this makes sense. If you have any questions or feedback, let me know - thank you. 
    O nível Premium é um indicador único com mais de 80% de precisão nas previsões corretas! Este indicador foi testado pelos melhores Especialistas em Negociação por mais de dois meses! O indicador do autor você não encontrará em nenhum outro lugar! A partir das imagens você pode ver por si mesmo a precisão desta ferramenta! 1 é ótimo para negociar opções binárias com um tempo de expiração de 1 vela. 2 funciona em todos os pares de moedas, ações, commodities, criptomoedas Instruções:
    PnL Calendar
    Keni Chetankumar Gajanan -
    Monitoring your trades over time helps you build up your account balance and shows when you miss your goals. Viewing the closed trades of a symbol on the chart can help you adjust your strategy for better results. Maintaining a trade book allows you to record the applied strategy and note the reason for taking each trade. It helps you to evaluate and refine strategies based on its profitability. A possibility to download the Account history as a text file with delimited fields, allows upload to
    Os compradores deste produto também adquirem
    Atomic Analyst MT5
    Issam Kassas
    5 (14)
    Primeiramente, vale ressaltar que este Indicador de Negociação não repinta, não redesenha e não apresenta atrasos, tornando-o ideal tanto para negociação manual quanto automatizada. Manual do utilizador: configurações, entradas e estratégia. O Analista Atômico é um Indicador de Ação de Preço PA que utiliza a força e o momentum do preço para encontrar uma vantagem melhor no mercado. Equipado com filtros avançados que ajudam a remover ruídos e sinais falsos, e aumentam o potencial de negociação.
    Primeiramente, vale ressaltar que este Sistema de Trading é um Indicador Não Repintado, Não Redesenho e Não Atrasado, o que o torna ideal tanto para o trading manual quanto para o automatizado. Curso online, manual e download de predefinições. O "Sistema de Trading Inteligente MT5" é uma solução completa de trading projetada para traders novos e experientes. Ele combina mais de 10 indicadores premium e apresenta mais de 7 estratégias de trading robustas, tornando-o uma escolha versátil para dive
    Quantum Trend Sniper
    Bogdan Ion Puscasu
    5 (43)
    Apresentando       Quantum Trend Sniper Indicator   , o inovador Indicador MQL5 que está transformando a maneira como você identifica e negocia as reversões de tendência! Desenvolvido por uma equipe de traders experientes com experiência comercial de mais de 13 anos,       Indicador de Atirador de Tendência Quântica       foi projetado para impulsionar sua jornada de negociação a novos patamares com sua forma inovadora de identificar reversões de tendência com precisão extremamente alta. ***C
    Gold Stuff mt5
    Vasiliy Strukov
    4.89 (178)
    Gold Stuff mt5-um indicador de tendência projetado especificamente para o ouro, também pode ser usado em qualquer instrumento financeiro. O indicador não é redesenhado ou atrasado. O timeframe recomendado é H1. Importante! Entre em contato comigo imediatamente após a compra para obter instruções e bônus!  Você pode obter uma cópia gratuita do nosso indicador Strong Support e Trend Scanner, envie uma mensagem privada. a mim! PARÂMETRO Draw Arrow-incl.desligado. desenhar setas no gráfico. A
    Reversal First Impulse levels (RFI)      INSTRUCTIONS        RUS       -       ENG              R ecommended to use with an indicator   -   TREND PRO -  Version MT4                 A key element in trading is zones or levels from which decisions to buy or sell a trading instrument are made. Despite attempts by major players to conceal their presence in the market, they inevitably leave traces. Our task was to learn how to identify these traces and interpret them correctly. Main functions:: Di
    Antes de tudo, vale ressaltar que esta Ferramenta de Negociação é um Indicador Não Repintante, Não Redesenhante e Não Atrasado, o que a torna ideal para negociação profissional. Curso online, manual do utilizador e demonstração. O Indicador de Conceitos de Ação de Preço Inteligente é uma ferramenta muito poderosa tanto para traders novos quanto experientes. Ele combina mais de 20 indicadores úteis em um único, combinando ideias avançadas de negociação como Análise do Trader do Círculo Intern
    FX Volume MT5
    Daniel Stein
    4.94 (17)
    Receba a sua atualização diária do mercado com detalhes e screenshots através do nosso Morning Briefing aqui no mql5 e no Telegram ! O Volume FX é o PRIMEIRO e ÚNICO indicador de volume que fornece uma visão REAL do sentimento do mercado do ponto de vista de um corretor. Ele fornece uma visão incrível de como os participantes do mercado institucional, como corretores, estão posicionados no mercado Forex, muito mais rápido do que os relatórios COT. Ver essas informações diretamente no seu gráfi
    Trend Screener Pro MT5
    STE S.S.COMPANY
    4.88 (64)
    Desbloqueie o poder da negociação de tendências com o indicador Trend Screener: sua solução definitiva de negociação de tendências, alimentada por lógica difusa e sistema de múltiplas moedas! Eleve sua negociação de tendências com o Trend Screener, o revolucionário indicador de tendências alimentado por lógica difusa. É um poderoso indicador de acompanhamento de tendências que combina mais de 13 ferramentas e recursos premium e 3 estratégias de negociação, tornando-o uma escolha versátil para to
    FX Power MT5 NG
    Daniel Stein
    5 (5)
    Receba a sua atualização diária do mercado com detalhes e screenshots através do nosso Morning Briefing aqui no mql5 e no Telegram ! O FX Power MT5 NG é a próxima geração do nosso medidor de força de moeda muito popular de longa data, o FX Power. E o que é que este medidor de força da próxima geração oferece? Tudo o que adorou no FX Power original MAIS Análise de força GOLD/XAU Resultados de cálculo ainda mais precisos Períodos de análise configuráveis individualmente Limite de cálculo personal
    Bill Williams Advanced
    Siarhei Vashchylka
    5 (5)
    Bill Williams Advanced is designed for automatic chart analysis using Bill Williams' "Profitunity" system. The indicator analyzes four timeframes at once. Manual (Be sure to read before purchasing) Advantages 1. Automatically analyzes the chart using the "Profitunity" system of Bill Williams. The found signals are placed in a table in the corner of the screen. 2. Equipped with a trend filter based on the Alligator indicator. Most of the system signals are recommended to be used only accordi
    XQ Indicator MetaTrader 5
    Marzena Maria Szmit
    5 (1)
    Step into the realm of Forex trading with confidence and precision using XQ, a cutting-edge Forex indicator designed to elevate your trading game to unprecedented heights. Whether you're a seasoned trader or just stepping into the world of currency exchange, XQ Forex Indicator empowers you with the insights and signals needed to make informed trading decisions. The signal conditions are a combination of three indicators, and XQ Forex Indicator only display  medium and long-term trends . The ind
    Este é um indicador para MT5 que fornece sinais precisos para entrar em uma negociação sem redesenhar. Ele pode ser aplicado a qualquer ativo financeiro: forex, criptomoedas, metais, ações, índices. Ele fornecerá estimativas bastante precisas e informará quando é melhor abrir e fechar um negócio. Assista o vídeo (6:22) com um exemplo de processamento de apenas um sinal que compensou o indicador! A maioria dos traders melhora seus resultados de negociação durante a primeira semana de negociação c
    AW Trend Predictor MT5
    AW Trading Software Limited
    4.78 (58)
    A combinação de níveis de tendência e quebra em um sistema. Um algoritmo de indicador avançado filtra o ruído do mercado, determina a tendência, os pontos de entrada e os possíveis níveis de saída. Os sinais indicadores são registrados em um módulo estatístico, que permite selecionar as ferramentas mais adequadas, mostrando a eficácia do histórico do sinal. O indicador calcula as marcas Take Profit e Stop Loss. Manual e instruções ->   AQUI   / versão MT4 ->   AQUI Como negociar com o indicador
    ICT, SMC, SMART MONEY CONCEPTS, SMART MONEY, Smart Money Concept, Support and Resistance, Trend Analysis, Price Action, Market Structure, Order Blocks, BOS/CHoCH,   Breaker Blocks ,  Momentum Shift,   Supply&Demand Zone/Order Blocks , Strong Imbalance,   HH/LL/HL/LH,    Fair Value Gap, FVG,  Premium  &   Discount   Zones, Fibonacci Retracement, OTE, Buy Side Liquidity, Sell Side Liquidity, BSL/SSL Taken, Equal Highs & Lows, MTF Dashboard, Multiple Time Frame, BigBar, HTF OB, HTF Market Structure
    TrendMaestro5
    Stefano Frisetti
    note: this indicator is for METATRADER4, if you want the version for METATRADER5 this is the link:  https://www.mql5.com/it/market/product/108106 TRENDMAESTRO ver 2.4 TRENDMAESTRO recognizes a new TREND in the bud, he never makes mistakes. The certainty of identifying a new TREND is priceless. DESCRIPTION TRENDMAESTRO identifies a new TREND in the bud, this indicator examines the volatility, volumes and momentum to identify the moment in which there is an explosion of one or more of these data a
    TPSproTREND PrO MT5
    Roman Podpora
    4.88 (8)
    TPSpro TRENDPRO  - is a trend indicator that automatically analyzes the market and provides information about the trend and each of its changes, as well as giving signals for entering trades without redrawing! The indicator uses each candle, analyzing them separately. referring to different impulses - up or down impulse. Exact entry points into transactions for currencies, crypto, metals, stocks, indices!  -  Version MT4               DETAILED DESCRIPTION               R ecommended to use with
    Torne-se um Negociador Breaker e lucre com as mudanças na estrutura do mercado à medida que o preço reverte. O indicador de quebra de bloco de pedidos identifica quando uma tendência ou movimento de preço está chegando à exaustão e pronto para reverter. Ele o alerta sobre mudanças na estrutura do mercado, que normalmente ocorrem quando uma reversão ou uma grande retração está prestes a ocorrer. O indicador usa um cálculo proprietário que identifica rupturas e momento do preço. Toda vez que
    ** All Symbols x All Timeframes scan just by pressing scanner button ** ***Contact me after purchase to send you instructions and add you in "123 scanner group" for sharing or seeing experiences with other users. After 17 years of experience in the markets and programming, Winner indicator is ready. I would like to share with you! Introduction The 123 Pattern Scanner indicator with a special enhanced algorithm is a very repetitive common pattern finder with a high success rate . Interestingly,
    Apresentando       Quantum Breakout PRO   , o inovador Indicador MQL5 que está transformando a maneira como você negocia Breakout Zones! Desenvolvido por uma equipe de traders experientes com experiência comercial de mais de 13 anos,       Quantum Breakout PRO       foi projetado para impulsionar sua jornada comercial a novos patamares com sua estratégia de zona de fuga inovadora e dinâmica. O Quantum Breakout Indicator lhe dará setas de sinal em zonas de breakout com 5 zonas-alvo de lucro e
    Quantum Heiken Ashi PRO MT5
    Bogdan Ion Puscasu
    4.5 (8)
    Apresentando o   Quantum Heiken Ashi PRO Projetadas para fornecer informações claras sobre as tendências do mercado, as velas Heiken Ashi são conhecidas por sua capacidade de filtrar o ruído e eliminar sinais falsos. Diga adeus às confusas flutuações de preços e olá para uma representação gráfica mais suave e confiável. O que torna o Quantum Heiken Ashi PRO verdadeiramente único é sua fórmula inovadora, que transforma os dados tradicionais de velas em barras coloridas fáceis de ler. As barras ve
    Golden Gate Algo MT5
    James David Lane
    4 (6)
    40% DE DESCONTO PARA O NATAL! AUMENTO DE PREÇO PARA $250 EM 1º DE JANEIRO! Apresentando GoldenGate Entries: Uma Solução de Negociação de Ponta! Descubra uma abordagem revolucionária para a negociação com o GoldenGate Entries (GGE), um indicador avançado projetado para elevar sua experiência de negociação. O GGE oferece um conjunto abrangente de recursos para capacitar os usuários com precisão e confiança em suas decisões de negociação. Pares: Qualquer (FX - Commodities - Equities - Ações
    TPA True Price Action indicator reveals the true price action of the market makers through 100% non-repainting signals strictly at the close of a candle! TPA shows entries and re-entries, every time the bulls are definitely stronger than the bears and vice versa. Not to confuse with red/green candles. The shift of power gets confirmed at the earliest stage and is ONE exit strategy of several. There are available now two free parts of the TPA User Guide for our customers. The first "The Basics"
    Advanced Supply Demand MT5
    Bernhard Schweigert
    4.53 (15)
    Atualmente com 33% de desconto! A melhor solução para qualquer Trader Novato ou especialista! Este indicador é uma ferramenta de negociação exclusiva, de alta qualidade e acessível porque incorporamos uma série de recursos proprietários e uma nova fórmula. Com esta atualização, você poderá mostrar fusos horários duplos. Você não só será capaz de mostrar um TF mais alto, mas também mostrar ambos, o TF do gráfico, MAIS o TF mais alto: MOSTRANDO ZONAS ANINHADAS. Todos os traders de Oferta e Demanda
    Easy By Sell is a market indicator for opening and closing positions. It becomes easy to track market entries with alerts. It indicates trend reversal points when a price reaches extreme values ​​and the most favorable time to enter the market. it is as effective as a Fibonacci to find a level but it uses different tools such as an algorithm based on ATR indicators and Stochastic Oscillator. You can modify these two parameters as you wish to adapt the settings to the desired period. My othe
    Fractal Advanced MT5
    Siarhei Vashchylka
    5 (3)
    Fractal Advanced - displays Fractal and Alligator indicators on the price chart. Has wide options for settings and customization. It is also equipped with alerts and a hotkey system. Manual (Be sure to read before purchasing) | Version for MT4 Advantages 1. The indicator does not fill the entire chart with fractals, but allows you to display only relevant signals. 2. The number of fractals is adjusted by scrolling the mouse while holding down the Shift key. 3. Instantly show/hide the Alligator
    Was: $249  Now: $99   Market Profile defines a number of day types that can help the trader to determine market behaviour. A key feature is the Value Area, representing the range of price action where 70% of trading took place. Understanding the Value Area can give traders valuable insight into market direction and establish the higher odds trade. It is an excellent addition to any system you may be using. Inspired by Jim Dalton’s book “Mind Over Markets”, this indicator is designed to suit the
    Auto Order Block with break of structure based on ICT and Smart Money Concepts (SMC) Futures Break of Structure ( BoS )             Order block ( OB )            Higher time frame Order block / Point of Interest ( POI )    shown on current chart           Fair value Gap ( FVG ) / Imbalance   -  MTF      ( Multi Time Frame )    HH/LL/HL/LH  -  MTF      ( Multi Time Frame )  Choch  MTF      ( Multi Time Frame )  Volume Imbalance     ,  MTF          vIMB Gap’s Power of 3 Equal High
    IX Power MT5
    Daniel Stein
    5 (3)
    O   IX Power   traz finalmente a precisão imbatível do FX Power para símbolos não-Forex. Determina com exatidão a intensidade das tendências a curto, médio e longo prazo nos seus índices, acções, mercadorias, ETFs e até criptomoedas favoritos. Pode   analisar tudo o que   o seu terminal tem para oferecer. Experimente e veja como   o seu timing melhora significativamente   quando negoceia. Características principais do IX Power Resultados de cálculo 100% precisos e sem repintura - para tod
    Legacy of Gann for MT5
    Pavel Zamoshnikov
    5 (6)
    The indicator very accurately determines the levels of the possible end of the trend and profit fixing. The method of determining levels is based on the ideas of W.D.Gann, using an algorithm developed by his follower Kirill Borovsky. Extremely high reliability of reaching levels (according to K. Borovsky  - 80-90%) Indispensable for any trading strategy – every trader needs to determine the exit point from the market! Precisely determines targets on any timeframes and any instruments (forex, met
    **   All Symbols   x   All Timeframes   scan just by pressing scanner button ** *** Contact me after the purchase to send you instructions and add you in "Trend Reversal group" for sharing or seeing experiences with other users. Introduction: Trendlines are the most famous technical analysis in trading . Trendlines continually form on the charts of markets across all the different timeframes providing huge opportunities for traders to jump in and profit on the action. In the other hand,  The tre
    Mais do autor
    Mini POC
    Flavio Javier Jarabeck
    4.76 (25)
    For those who struggle with overbloated Volume Profile/Market Profile indicators, here is a solution that contains only the Point of Control (POC) information. Super-fast and reliable, the Mini POC indicator presents this vital information visually within your chart. Totally customizable in splittable timeframes, type of Volume, calculation method, and how many days back you need. SETTINGS Timeframe to split the POCs within the day. Volume type to use: Ticks or Real Volume. Calculation method
    FREE
    Tabajara V5
    Flavio Javier Jarabeck
    4.88 (41)
    Metatrader 5 version of the famous Andre Machado's Tabajara indicator. If you don't know Andre Machado's Technical Analysis work you don't need this indicator... For those who need it and for those several friend traders who asked this porting from other platforms, here it is... FEATURES 8-period Moving Average 20-period Moving Average 50-period Moving Average 200-period Moving Average Colored candles according to the inflexion of the 20-period MA SETTINGS You can change the Period of all M
    FREE
    Economic Markers
    Flavio Javier Jarabeck
    4.83 (18)
    Easily get all relevant economic events of the current day right into your chart, as markers. Filter what kind of markers do you want: by country (selected individually) and by Importance (High relevance, Medium, Low or any combination of these). Configure the visual cues to your liking. If there is more than one event set to the very same time, their Names will be stacked and you will see the messages merged with the plus (+) sign on the marker. Obviously that long or too much events on the sam
    FREE
    Auto Support and Resistances
    Flavio Javier Jarabeck
    4.6 (80)
    Are you tired of drawing Support & Resistance levels for your Quotes? Are you learning how to spot Support & Resistances? No matter what is your case, Auto Support & Resistances will draw those levels for you! AND, it can draw them from other timeframes, right into you current chart, no matter what timeframe you are using... You can also Agglutinate regions/zones that are too much closer to each other and turning them into one single Support & Resistance Level. All configurable. SETTINGS Time
    FREE
    Closing Price Reversal
    Flavio Javier Jarabeck
    5 (10)
    Closing Price Reversal is a very well known and traded candlestick pattern. This little indicator paints with specific (user-selected) colors the Closing Price Reveral Up and Down patterns, as well as the Inside Bars (as a bonus). Higher timeframes are more effective  as with all other candlesticks patterns. Do NOT trade solely on this indicator. Search the web for "Closing Price Reversal" to learn about the several approaches that can be used with this pattern. One of them is combining short/me
    FREE
    Inside Bar Radar
    Flavio Javier Jarabeck
    4.67 (6)
    The Inside Bar pattern is a very well known candlestick formation used widely by traders all over the world and in any marketplace. This approach is very simple and adds a little confirmation candle, so it adds a third past candlestick to the count to confirm the direction of the move (upward or downward). Obviously, there is no power on this candlestick formation if the trader has no context on what it is happening on the market he/she is operating, so this is not magic, this "radar" is only a
    FREE
    Symbol Watermark
    Flavio Javier Jarabeck
    4.67 (15)
    Another request from my brotherhood was putting the name of the Symbol being seen - a little bigger - on the Chart, just to get sure that they are seeing the correct one... Mistakes pay a high price on the market... It is a very effective, and almost resource-null-consuming indicator that displays the current Symbol Name and Timeframe in almost any position of your Chart, with any color, and any Font Size... And also you can change the divisor character that is presented between the Symbol Name
    FREE
    Big Player Candles
    Flavio Javier Jarabeck
    4.75 (28)
    If you heard about The Wyckoff Method, Volume Spread Analysis, etc... You are probably searching for the candlestick indicator that shows you the Volume spread all over the current bar, signaling every types of market status... You can control the several Market Levels with custom colors... It is up to you to decide how to use it. Our job is provide you with the indicator... If you like this indicator, all I am asking is a little Review (not a Comment, but a REVIEW! )...    This will mean A
    FREE
    Aggression Volume
    Flavio Javier Jarabeck
    3.86 (21)
    O Indicador de Volume de Agressão é o tipo de indicador que raramente é encontrado na comunidade MQL5 porque não é baseado nos dados de Volume padrão fornecidos pela plataforma Metatrader 5. Ele requer a análise de todos os Ticks de tráfego solicitados na plataforma... Dito isso, o indicador de Volume de Agressão solicita todos os Dados de Tick do seu Broker e os processa para construir uma versão muito especial de um Indicador de Volume, onde as agressões de Compradores e Vendedores são plotada
    FREE
    Weis Waves
    Flavio Javier Jarabeck
    3.15 (26)
    The original author is David Weis, an expert in the Wyckoff Method. The Weis Wave is a modern adaptation of the 1930's Wyckoff Method, another expert in Tape Reading techniques and Chart Analysis. Weis Waves takes market volume and stacks it into waves according to price conditions giving the trader valuable insights about the market conditions. If you want to learn more about this subject you can find tons of videos in YouTube. Just look for "The Wickoff Method", "Weis Wave" and "Volume Spread
    FREE
    MIDAS Super VWAP
    Flavio Javier Jarabeck
    4.29 (14)
    Imagine VWAP, MVWAP and MIDAS in one place... Well, you found it! Now you can track the movement of Big Players in various ways, as they in general pursue the benchmarks related to this measuring, gauging if they had good execution or poor execution on their orders. Traders and analysts use the VWAP to eliminate the noise that occurs throughout the day, so they can measure what prices buyers and sellers are really trading. VWAP gives traders insight into how a stock trades for that day and deter
    FREE
    Market Momentum
    Flavio Javier Jarabeck
    3.86 (7)
    O indicador de Momento do Mercado é baseado no Oscilador de Zona de Volume (VZO), apresentado por Waleed Aly Khalil na edição de 2009 do jornal da Federação Internacional de Analistas Técnicos , e apresenta uma nova visão desses valiosos dados de mercado que muitas vezes são mal compreendidos e negligenciados: o VOLUME. Com essa nova abordagem de "ver" os dados de Volume, os traders podem inferir de maneira mais adequada o comportamento do mercado e aumentar suas chances em uma negociação bem-su
    FREE
    Money Flow Index EA Friendly
    Flavio Javier Jarabeck
    4.25 (4)
    O indicador tradicional Money Flow Index, desta vez, compatível com EAs . Existem 3 buffers expostos que podem ser usados por EAs para analisar automaticamente as condições de sobrecompra e sobrevenda da cotação. Basta usar a função tradicional iCustom() para obter esses sinais. Este cálculo do Money Flow Index é baseado no indicador MFI tradicional da Metaquote. CONFIGURAÇÕES Período do MFI Tipo de volume para analisar (Volume Real ou Ticks) Início da região de sobrecompra Início da região d
    FREE
    VWAP and MVWAP
    Flavio Javier Jarabeck
    4.17 (6)
    Volume Weighted Average Price (VWAP) is a trading benchmark commonly used by Big Players that gives the average price a Symbol has traded throughout the day. It is based on both Volume and price. Additionally we put in this indicator the MVWAP (Moving Volume Weighted Average Price). For those who do not know the usage and the importance od this indicator I recommend a great article about this subject at Investopedia ( https://www.investopedia.com/articles/trading/11/trading-with-vwap-mvwap.asp )
    FREE
    Waves Sizer
    Flavio Javier Jarabeck
    3.67 (6)
    Wyckoff fans, enjoy! Ideally to be used with the Weis Waves indicator, but it can be easily used alone, the Waves Sizer puts the range (in resulting Price movement) done by the Price on its market swings. You can control how accurate or loose will be the swings. This tool is very helpful for visually know how much the Price has traveled in your Timeframe. This way you can confront this level of effort with the resulting Volume, etc... Weis Waves indicator: https://www.mql5.com/en/market/pro
    FREE
    Price Momentum
    Flavio Javier Jarabeck
    4.92 (13)
    Value Chart indicator presents the Price evolution in a new form. This indicator, Price Momentum , was developed taking all the calculations presented in the book " Dynamic Trading Indicators " by Mark W. Helweg and David Stendahl (2002). The technique involves de-trended Prices from a user-defined Period of analysis and the addition of a Volatility index correction. The result is an Oscillator with 3 zones: Fair Price Value, Overbought/Oversold and Extremely Overbought/Oversold zones. Adding th
    FREE
    Stackable VWAP
    Flavio Javier Jarabeck
    3.33 (6)
    Volume Weighted Average Price (VWAP) is a trading benchmark commonly used by Big Players that gives the average price a Symbol has traded throughout the day. It is based on both Volume and price. Additionally we put in this indicator the MVWAP (Moving Volume Weighted Average Price). For those who do not know the usage and the importance od this indicator I recommend a great article about this subject at Investopedia ( https://www.investopedia.com/articles/trading/11/trading-with-vwap-mvwap.asp
    FREE
    Flux Diffuser
    Flavio Javier Jarabeck
    4.43 (7)
    Based on Brazilian trader André Moraes' Difusor de Fluxo theory, the indicator is a more reliable version of the original MACD. It is a great confirmation indicator for Swing Trading and also can be used as a Day Trading tool. If you are not familiar with the concept or André's trading strategies, I strongly recommend his excelent book named "Se Afastando da Manada" in which he explains in detail how this indicator is used. Even if you don't know the Portuguese language it is not difficult to un
    FREE
    Server Clock
    Flavio Javier Jarabeck
    4.89 (9)
    Many friends asked me for a simple, non-obtrusive, resource-friendly clock to track the time during their trades. It seems pretty obvious, but it is a must-have for those trading the market manually, waiting for the Market News, or just to visually know what time it is... Trading is an absorbing endeavor! So, here it is... Totally configurable, including Font Type, Font Size and Chart Location: Upper Left/Center/Right OR Lower Left/Center/Right, with a little twist of adjusting the Offset, just
    FREE
    Candle Zones
    Flavio Javier Jarabeck
    5 (1)
    You probably heard about Candlesticks behaviors, which in most of the times could denote and trace Volume behaviors even if you are not watching Volume itself... Well, this indicator will do this. Naked traders love to rely solely on candlesticks patterns and with Candle Zones you can trap special patterns and DRAW THEM on your chart. As simple as that. There are several filters you can tweak in order to achieve the analysis you want. Just give it a try. After several months of testing, we think
    FREE
    Force Numbers
    Flavio Javier Jarabeck
    Several assets in several markets have the behavior of using specific numbers as Force Numbers, where support, resistance and price thrust is created. Let this indicator draw those levels of support and resistance for you. You can also stack it to show different level of Prices! This technique is being used by Tape Readers and Order Flow traders all over the world for a long time. Give it a try. Challenge yourself to study new ways of Price Action! SETTINGS What Price reference to use in th
    FREE
    ATR Monitor
    Flavio Javier Jarabeck
    4.83 (6)
    O ATR é uma medida de volatilidade introduzida pelo famoso autor J. Welles Wilder Jr. em seu livro "New Concepts in Technical Trading Systems". Em geral, os traders estão acostumados a ver o ATR na forma de um indicador em uma sub-janela do gráfico. O que estou apresentando aqui é uma versão simplificada do ATR - apenas contendo o número atual do ATR - muito útil para monitorar apenas o momento atual do mercado. Se você quiser monitorar vários tempos gráficos dentro do gráfico corrente,
    FREE
    Price Trail Chart
    Flavio Javier Jarabeck
    5 (4)
    For those who hate candlesticks in lower timeframes (M1 through M15) we "invented" a clean new way to follow Price movement and displacement (volatility) called Price Trail Chart . The big "secret" is to get rid of those annoying candle wicks and draw the whole complete candle without them, this way we get a cleaner chart and a new view of the Price Path. No Open or Close markings, just LOW's and HIGH's, full body candle. Additionaly we inserted a Volume monitor from our Best Downloaded indicat
    FREE
    Time Spaced Moving Averages
    Flavio Javier Jarabeck
    4.67 (6)
    The concept is simple: Plotting Price behavior within several periods of time. Some Symbols behave very well during the trading day - with this I mean Intraday trading - and this behavior ends up plotting effectively well with the proposed Exponential Moving Averages in this indicator... Obviously that this behavior could not be seen in all Symbols, but you can give it a try... Just drop this indicator in a chart and you will see for yourself... This indicator is intended for "Feeling the Trend
    FREE
    ATR Monitor EA Friendly
    Flavio Javier Jarabeck
    ATR Monitor ATR is a measure of volatility introduced by market technician J. Welles Wilder Jr. in his book, "New Concepts in Technical Trading Systems". In general, traders are accustomed to seeing the ATR in the form of a sub-window indicator. What I am presenting here is a simplified version of ATR - just the current ATR number - very useful for monitoring just the very moment of the current chart. And, by default, this indicator will not show up on screen, you can just use the buffers thems
    FREE
    Arrows Cleaner
    Flavio Javier Jarabeck
    4.86 (7)
    For those who use the Trading Arrows on the chart for later study, but use the Triple Screen approach and got all those arrows everywhere on all additional charts, here it is: Arrows Cleaner! Just drop it on the chart and leave it there. When needed, just with 1-click you get rid of all those annoying arrows... SETTINGS You can position the little Button on any corner of the chart. Additionally you can displace it with the Offset settings. You can enlarge or shrink its size, as well as the tex
    FREE
    Candlestick Pattern Teller
    Flavio Javier Jarabeck
    5 (1)
    Minions Labs' Candlestick Pattern Teller It shows on your chart the names of the famous Candlesticks Patterns formations as soon as they are created and confirmed. No repainting. That way beginners and also professional traders who have difficulties in visually identifying candlestick patterns will have their analysis in a much easier format. Did you know that in general there are 3 types of individuals: Visual, Auditory, and Kinesthetic? Don't be ashamed if you cannot easily recognize Candlest
    Economic Markers PRO
    Flavio Javier Jarabeck
    5 (1)
    Easily get all relevant economic events of the current day right into your chart, as markers. Filter what kind of markers do you want: by country (selected individually) and by Importance (High relevance, Medium, Low or any combination of these). Configure the visual cues to your liking. Additionaly you have the ability to add up to 5 personal markers of your own agenda. With Alerts and/or with blackout periods, if you are using it within an Expert Advisor! All in one Economic Calendar indicator
    Mini Chart Indicators
    Flavio Javier Jarabeck
    The Metatrader 5 has a hidden jewel called Chart Object, mostly unknown to the common users and hidden in a sub-menu within the platform. Called Mini Chart, this object is a miniature instance of a big/normal chart that could be added/attached to any normal chart, this way the Mini Chart will be bound to the main Chart in a very minimalist way saving a precious amount of real state on your screen. If you don't know the Mini Chart, give it a try - see the video and screenshots below. This is a gr
    Market Momentum PRO
    Flavio Javier Jarabeck
    The Market Momentum indicator is based on the Volume Zone Oscillator (VZO), presented by Waleed Aly Khalil in the 2009 edition of the International Federation of Technical Analysts journal, and presents a fresh view of this market valuable data that is oftenly misunderstood and neglected: VOLUME. With this new approach of "seeing" Volume data, traders can infer more properly market behavior and increase their odds in a winning trade. "The VZO is a leading volume oscillator; its basic usefulnes
    Filtro:
    Sem comentários
    Responder ao comentário