Hukan Stand Alone
- Utilitários
- Atsushi Tokuno
- Versão: 1.1
- Atualizado: 16 maio 2024
- Ativações: 5
"Hukan" is a Japanese word meaning hawk's eye, and this system is software that allows you to monitor the entire MT5 with a hawk's eye.
You can check the real-time chart of the system by clicking the link. (Forex, commodities, Bitcoin, stock CFDs, etc.)
This product enables all the functions that I felt necessary while trading in one system.
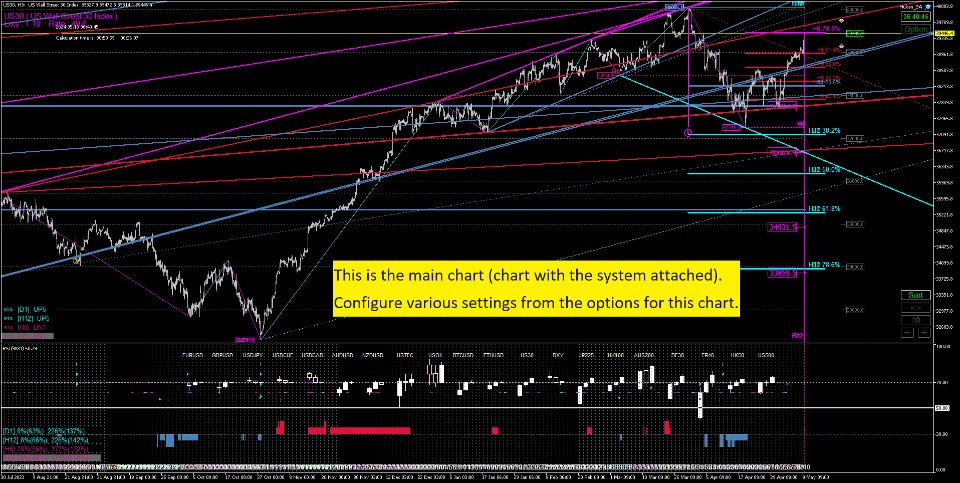
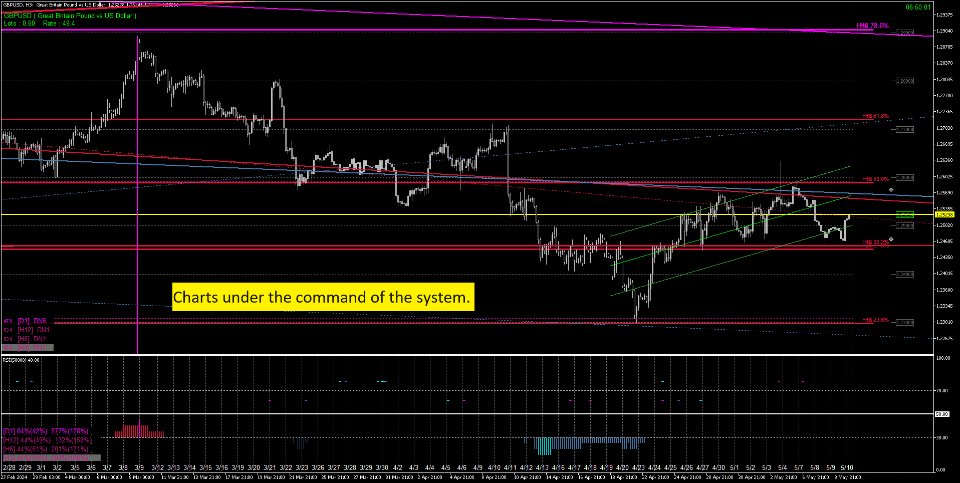
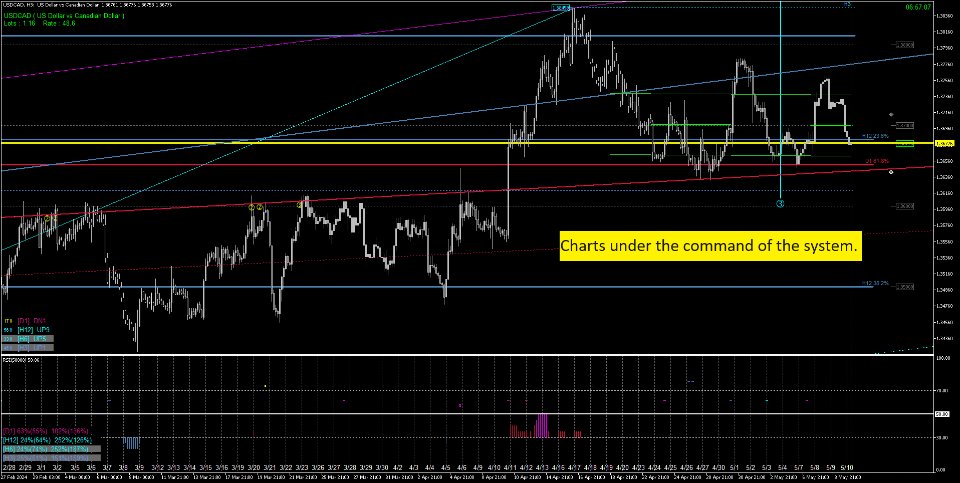
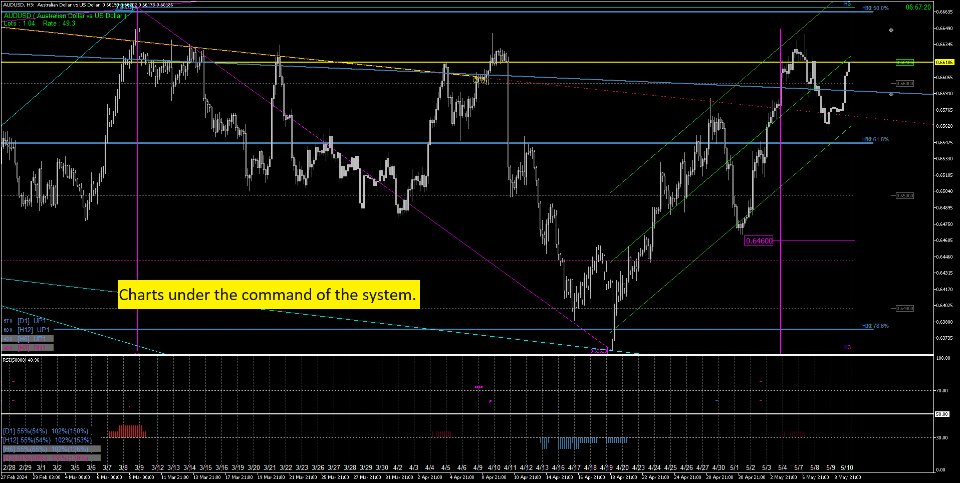
If you attach it to a single chart with a tool based on the Dow theory, it will calculate the Dow theory of the chart for the selected time period of all the desired charts going back to past bars and performing technical analysis up to the present.
Display of Dow Theory status and wave counting.
・Dow theory high and low prices and previous high and low prices.
・Trend line
・Channel line
・Elliott Wave
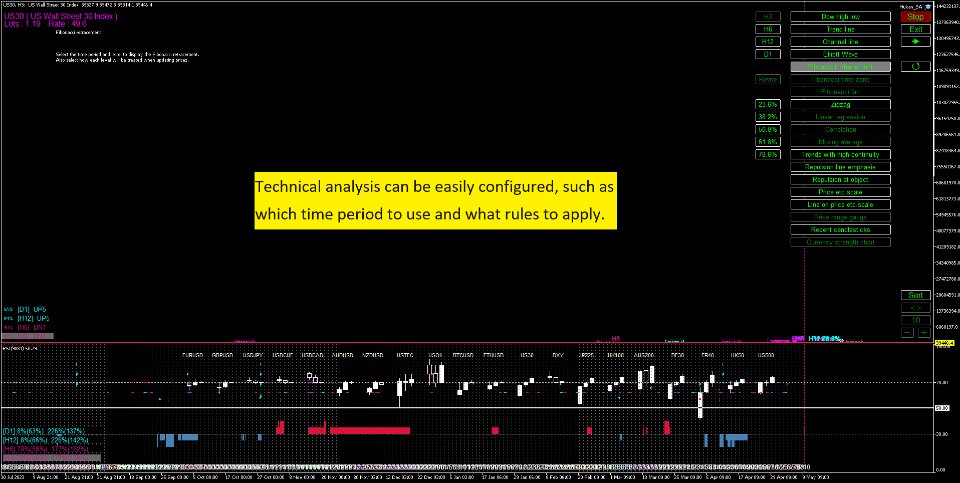
・Fibonacci retracement
・Fibonacci time zone
・Fibonacci fan
・ZigZag
・Linear regression
・Correlation coefficient
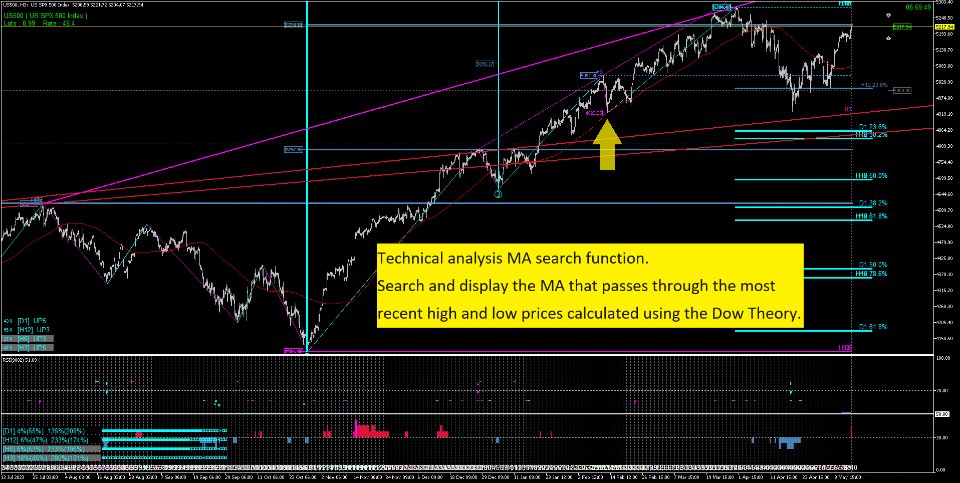
・MA (passes through the high and low prices of the Dow Theory.)
・Price return in a highly continuous trend.
・Emphasis on lines where prices have rebounded many times.
・Monitoring the price rebound at the technical line.
・Price scale and horizontal line
・The most recent bar of the chart being calculated.
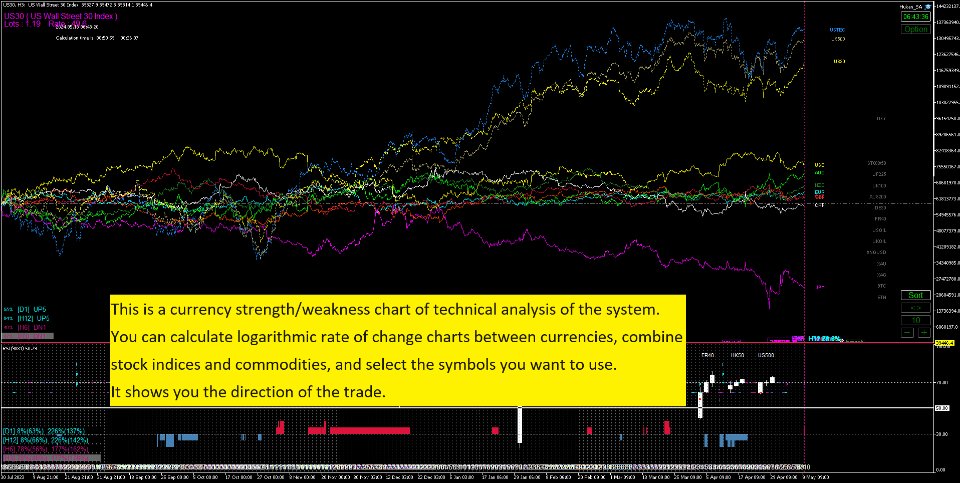
・Currency strength/weakness chart
In addition, this system does not just draw technical lines, but constantly monitors them.
For example, while you are looking at the M5 chart of USDJPY, the price on the chart of EURUSD reaches the 61.8% level of the H12 Fibonacci retracement for the first time. The system will instantly notify you with a voice and display a chart of EURUSD.
Similarly, you will never miss the moment when the price first reaches the trend line, channel line, or Elliott wave for the selected time period.
And if the price touches the technical line, it will be recorded on the subchart.
The system always saves the settings of its own option screen in the global function, so there is no need to save them in the expert's parameters.
What you set in the expert parameters is information about the account you are using, such as symbol name and commission.
In addition, functions are always explained in the form of comments on the chart, so there is no need for an instruction manual and you can use it from the beginning.
In addition, it is possible to trade using trend lines and rectangular objects, and trend lines can be used as limit prices and break at closing prices, and prices can be synchronized with the MA displayed by the system.
Rectangular objects allow you to place orders on the arrival of technical lines within a range, or on crossing the upper and lower limits of a linear regression over multiple time periods.
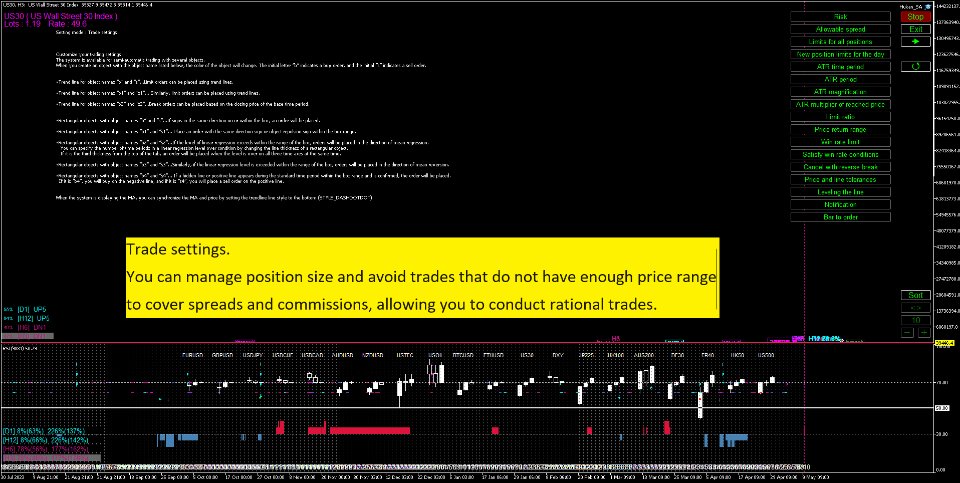
It also has an automatic lot size calculation function, allowing you to trade with an appropriate lot size according to the risk and ATR you set. (We have devised a way to support symbols such as CFD, which often have invalid specifications.)
As for how the system works, when you attach it to a chart, it starts calculating from the past chart to the current bar.
For example, if you want to calculate from 2000 bars before, the calculation will start for longer time periods up to the time 2000 bars before the main time period.
The system is operated by a timer function rather than a tick, and performs an extremely fast initial calculation, and then calculates it every second you set.
Calculation starts from 2000 bars in advance for all time periods set arbitrarily.
And when the longer time period finishes calculating up to the time 2000 bars before the main time period, it will synchronize with the main time period and calculate up to the current bar.
This is the weak point of the system, and although the program is in the most efficient form, the system synchronizes all time periods for each bar and performs technical analysis, which takes time.
For example, if there are 3 time periods and 3 charts, then 2000 bars of 9 charts will be calculated.
If this is the case, it will not take much time, but if the time period is 9, the number of charts is 20, and the number of bars is 2500 bars, the initial calculation will take about 2 hours.
This is equivalent to calculating 2500 bars of 180 charts.
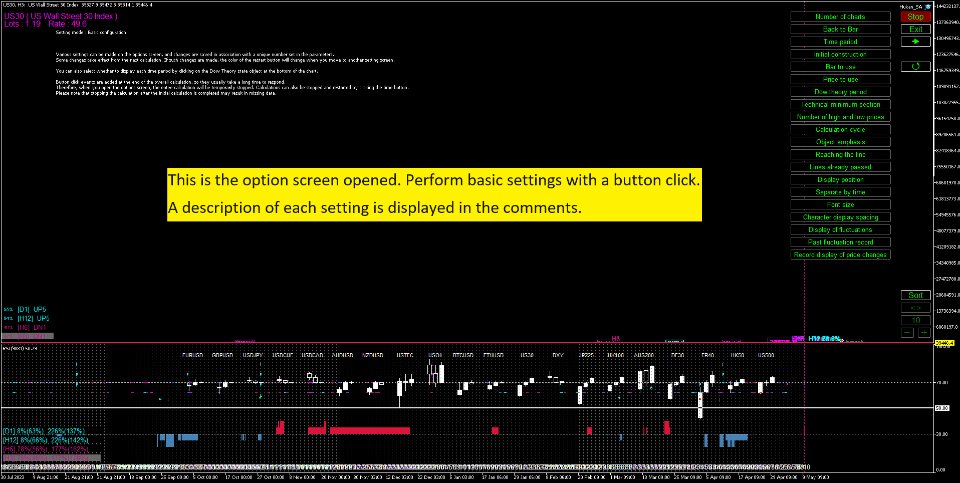
Even during the initial calculation, you can click the option button on the chart to make various settings.
There are settings for items that require a restart, so if you want to apply the changes, click the restart button.
Clicking the option button or clicking the time display will pause the calculation.
In the state before the calculation is paused (when you first open the options screen), it will take some time for the button clicks to be reflected, so please wait.
This is because button click judgment is added at the end of chart calculations and drawings, which may be a little stressful.
Once the calculation is finished, you can monitor all charts, time periods and trade in real time.
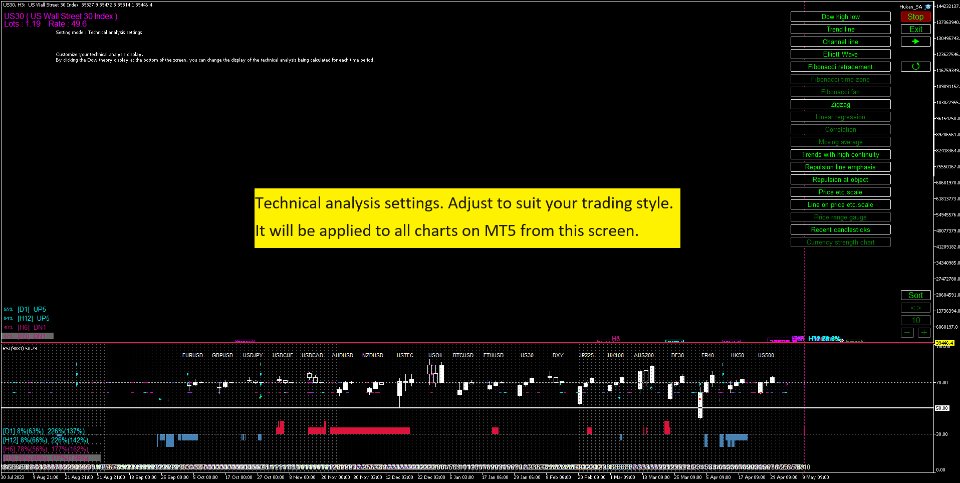
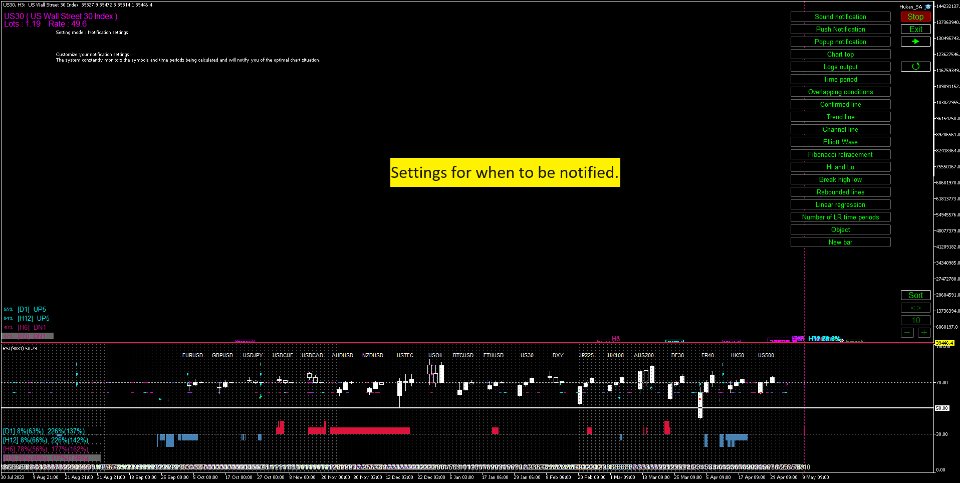
The system's unique option settings can be broadly divided into basic settings, technical analysis settings, alert settings, and trade settings.
Below are the expert parameter settings.
・Unique number: If you use multiple systems, please change the number. This number is used to record option settings and distinguish magic numbers when trading.
・Language selection: You can select the display from English or Japanese by setting the language.
・Applies RSI for subwindow expansion.: The system applies very long-term RSI to the chart for subwindow expansion. If you can provide another subwindow indicator, please set it to false.
・Show descriptive comments in logs.; Setting changes and explanations are displayed in comments, but the same content is also output to the expert log. If the text in the comment display is too small to read, please set it to true.
・Apply template on startup.: If you want to apply the template to the chart when the system starts up, please enter the template name appropriately. (Does not apply to charts with attached systems.)
・Audio file for notifications.: Enter the audio file for alerts. If you leave it blank, the audio file "symbol name.wav" will be called, so if you want to separate alert sounds, please prepare them in the MT5 Sounds folder.
・Audio file before the new bar appears.: This is the audio before the bar of the main time period is finalized.
Below, set the symbol name and fee (if any) according to your account. Used to calculate correlation coefficients, currency strength/weakness charts, or lot size.
"If you use it, enter it according to your account."
・EURUSD
・USDJPY
・GBPUSD
・AUDUSD
・USDCHF
・USDCAD
・NZDUSD
・BTCUSD
・ETHUSD
・XAUUSD
・XAGUSD
・DXY
・US30
・NASDAQ100
・US500
・EU50
・JP225
・UK100
・AUS200
・GER30
・FRA40
・USOIL
・UKOIL
・XNGUSD
・Commission Currency
・Forex symbol suffix
"Enter the required commission"
・Forex
・DXY
・US30
・NASDAQ100
・US500
・EU50
・JP225
・UK100
・AUS200
・GER30
・FRA40
・USOIL
・UKOIL
・XNGUSD
I am confident that this product will satisfy those who love trading, but I would like to alleviate any concerns that those who are considering purchasing it may have.
Therefore, please ask questions until you are satisfied with the points you are concerned about.
Also, if you have any new suggestions for the system, please contact us. I will consider it if it is possible to me.
Additionally, if there are any bugs in the system, please let me know so I can fix them.
Any reviews, good or bad, about the system are welcome.
Thank you very much for seeing it.

