Ma Speedometer Dashboard
- Indicadores
- Davit Beridze
- Versão: 1.0
- Ativações: 5
A versão demo não tem utilidade. Você não entenderá nada ao olhar para os números piscando. Este é um painel de controle. Tente entender o conceito, e eu ajudarei com o restante.
Os símbolos devem ser separados por vírgulas (,) e inseridos nos parâmetros exatamente como exibidos pelo seu corretor, para garantir que sejam reconhecidos no painel. Esses símbolos serão usados para a análise do indicador.
Com um único clique, você pode abrir qualquer par e qualquer período de tempo diretamente no painel.
O MA Speedometer Dashboard é um indicador altamente funcional para MetaTrader 4 (MT4), projetado para aprimorar estratégias de trading por meio de uma análise dinâmica de mercado. Ele oferece funções poderosas para identificar tendências de mercado, operar em mercados laterais e sair de condições de mercado plano, tudo baseado nos ângulos de médias móveis. Como um bônus especial, os clientes também recebem uma versão especial do indicador MA Speedometer, que serve como base para o painel.
Principais características:
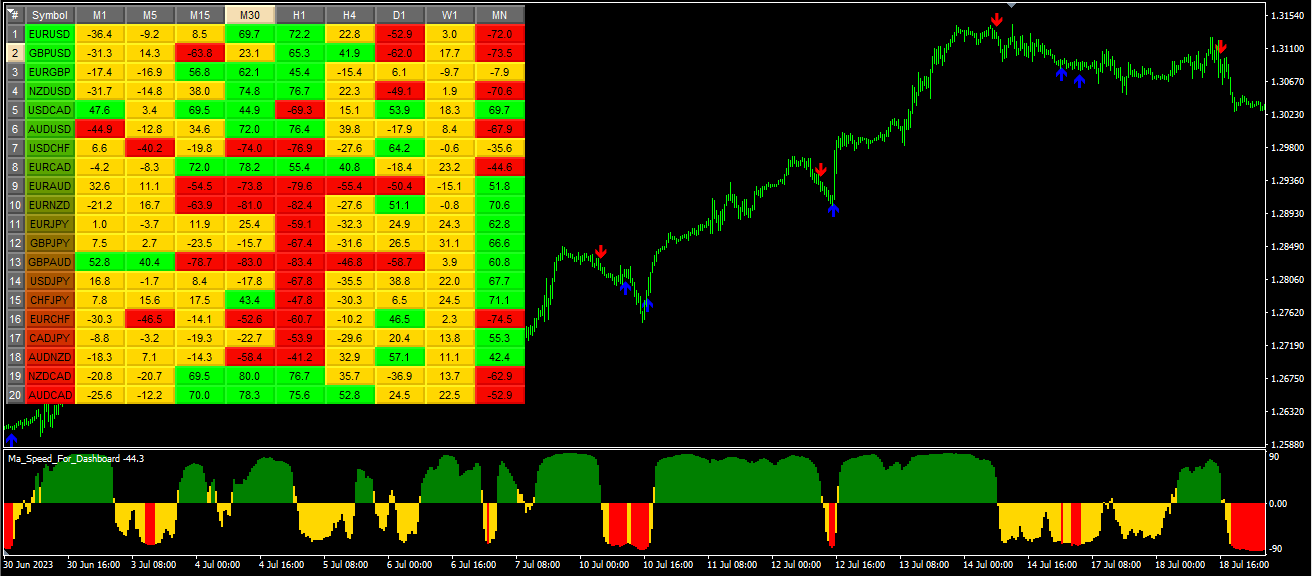
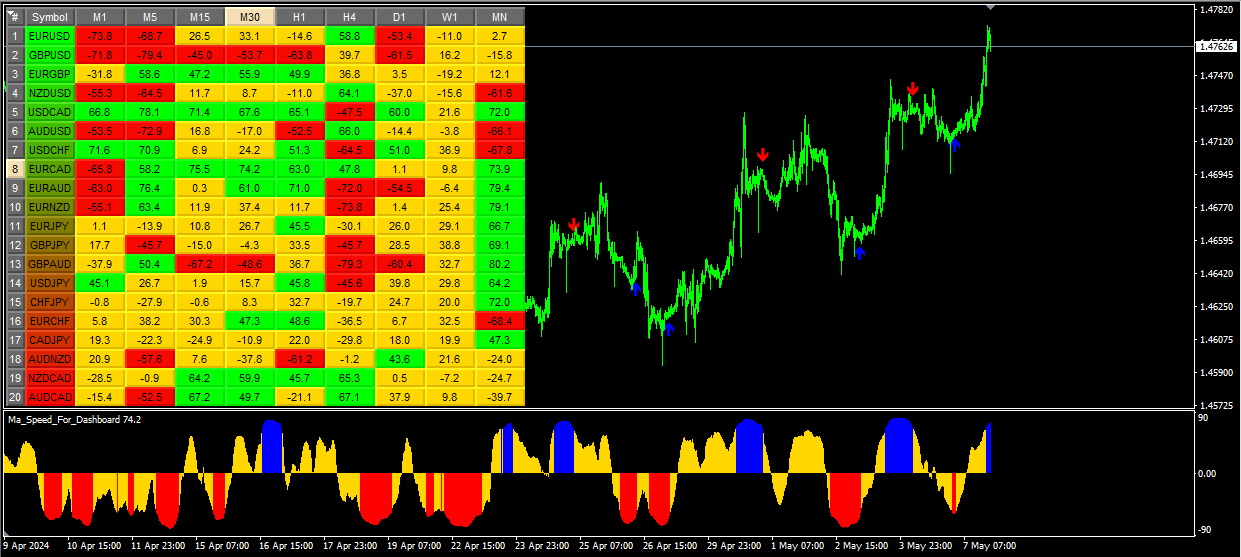
Análise completa de tendências: O painel usa os ângulos das médias móveis (MA) para detectar possíveis tendências de mercado. Os traders podem identificar facilmente o início de fortes tendências de alta ou baixa através de sinais com cores:
- Verde: Indica o início de uma forte tendência de alta, oferecendo uma oportunidade de entrada.
- Vermelho: Indica o início de uma forte tendência de baixa, também oferecendo um ponto de entrada.
- Amarelo: Sinaliza mercados planos ou laterais, sugerindo pontos de saída.
Monitoramento multi-temporal: O painel suporta múltiplos períodos de tempo, de M1 até MN, permitindo que os traders analisem as condições do mercado em diferentes níveis, desde curtos até mais amplos. Essa função é útil tanto para day trading quanto para investimentos de longo prazo.
Painel interativo: A interface interativa permite que os traders alternem rapidamente entre diferentes pares de moedas e períodos de tempo. Ao clicar no painel, o MT4 abre automaticamente o gráfico do par de moedas e período selecionado, aumentando a usabilidade e a eficiência.
Parâmetros personalizáveis: Os traders podem personalizar o período da média móvel, o método e os limites dos ângulos para alinhar o painel com suas estratégias de trading preferidas. Essa flexibilidade torna a ferramenta adaptável a diversas condições de mercado e abordagens de trading.
Alertas visuais: O design intuitivo do painel inclui alertas visuais e etiquetas fáceis de ler para diferentes condições de mercado. Isso melhora a percepção situacional, ajudando os traders a tomar decisões informadas de maneira rápida.
Bônus especial: Como uma oferta especial, os clientes recebem uma versão única do indicador MA Speedometer como brinde. Esse indicador serve como base para o painel, permitindo uma análise ainda mais detalhada.
Descrição de cada parâmetro de entrada:
- Symbols: Esse parâmetro é uma entrada de texto onde você pode especificar uma lista de símbolos separados por vírgulas (,). Esses símbolos serão usados para análise pelo indicador.
- StartBar: Esse parâmetro é uma entrada numérica que representa a barra inicial para calcular o ângulo da média móvel.
- MaPeriod: Esse parâmetro é uma entrada numérica que representa o período usado para calcular a média móvel.
- MaMethod: Esse parâmetro é uma entrada de enumeração que representa o método usado para calcular a média móvel. Pode assumir valores da enumeração ENUM_MA_METHOD, que provavelmente inclui opções como Média Móvel Simples (SMA), Média Móvel Exponencial (EMA), entre outras.
- Level_Up_M1 a Level_Dn_MN1: Esses parâmetros são entradas numéricas que representam os níveis superior e inferior para diferentes períodos de tempo (de M1 a MN1). Eles são usados para determinar a cor de fundo dos botões com base no ângulo da média móvel.
- X-Size e Y-Size: Esses parâmetros são entradas numéricas que representam a largura e a altura dos botões, respectivamente.
Resumo: O MA Speedometer Dashboard oferece aos traders uma ferramenta completa para análise de mercado, adequada tanto para traders de tendência quanto para aqueles que preferem mercados laterais. Sua flexibilidade, interface interativa e parâmetros personalizáveis fazem dela uma adição valiosa a qualquer conjunto de ferramentas de trading, ajudando a navegar com mais precisão e conhecimento nas complexidades do mercado de câmbio.


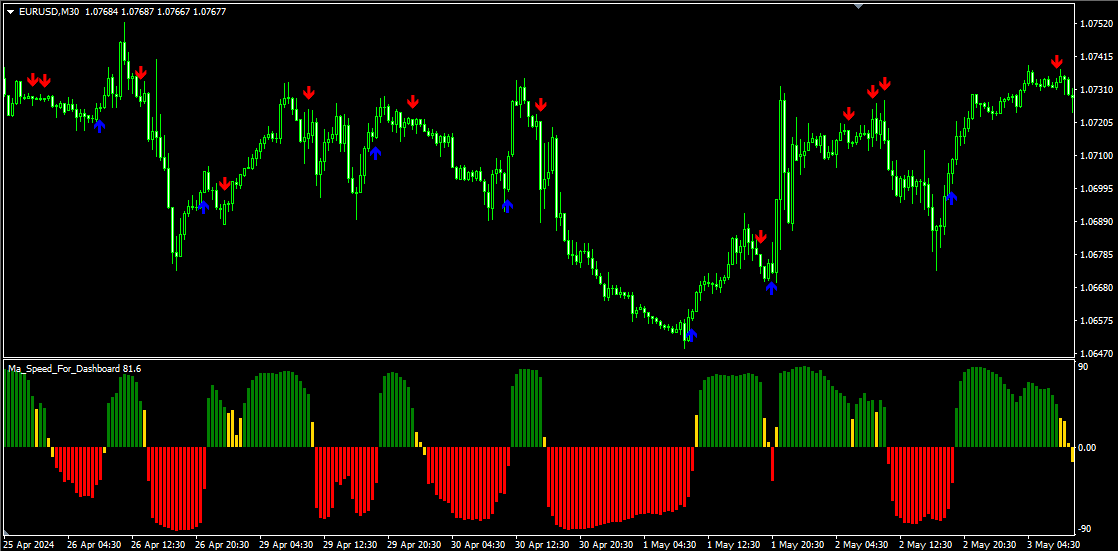


Great dashboard based on the innovative idea of MA angle changes on various instruments desired. The steeper the MA angle, the greater the momentum. Find the instruments with best momentum. Very clever idea. The bonus indicator is very helpful and gives great signals based on the same concept of MA angles, fully customizable.