• Visão global
  • Comentários (1)
  • Discussão (4)
  • O que há de novo

COSMOS4U Volume MT5

1

COSMOS4U Volume indicator facilitates your trade decisions. It gives confirmation of the running movement and market trends. It highlights current and past accumulation and distribution volumes, comparing them to moving average volume and the highest volume. In addition, it identifies and marks nuances as well as convergence and divergence patterns of bears and bulls in order to provide the market trend and price ranges.

The supported features are as follows:

  • Fast Volume Moving Average
  • Slow Volume Moving Average
  • Highest Volume
  • Bull & Bear Volume Sums & Difference
  • Tick & Real (requires broker’s data) Volume
  • Periods for the Volume Moving Average, the Highest Volume and the Period of the Bull & Bear Volumes Difference
  • All timeframes (M1, M15, H1, H4, D, W, M…..)
  • All pairs
  • Colors for all elements
  • Style and width of bars and lines

It is a very simple indicator with maximum confirmation signals’ efficiency.


Trading COSMOS4U Volume.

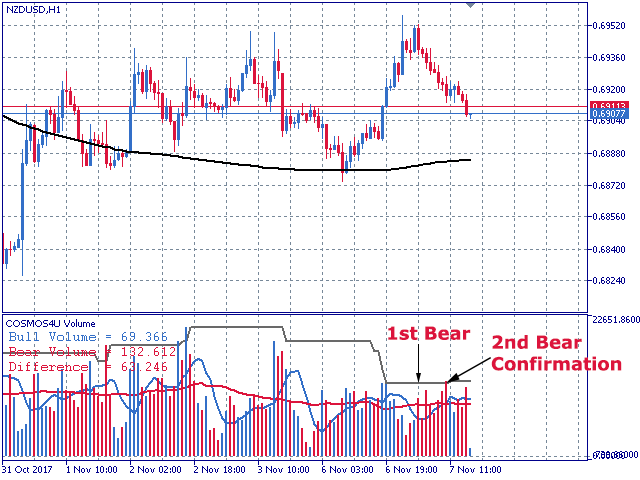
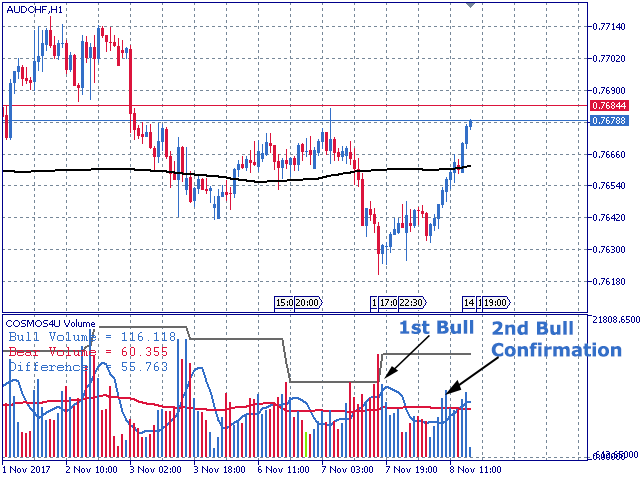
COSMOS4U Volume indicator, highlights volume ranges in blue, in the event of bull close, in red on a bear close and in purple supposing support matches resistance trends.

These Volumes are compared in real time with the average volumes (fast & slow) and the highest volume, in order for traders to see the current running total for positive and negative volume. When volume figures move higher than the Highest Volume level, a strong confirmation signal for market trend is generated. A twofold or threefold increase in volume is a confirmation signal for continuity in most cases.

In addition, positive and negative volume indexes (bullish and bearish divergences) reflect the trend of trades.

In our point of view, the COSMOS4U Volume Indicator is a confirmation indicator which is a vital complement to your trading system. Regardless of the Long/Short Signal System that you opt for,(for example supports/resistances, Fibonacci Levels, MACD, ADX, SMAs & EMAs etc) the COSMOS4U Volume indicator is the ideal confirmation tool for your trade. An upward slow average crossover by fast signifies continuation of the trend.

You need high level volumes to perform a variety of tasks. For Long term setup you need High Blue (Bullish) Volumes approximating the Highest Level and Bullish (positive) Divergence. For Short term setup, you need High Red (Bear) Volumes, the Highest Level indicator and Bearish Divergence.


Updates

Free for all owners.


Parameters

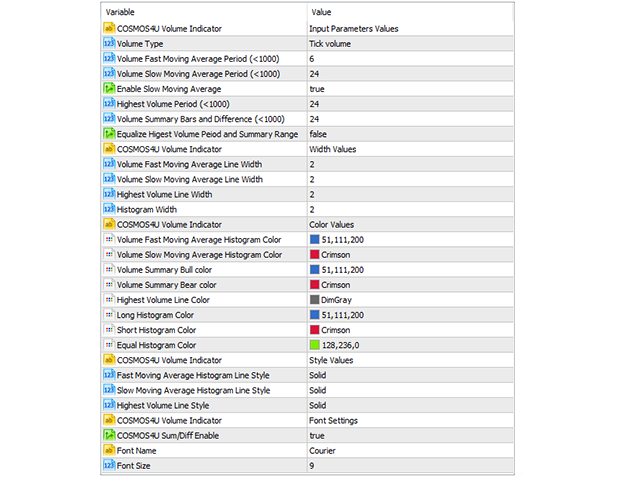
COSMOS4U Volume Parameters

  • Volume Type - It sets the Volume type to real (if the broker provides data) or tick.
  • Volume Fast Moving Average Input Period - It sets the fast time period to calculate the volume average.
  • Volume Slow Moving Average Input Period - It sets the slow time period to calculate the volume average.
  • Enable Slow Moving Average - It enables the display of the Slow Moving Average.
  • Highest Volume Period - It sets the time period to calculate the highest volume.
  • Volume Summary Bars and Difference - It sets the time period to calculate the volume summary (bulls, bears & difference) from now.
  • Equalize Highest Volume Period and Summary Range - It sets Summary Range equal to Highest Volume.

COSMOS4U Volume Widths

  • Volume Fast Moving Average Line Width - It sets the width of the volume fast moving average line.
  • Volume Slow Moving Average Line Width - It sets the width of the volume slow moving average line.
  • Highest Volume Line Width - It sets the width of the highest volume line.
  • Histogram Width - It sets the width of the Histogram lines.

COSMOS4U Volume Colors

  • Volume Fast Moving Average Line Color - It sets the color of the volume fast moving average line.
  • Volume Slow Moving Average Line Color - It sets the color of the volume slow moving average line.
  • Volume Summary Bull color - It sets the color of the bull summary volumes' calculation text.
  • Volume Summary Bear color - It sets the color of the bear summary volumes' calculation text.
  • Highest Volume Line Color - It sets the color of the highest volume line.
  • Long Histogram Color - It sets the color of the Bullish Histogram line.
  • Short Histogram Color - It sets the color of the Bearish Histogram line.
  • Equal Histogram Color - It sets the color of the neutral Histogram line.

COSMOS4U Volume Style

  • Volume Fast Moving Average Line Style - It sets the style of the volume fast moving average line.
  • Volume Slow Moving Average Line Style - It sets the style of the volume slow moving average line.
  • Highest Volume Line Style - It sets the style of the highest volume line.

COSMOS4U Volume Font Settings

  • Sum/Diff Enable - It enables the display of the summary & difference volumes' calculation text.
  • FontName - It sets the font name of the summary & difference volumes' calculation text.
  • FontSize - It sets the font size of the summary & difference volumes' calculation text.
Produtos recomendados
Value Chart Candlesticks
Flavio Javier Jarabeck
4.7 (10)
The idea of a Value Chart indicator was presented in the very good book I read back in 2020 , " Dynamic Trading Indicators: Winning with Value Charts and Price Action Profile ", from the authors Mark Helweg and David Stendahl. The idea is simple and the result is pure genius: Present candlestick Price analysis in a detrended way! HOW TO READ THIS INDICATOR Look for Overbought and Oversold levels. Of course, you will need to test the settings a lot to find the "correct" one for your approach.
FREE
Weis Waves
Flavio Javier Jarabeck
3.15 (26)
The original author is David Weis, an expert in the Wyckoff Method. The Weis Wave is a modern adaptation of the 1930's Wyckoff Method, another expert in Tape Reading techniques and Chart Analysis. Weis Waves takes market volume and stacks it into waves according to price conditions giving the trader valuable insights about the market conditions. If you want to learn more about this subject you can find tons of videos in YouTube. Just look for "The Wickoff Method", "Weis Wave" and "Volume Spread
FREE
LT Donchian Channel
Thiago Duarte
4.75 (4)
Donchian Channel (ou canal de Donchian) é um indicador criado por  Richard Donchian. Ele é  formado tomando a máxima mais alta e a mais baixa mais baixa do último período especificado em velas. A área entre alta e baixa é o canal para o período escolhido. Sua configuração é simples. É possível ter a média entre a linha superior e inferior além de alertas quando o preço atinge um dos lados. Se tiver alguma dúvida ou encontrar alguma falha, me contate. Faça bom uso!
FREE
Waves Sizer
Flavio Javier Jarabeck
3.67 (6)
Wyckoff fans, enjoy! Ideally to be used with the Weis Waves indicator, but it can be easily used alone, the Waves Sizer puts the range (in resulting Price movement) done by the Price on its market swings. You can control how accurate or loose will be the swings. This tool is very helpful for visually know how much the Price has traveled in your Timeframe. This way you can confront this level of effort with the resulting Volume, etc... Weis Waves indicator: https://www.mql5.com/en/market/pro
FREE
Aggression Volume
Flavio Javier Jarabeck
3.91 (22)
O Indicador de Volume de Agressão é o tipo de indicador que raramente é encontrado na comunidade MQL5 porque não é baseado nos dados de Volume padrão fornecidos pela plataforma Metatrader 5. Ele requer a análise de todos os Ticks de tráfego solicitados na plataforma... Dito isso, o indicador de Volume de Agressão solicita todos os Dados de Tick do seu Broker e os processa para construir uma versão muito especial de um Indicador de Volume, onde as agressões de Compradores e Vendedores são plotada
FREE
Market Profile 3 ForexArby com
Hussien Abdeltwab Hussien Ryad
3.92 (13)
Market Profile 3 MetaTrader 5 indicator  version 4.70— is a classic Market Profile implementation that can show the price density over time, outlining the most important price levels, value area, and control value of a given trading session. This indicator can be attached to timeframes between M1 and D1 and will show the Market Profile for daily, weekly, monthly, or even intraday sessions. Lower timeframes offer higher precision. Higher timeframes are recommended for better visibility. It is als
FREE
White Weis Volume Ticks
Ricardo Almeida Branco
5 (3)
White Weis Volume Este indicador mostra o somatório do volume em cada onda, bulish ou bearish, conforme idealizado por David Weis, mas traz um importante adicional que é a marcação da barra de maior volume da onda (White Bar)! Na codificação do indicador, foi buscado otimizar o código para exigir o mínimo processamento durante o uso e não sobrecarregar o mt5. O indicador pode ser usado para análise e estudo pré pregão, onde o trader analisa possíveis pontos de suporte e resistência com
Introduction This indicator detects volume spread patterns for buy and sell opportunity. The patterns include demand and supply patterns. You might use each pattern for trading. However, these patterns are best used to detect the demand zone (=accumulation area) and supply zone (=distribution area). Demand pattern indicates generally potential buying opportunity. Supply pattern indicates generally potential selling opportunity. These are the underlying patterns rather than direct price action. T
FREE
Follow The Line MT5
Oliver Gideon Amofa Appiah
4.42 (31)
This indicator obeys the popular maxim that: "THE TREND IS YOUR FRIEND" It paints a GREEN line for BUY and also paints a RED line for SELL. (you can change the colors). It gives alarms and alerts of all kinds. IT DOES NOT REPAINT and can be used for all currency pairs and timeframes. Yes, as easy and simple as that. Even a newbie can use it to make great and reliable trades. NB: For best results, get my other premium indicators for more powerful and reliable signals. Get them here: https://www.m
FREE
Important Lines
Terence Gronowski
4.88 (26)
This indicator displays Pivot-Lines, preday high and low, preday close and the minimum and maximum of the previous hour. You just have to put this single indicator to the chart to have all these important lines, no need to setup many single indicators. Why certain lines are important Preday high and low : These are watched by traders who trade in a daily chart. Very often, if price climbs over or falls under a preday low/high there is an acceleration in buying/selling. It is a breakout out of
FREE
Are you tired of drawing trendlines every time you're analyzing charts? Or perhaps you would like more consistency in your technical analysis. Then this is for you. This indicator will draw trend lines automatically when dropped on a chart. How it works Works similar to standard deviation channel found on mt4 and mt5. It has 2 parameters: 1. Starting Bar 2. Number of bars for calculation The   starting bar   is the bar which drawing of the trend lines will begin, while the   number of bars for c
FREE
Donchian Pro
Paulo Henrique Faquineli Garcia
5 (2)
O Canal Donchian Os canais são uma das ferramentas de análise técnica mais populares porque transmitem intuitivamente aos analistas as restrições que tendem a ocorrer na maioria das mudanças de preço. Os usuários do canal sabem que informações valiosas podem ser obtidas a qualquer momento, independentemente de o preço estar no centro de uma faixa ou próximo a uma das fronteiras. Uma das técnicas mais famosas para explorar esses conceitos são as bandas de Bollinger. No entanto, John Bollinger não
FREE
Swiss VWAPsimple
Terence Gronowski
5 (4)
Swiss VWAPsimple Motivation Did not find free VWAP that works, the one that I found craseh. So I created a VWAP which calculates values only for the actual day. So computer resouces are not over stressed. What is VWAP, how is it used?  VWAP stands for Volume Weighed Average Price, it calculates the running sum of tick volume and the runnung sum of price times tickvolume. The division of these sums result in a weighed price (Sum P*V/Sum V). The calculation starts normally at midnight. The value
FREE
MIDAS Super VWAP
Flavio Javier Jarabeck
4.29 (14)
Imagine VWAP, MVWAP and MIDAS in one place... Well, you found it! Now you can track the movement of Big Players in various ways, as they in general pursue the benchmarks related to this measuring, gauging if they had good execution or poor execution on their orders. Traders and analysts use the VWAP to eliminate the noise that occurs throughout the day, so they can measure what prices buyers and sellers are really trading. VWAP gives traders insight into how a stock trades for that day and deter
FREE
COMPRE um dos nossos ROBÔS e RECEBA  a VERSÃO PRO deste produto DE GRAÇA  Não deixe de testar nossa versão   Profissional   com recursos e alertas configuráveis:  Agression Wave PRO Este indicador soma a diferença entre a agressão de venda e agressão de compra ocorrida em cada Candle, plotando graficamente as ondas de acumulação dos volumes de agressão. Através destas ondas é calculada uma média exponencial que indica o sentido do fluxo de negócios Nota:   Ele
FREE
Este é um indicador de agressão comprador e vendedor que analisa o formato de cada vela e projeta esses dados em forma de histograma. Há 4 histogramas em um só. Na parte frontal temos dois: Superior - força compradora Inferior - força vendedor Na parte de trás temos também dois histogramas, ambos da mesma cor. Eles medem a força conjunta dos compradores e vendedores. Esses histogramas podem ser desativados nos Parâmetros de Entrada. É possível também ter o volume real ou de tick para fazer essa
FREE
VWAP Indicator
LUC JACOBUS A VERHEECKE
4.32 (25)
Volume Weighted Average Price (VWAP) The volume weighted average price (VWAP) is a  trading   benchmark  used by traders that gives the average price a security has traded at throughout the day, based on both volume and price. It is important because it provides traders with insight into both the trend and value of a security. This indicator VWAP V2 is free and is the manual version of the extended Easy VWAP indicator (30 Euro), where the date and time properties are automatically entered. With
FREE
BoxInside MT5
Evgeny Shevtsov
5 (4)
This indicator calculates the volume profile and places labels that correspond to the VAH, VAL and POC levels, for each candle individually. Indicator operation features The indicator works on the timeframes from M3 to MN, but it uses the history data of smaller periods: M1 - for periods from M3 to H1, M5 - for periods from H2 to H12, M30 - for the D1 period, H4 - for the W1 period, D1 - for the MN period. The color and location of the VAL, VAH and POC labels on the current candle are consider
FREE
Expansoes M
Marcus Vinicius Da Silva Miranda
As Expansões M são variações da Proporção Áurea (Sequência de Fibonacci). É a primeira técnica de projeção, no mercado mundial, desenvolvida para ancoragem em Candle. Vantagens: Fácil Plotagem, pode ser ancorada em apenas um Candle; Alto grau de precisão como suportes / resistências; Excelente relação de Risco x Retorno; Funciona em qualquer tempo gráfico; Funciona em qualquer ativo.   As regiões das Expansões M são classificadas em: M0: Ponto 0 (candle inicial) LC: Linha de suporte ini
FREE
A countdown timer for the  Volume bar chart generator  and  Tick chart generator  products, which are available for download from the MQL5 Market: Tick chart generator: https://www.mql5.com/en/market/product/29215 Volume bar chart generator: https://www.mql5.com/en/market/product/47197 The counter conveniently displays the number of ticks or transactions (depending on the chart) that need to pass for a new bar to start printing. The user can set the following indicator inputs. Volume type
FREE
Tabajara V5
Flavio Javier Jarabeck
4.88 (42)
Metatrader 5 version of the famous Andre Machado's Tabajara indicator. If you don't know Andre Machado's Technical Analysis work you don't need this indicator... For those who need it and for those several friend traders who asked this porting from other platforms, here it is... FEATURES 8-period Moving Average 20-period Moving Average 50-period Moving Average 200-period Moving Average Colored candles according to the inflexion of the 20-period MA SETTINGS You can change the Period of all M
FREE
Cumulative Delta MT5
Evgeny Shevtsov
4.48 (61)
The indicator analyzes the volume scale and splits it into two components - seller volumes and buyer volumes, and also calculates the delta and cumulative delta. The indicator does not flicker or redraw, its calculation and plotting are performed fairly quickly, while using the data from the smaller (relative to the current) periods. The indicator operation modes can be switched using the Mode input variable: Buy - display only the buyer volumes. Sell - display only the seller volumes. BuySell -
FREE
Dual RSI
Paul Conrad Carlson
Indicator alerts for Dual Relative strength index rsi. Large rsi preset at 14 is below 30 small rsi preset at 4 is below 10 for buy bullish signals . Large rsi preset are 14 is above 70 small rsi preset at 4 is above 90 for sell bearish signals . Includes mobile and terminal alerts. draws lines when alerts. This indicator can help identify extremes and then the tops or bottoms of those extremes .
FREE
Wave Box Market Frenquency
Jean Jacques Huve Ribeiro
4.83 (6)
Totally linked to the result of a movement and the duration he had. Its height records how many ticks the asset walked during a given movement, its width shows us the duration that movement had. Its configuration must be in line with the Weis Wave Indicator configuration to observe the movement force and can indicate a possible accumulation or distribution of the movement;
FREE
Bar Color Trend
Germano Chagas
4.5 (10)
Combinando o melhor de Price Action , Movimento Direcional , e análise de Divergência/Convergência , o indicador Candle Color Trend is é uma forma fácil e confiável de identificar a direção da tendência. O indicador automaticamente pinta os candles de acordo com a premissa de que a tendência de alta é definida por preços que formam uma série de topos e fundos ascendentes. Por outro lado, a tendência de baixa é definido por preços que formam uma série de topos e fundos descendentes. Adicionalment
FREE
Seconds Charts Demo
Aleksandr Goryachev
5 (1)
Micro  Demo  ******************* Секундные графики в Meta Trader 5 ********************** Более точного инструмента для входа в сделку вы не найдёте. Платная полная версия:  Micro "Second charts" В демоверсии секундные периоды сменяются случайным образом через случайные интервалы времени. Отсутствует автоматическая настройка периодов бесплатных индикаторов.   Входные параметры: Displayed bars - отображаемые бары Step of price levels, pp, 0-off - шаг отрисовки ценовых уровней, пункты Scale
FREE
Free automatic Fibonacci is an indicator that automatically plots a Fibonacci retracement based on the number of bars you select on the BarsToScan setting in the indicator. The Fibonacci is automatically updated in real time as new highest and lowest values appears amongst the selected bars. You can select which level values to be displayed in the indicator settings. You can also select the color of the levels thus enabling the trader to be able to attach the indicator several times with differe
FREE
MW Volume
Martin Bittencourt
4 (5)
O indicador de volume da Martinware desenha uma média móvel colorida sobre as barras de volume. A coloração usa três cores e pode ser feita de diferentes maneiras, escolhidas pelo usuário e aplicada tanto à média quanto às barras de volume. São possíveis três tipos de coloração: Nenhuma: nenhuma coloração é feita Aumentando ou diminuindo: muda a cor dependendo do valor atual ser maior ou menor que o valor anterior Volume relativo à média: as cores variam se o volume atual for maior ou menor
FREE
PZ Pivot Points MT5
PZ TRADING SLU
4.95 (22)
This indicator displays pivot points in the chart, including historical vales, and supports many calculation modes for Pivot Points and S/R levels. [ Installation Guide | Update Guide | Troubleshooting | FAQ | All Products ] It plots historical levels for backtesting purposes It allows you to select the reference timeframe It implements different Pivot Point calculation modes It implements different SR calculation modes It implements customizable colors and sizes Calculation Modes The indi
FREE
The VWAP Level indicator is a technical analysis tool that calculates the weighted average price for the traded volumes of a specific asset. The VWAP provides traders and investors with the average price of an asset over a specific time frame. It is commonly used by investors to compare data on "passive" trading operations, such as pension funds and mutual funds, but also by traders who want to check if an asset has been bought or sold at a good market price. To calculate the VWAP level we
FREE
Os compradores deste produto também adquirem
Atomic Analyst MT5
Issam Kassas
4.79 (19)
Primeiramente, vale ressaltar que este Indicador de Negociação não repinta, não redesenha e não apresenta atrasos, tornando-o ideal tanto para negociação manual quanto automatizada. Manual do utilizador: configurações, entradas e estratégia. O Analista Atômico é um Indicador de Ação de Preço PA que utiliza a força e o momentum do preço para encontrar uma vantagem melhor no mercado. Equipado com filtros avançados que ajudam a remover ruídos e sinais falsos, e aumentam o potencial de negociação.
Primeiramente, vale ressaltar que este Sistema de Trading é um Indicador Não Repintado, Não Redesenho e Não Atrasado, o que o torna ideal tanto para o trading manual quanto para o automatizado. Curso online, manual e download de predefinições. O "Sistema de Trading Inteligente MT5" é uma solução completa de trading projetada para traders novos e experientes. Ele combina mais de 10 indicadores premium e apresenta mais de 7 estratégias de trading robustas, tornando-o uma escolha versátil para dive
Gold Stuff mt5
Vasiliy Strukov
4.9 (183)
Gold Stuff mt5-um indicador de tendência projetado especificamente para o ouro, também pode ser usado em qualquer instrumento financeiro. O indicador não é redesenhado ou atrasado. O timeframe recomendado é H1. Importante! Entre em contato comigo imediatamente após a compra para obter instruções e bônus!  Você pode obter uma cópia gratuita do nosso indicador Strong Support e Trend Scanner, envie uma mensagem privada. a mim! PARÂMETRO Draw Arrow-incl.desligado. desenhar setas no gráfico. A
TPSpro RFI Levels MT5
Roman Podpora
4.67 (9)
Reversal First Impulse levels (RFI)      INSTRUCTIONS        RUS       -       ENG              R ecommended to use with an indicator   -   TPSpro  TREND PRO -  Version MT4                 A key element in trading is zones or levels from which decisions to buy or sell a trading instrument are made. Despite attempts by major players to conceal their presence in the market, they inevitably leave traces. Our task was to learn how to identify these traces and interpret them correctly. Main functi
TPSproTREND PrO MT5
Roman Podpora
4.89 (9)
TPSpro TREND PRO  - is a trend indicator that automatically analyzes the market and provides information about the trend and each of its changes, as well as giving signals for entering trades without redrawing! The indicator uses each candle, analyzing them separately. referring to different impulses - up or down impulse. Exact entry points into transactions for currencies, crypto, metals, stocks, indices!  Version MT4               DETAILED DESCRIPTION               R ecommended to use with an
Trend Screener Pro MT5
STE S.S.COMPANY
4.88 (67)
Desbloqueie o poder da negociação de tendências com o indicador Trend Screener: sua solução definitiva de negociação de tendências, alimentada por lógica difusa e sistema de múltiplas moedas! Eleve sua negociação de tendências com o Trend Screener, o revolucionário indicador de tendências alimentado por lógica difusa. É um poderoso indicador de acompanhamento de tendências que combina mais de 13 ferramentas e recursos premium e 3 estratégias de negociação, tornando-o uma escolha versátil para to
Quantum Trend Sniper
Bogdan Ion Puscasu
4.92 (48)
Apresentando       Quantum Trend Sniper Indicator   , o inovador Indicador MQL5 que está transformando a maneira como você identifica e negocia as reversões de tendência! Desenvolvido por uma equipe de traders experientes com experiência comercial de mais de 13 anos,       Indicador de Atirador de Tendência Quântica       foi projetado para impulsionar sua jornada de negociação a novos patamares com sua forma inovadora de identificar reversões de tendência com precisão extremamente alta. ***C
Atbot
Zaha Feiz
4.94 (16)
AtBot: Como funciona e como usá-lo ### Como funciona O indicador "AtBot" para a plataforma MT5 gera sinais de compra e venda usando uma combinação de ferramentas de análise técnica. Ele integra a Média Móvel Simples (SMA), a Média Móvel Exponencial (EMA) e o índice de Faixa Verdadeira Média (ATR) para identificar oportunidades de negociação. Além disso, pode utilizar velas Heikin Ashi para melhorar a precisão dos sinais. Deixe uma avaliação após a compra e receba um presente especial. ### Princ
FX Power MT5 NG
Daniel Stein
5 (6)
Receba a sua atualização diária do mercado com detalhes e screenshots através do nosso Morning Briefing aqui no mql5 e no Telegram ! O FX Power MT5 NG é a próxima geração do nosso medidor de força de moeda muito popular de longa data, o FX Power. E o que é que este medidor de força da próxima geração oferece? Tudo o que adorou no FX Power original MAIS Análise de força GOLD/XAU Resultados de cálculo ainda mais precisos Períodos de análise configuráveis individualmente Limite de cálculo personal
Antes de tudo, vale ressaltar que esta Ferramenta de Negociação é um Indicador Não Repintante, Não Redesenhante e Não Atrasado, o que a torna ideal para negociação profissional. Curso online, manual do utilizador e demonstração. O Indicador de Conceitos de Ação de Preço Inteligente é uma ferramenta muito poderosa tanto para traders novos quanto experientes. Ele combina mais de 20 indicadores úteis em um único, combinando ideias avançadas de negociação como Análise do Trader do Círculo Intern
IX Power MT5
Daniel Stein
4.17 (6)
O   IX Power   traz finalmente a precisão imbatível do FX Power para símbolos não-Forex. Determina com exatidão a intensidade das tendências a curto, médio e longo prazo nos seus índices, acções, mercadorias, ETFs e até criptomoedas favoritos. Pode   analisar tudo o que   o seu terminal tem para oferecer. Experimente e veja como   o seu timing melhora significativamente   quando negoceia. Características principais do IX Power Resultados de cálculo 100% precisos e sem repintura - para tod
Este painel mostra os últimos   padrões harmónicos   disponíveis para os símbolos seleccionados, pelo que poupará tempo e será mais eficiente /   versão MT4 . Indicador gratuito:   Basic Harmonic Pattern Colunas do indicador Symbol :   aparecem os símbolos seleccionados Trend :   de alta ou de baixa Pattern :   tipo de padrão (gartley, borboleta, morcego, caranguejo, tubarão, cifra ou ABCD) Entry :   preço de entrada SL:   preço de paragem de perda TP1:   preço do 1º take profit TP2:   preç
Este é um indicador para MT5 que fornece sinais precisos para entrar em uma negociação sem redesenhar. Ele pode ser aplicado a qualquer ativo financeiro: forex, criptomoedas, metais, ações, índices. Ele fornecerá estimativas bastante precisas e informará quando é melhor abrir e fechar um negócio. Assista o vídeo (6:22) com um exemplo de processamento de apenas um sinal que compensou o indicador! A maioria dos traders melhora seus resultados de negociação durante a primeira semana de negociação c
Agora US $ 147 (aumentando para US $ 499 após algumas atualizações) - Contas ilimitadas (PCs ou Macs) Manual do usuário do RelicusRoad + vídeos de treinamento + acesso ao grupo de discórdia privado + status VIP UMA NOVA FORMA DE OLHAR PARA O MERCADO O RelicusRoad é o indicador de negociação mais poderoso do mundo para forex, futuros, criptomoedas, ações e índices, oferecendo aos traders todas as informações e ferramentas necessárias para se manterem rentáveis. Fornecemos análises técnica
ICT, SMC, SMART MONEY CONCEPTS, SMART MONEY, Smart Money Concept, Support and Resistance, Trend Analysis, Price Action, Market Structure, Order Blocks, BOS/CHoCH,   Breaker Blocks ,  Momentum Shift,   Supply&Demand Zone/Order Blocks , Strong Imbalance,   HH/LL/HL/LH,    Fair Value Gap, FVG,  Premium  &   Discount   Zones, Fibonacci Retracement, OTE, Buy Side Liquidity, Sell Side Liquidity, BSL/SSL Taken, Equal Highs & Lows, MTF Dashboard, Multiple Time Frame, BigBar, HTF OB, HTF Market Structure
Easy By Sell is a market indicator for opening and closing positions. It becomes easy to track market entries with alerts. It indicates trend reversal points when a price reaches extreme values ​​and the most favorable time to enter the market. it is as effective as a Fibonacci to find a level but it uses different tools such as an algorithm based on ATR indicators and Stochastic Oscillator. You can modify these two parameters as you wish to adapt the settings to the desired period. My othe
Blahtech Supply Demand MT5
Blahtech Limited
4.54 (13)
Was: $299  Now: $99   Supply Demand uses previous price action to identify potential imbalances between buyers and sellers. The key is to identify the better odds zones, not just the untouched ones. Blahtech Supply Demand indicator delivers functionality previously unavailable on any trading platform. This 4-in-1 indicator not only highlights the higher probability zones using a multi-criteria strength engine, but also combines it with multi-timeframe trend analysis, previously confirmed swings
Advanced Supply Demand MT5
Bernhard Schweigert
4.53 (15)
Atualmente com 33% de desconto! A melhor solução para qualquer Trader Novato ou especialista! Este indicador é uma ferramenta de negociação exclusiva, de alta qualidade e acessível porque incorporamos uma série de recursos proprietários e uma nova fórmula. Com esta atualização, você poderá mostrar fusos horários duplos. Você não só será capaz de mostrar um TF mais alto, mas também mostrar ambos, o TF do gráfico, MAIS o TF mais alto: MOSTRANDO ZONAS ANINHADAS. Todos os traders de Oferta e Demanda
Introduction to X3 Chart Pattern Scanner X3 Cherart Pattern Scanner is the non-repainting and non-lagging indicator detecting X3 chart patterns including Harmonic pattern, Elliott Wave pattern, X3 patterns, and Japanese Candlestick patterns. Historical patterns match with signal patterns. Hence, you can readily develop the solid trading strategy in your chart. More importantly, this superb pattern scanner can detect the optimal pattern of its kind. In addition, you can switch on and off individu
AW Trend Predictor MT5
AW Trading Software Limited
4.78 (58)
A combinação de níveis de tendência e quebra em um sistema. Um algoritmo de indicador avançado filtra o ruído do mercado, determina a tendência, os pontos de entrada e os possíveis níveis de saída. Os sinais indicadores são registrados em um módulo estatístico, que permite selecionar as ferramentas mais adequadas, mostrando a eficácia do histórico do sinal. O indicador calcula as marcas Take Profit e Stop Loss. Manual e instruções ->   AQUI   / versão MT4 ->   AQUI Como negociar com o indicador
FX Trend MT5
Daniel Stein
4.68 (37)
Quer tornar-se um comerciante forex de 5 estrelas constantemente lucrativo? 1. Leia a descrição básica do nosso sistema de negociação simples e a sua principal actualização estratégica em 2020 2. Envie um screenshot da sua compra para obter o seu convite pessoal para o nosso chat de negociação exclusivo FX Trend mostra a direcção da tendência, duração, intensidade e a classificação da tendência resultante para todos os períodos de tempo em tempo real. Verá num relance em que direcção as tend
Apresentando       Quantum Breakout PRO   , o inovador Indicador MQL5 que está transformando a maneira como você negocia Breakout Zones! Desenvolvido por uma equipe de traders experientes com experiência comercial de mais de 13 anos,       Quantum Breakout PRO       foi projetado para impulsionar sua jornada comercial a novos patamares com sua estratégia de zona de fuga inovadora e dinâmica. O Quantum Breakout Indicator lhe dará setas de sinal em zonas de breakout com 5 zonas-alvo de lucro e
Auto Order Block with break of structure based on ICT and Smart Money Concepts (SMC) Futures Break of Structure ( BoS )             Order block ( OB )            Higher time frame Order block / Point of Interest ( POI )    shown on current chart           Fair value Gap ( FVG ) / Imbalance   -  MTF      ( Multi Time Frame )    HH/LL/HL/LH  -  MTF      ( Multi Time Frame )  Choch  MTF      ( Multi Time Frame )  Volume Imbalance     ,  MTF          vIMB Gap’s Power of 3 Equal High
AT Forex Indicator MT5
Marzena Maria Szmit
5 (4)
The AT Forex Indicator MT5 is a sophisticated trading tool designed to provide traders with a comprehensive analysis of multiple currency pairs. This powerful indicator simplifies the complex nature of the forex market, making it accessible for both novice and experienced traders. AT Forex Indicator uses advanced algorithms to detect trends, patterns and is an essential tool for traders aiming to enhance their forex trading performance. With its robust features, ease of use, and reliable signal
Matrix Arrow Indicator MT5
Juvenille Emperor Limited
5 (14)
O   Matrix Arrow Indicator MT5   é uma tendência única 10 em 1 seguindo um indicador multi-timeframe   100% sem repintura   que pode ser usado em todos os símbolos/instrumentos:   forex ,   commodities ,   criptomoedas ,   índices ,   ações .  O  Matrix Arrow Indicator MT5  determinará a tendência atual em seus estágios iniciais, reunindo informações e dados de até 10 indicadores padrão, que são: Índice de movimento direcional médio (ADX) Índice de canal de commodities (CCI) Velas clássicas de
Gold TMAF MTF - este é o melhor indicador técnico de acções. O algoritmo do indicador analisa o movimento do preço de um ativo e reflecte a volatilidade e as potenciais zonas de entrada. Os melhores sinais do indicador: - Para VENDER = limite superior vermelho da TMA2 acima do limite superior vermelho da TMA1 + indicador fractal vermelho acima + seta de sinal SR amarela na mesma direção. - Para COMPRAR = limite inferior azul da TMA2 abaixo do limite inferior azul da TMA1 + indicador fra
Automated Trendlines MT5
Georgios Kalomoiropoulos
As linhas de tendência são a ferramenta mais essencial de análise técnica na negociação forex. Infelizmente, a maioria dos traders não os desenha corretamente. O indicador Automated Trendlines é uma ferramenta profissional para traders sérios que o ajudam a visualizar o movimento de tendências dos mercados. Existem dois tipos de Trendlines Bullish Trendlines e Bearish Trendlines. Na tendência de alta, a linha de tendência Forex é desenhada através dos pontos de oscilação mais baixos do m
Elliott Wave Trend was designed for the scientific wave counting. This tool focuses to get rid of the vagueness of the classic Elliott Wave Counting using the guideline from the template and pattern approach. In doing so, firstly Elliott Wave Trend offers the template for your wave counting. Secondly, it offers Wave Structural Score to assist to identify accurate wave formation. It offers both impulse wave Structural Score and corrective wave Structure Score. Structural Score is the rating to sh
Gartley Hunter Multi
Siarhei Vashchylka
5 (8)
Gartley Hunter Multi - An indicator for searching for harmonic patterns simultaneously on dozens of trading instruments and on all possible timeframes. Manual (Be sure to read before purchasing) | Version for MT4 Advantages 1. Patterns: Gartley, Butterfly, Shark, Crab. Bat, Alternate Bat, Deep Crab, Cypher 2. Simultaneous search for patterns on dozens of trading instruments and on all possible timeframes 3. Search for patterns of all possible sizes. From the smallest to the largest 4. A
Golden Spikes Premium
Kwaku Bondzie Ghartey
Golden Spikes Detector Overview: The Golden Spikes Premium is a groundbreaking trading indicator meticulously crafted for the Boom and Crash indices on the Deriv market. Tailored to meet the needs of discerning traders, this powerful tool operates exclusively on the one-minute timeframe, providing timely and precise signals to maximize your trading potential. The Golden Spikes Detector stands out in its ability to deliver accurate signals, ensuring that you capitalize on market opportunities wit
Mais do autor
ADXPivot XAUUSD
COSMOS4U - D. Vezeris & Co, L.P.
Financial freedom with realistic mindset New product by COSMOS4U ADXPivot XAUUSD                                                                                                                                                                                                                                                                                                     The needs of the average investor for financial freedom by using reliable and realistic products are greater than eve
FREE
COSMOS4U AdMACD MT5
COSMOS4U - D. Vezeris & Co, L.P.
COSMOS4U Adaptive MACD indicator is a very simple and effective way to optimize your trade decisions. It can be easily customized to fit any strategy. Using COSMOS4U optimized AdMACD parameters, you can ensure confirmed buy and sell signals for your trades. In addition, the AdMACD displays divergence between the security and MACD trend, in order to provide alerts of possible trend reversals and it is also enhanced with a Take Profit signal line. We suggest trying out the optimized parameters tha
FREE
COSMOS4U AdMACD EA MT5
COSMOS4U - D. Vezeris & Co, L.P.
COSMOS4U transforms MACD into a powerful trading system using optimal parameters. The professional user can customize the system by various parameters so as to achieve optimal performance. Apart from the fast, slow & signal customizable parameters of the classic MACD, it is also enhanced with take profit and stop loss capabilities. Every week the COSMOS4U research department publishes new recommended parameters for the popular exchange rates in Forex market, for the hourly H1 timeframe. The comp
FREE
CoSMOS4U AdTurtle EA MT5
COSMOS4U - D. Vezeris & Co, L.P.
COSMOS4U AdTurtle Expert Advisor is based on the now classic Turtle trading system introduced by Richard Dennis and William Eckhardt. It employs Donchian high/low lines of various periods to decide when to open and close positions. This is an Expert Advisor that can promptly react to sudden trend reversals in everyday trading but is also suitable for executing long-term holding strategies. How it works When the trading mode “Long&Short” is selected, a total of 8 high/low lines are used to open
FREE
ADXPivot XauUsd MT4
COSMOS4U - D. Vezeris & Co, L.P.
Financial freedom with realistic mindset New product by COSMOS4U ADXPivot XAUUSD                                                                                                                                                                                                                                                                                                     The needs of the average investor for financial freedom by using reliable and realistic products are greater than eve
FREE
COSMOS4U Volume MT4
COSMOS4U - D. Vezeris & Co, L.P.
1 (1)
COSMOS4U Volume indicator facilitates your trade decisions. It gives confirmation of the running movement and market trends. It highlights current and past accumulation and distribution volumes, comparing them to moving average volume and the highest volume. In addition, it identifies and marks nuances as well as convergence and divergence patterns of bears and bulls in order to provide the market trend and price ranges. The supported features are as follows: Fast Volume Moving Average Slow Volu
FREE
CoSMOS4U AdTurtle MT5
COSMOS4U - D. Vezeris & Co, L.P.
The COSMOS4U AdTurtle is an indicator based on the now classic Turtle trading system. The various high and low Donchian lines around the price bars show you when to open or close your positions. These lines indicate levels which result in the opening or closing of a respective position when the price crosses through them. By default, the new position barriers are drawn as solid lines and the exit barriers are drawn as dashed lines. The new long position lines and the close short position lines a
FREE
ADXPivot USDCHF
COSMOS4U - D. Vezeris & Co, L.P.
Financial freedom with realistic mindset New product by COSMOS4U ADXPivot USDCHF                                                                                                                                                                                                                                                                                                     The needs of the average investor for financial freedom by using reliable and realistic products are greater than eve
FREE
COSMOS4U AdMACD MT4
COSMOS4U - D. Vezeris & Co, L.P.
COSMOS4U Adaptive MACD indicator is a very simple and effective way to optimize your trade decisions. It can be easily customized to fit any strategy. Using COSMOS4U optimized AdMACD parameters, you can ensure confirmed buy and sell signals for your trades. In addition, the AdMACD displays divergence between the security and MACD trend, in order to provide alerts of possible trend reversals and it is also enhanced with a Take Profit signal line. We suggest trying out the optimized parameters tha
FREE
CoSMOS4U AdTurtle EA MT4
COSMOS4U - D. Vezeris & Co, L.P.
COSMOS4U AdTurtle Expert Advisor is based on the now classic Turtle trading system introduced by Richard Dennis and William Eckhardt. It employs Donchian high/low lines of various periods to decide when to open and close positions. This is an Expert Advisor that can promptly react to sudden trend reversals in everyday trading but is also suitable for executing long-term holding strategies. How it works When the trading mode “Long&Short” is selected, a total of 8 high/low lines are used to open
FREE
CoSMOS4U AdPivot EA MT4
COSMOS4U - D. Vezeris & Co, L.P.
COSMOS4U transforms PIVOT to a powerful trading system using optimal parameters. The system is applied by AdPivot Expert Advisor for MetaTrader trading platforms. The professional user can customize the system by variable parameters so as to achieve best performance. It is enhanced with Take Profit and Stop Loss features. Features Trade like a custom PIVOT Full risk control Margin management Take Profit based on a controlled parameter Stop Loss based on the variation of the symbol Multi asset
FREE
ADXPivot NZDUSD
COSMOS4U - D. Vezeris & Co, L.P.
Financial freedom with realistic mindset New product by COSMOS4U ADXPivot NZDUSD                                                                                                                                                                                                                                                                                                     The needs of the average investor for financial freedom by using reliable and realistic products are greater than eve
FREE
CoSMOS4U AdPivot MT4
COSMOS4U - D. Vezeris & Co, L.P.
COSMOS4U Adaptive Pivot Indicator, is a straightforward and effective way to optimize your trade decisions. It can be easily customized to fit any strategy. Get an insight into the following features, incorporated in COSMOS4U Adaptive Pivot: Three ways of monitoring trades (Long, Short, Long and Short), Periods used to calculate high and low close prices in order to declare opening position before or after Take Profit, All timeframes supported (M1, M15, H1, H4, D, W, M…), All symbols, Colors for
FREE
COSMOS4U AdMACD EA MT4
COSMOS4U - D. Vezeris & Co, L.P.
COSMOS4U transforms MACD into a powerful trading system using optimal parameters. The professional user can customize the system by various parameters so as to achieve optimal performance. Apart from the fast, slow & signal customizable parameters of the classic MACD, it is also enhanced with take profit and stop loss capabilities. Every week the COSMOS4U research department publishes new recommended parameters for the popular exchange rates in Forex market, for the hourly H1 timeframe. The comp
FREE
CoSMOS4U AdTurtle MT4
COSMOS4U - D. Vezeris & Co, L.P.
The COSMOS4U AdTurtle is an indicator based on the now classic Turtle trading system. The various high and low Donchian lines around the price bars show you when to open or close your positions. These lines indicate levels which result in the opening or closing of a respective position when the price crosses through them. By default, the new position barriers are drawn as solid lines and the exit barriers are drawn as dashed lines. The new long position lines and the close short position lines a
FREE
ADXPivot UsdChf MT4
COSMOS4U - D. Vezeris & Co, L.P.
Financial freedom with realistic mindset New product by COSMOS4U ADXPivot USDCHF                                                                                                                                                                                                                                                                                                     The needs of the average investor for financial freedom by using reliable and realistic products are greater than eve
FREE
ADXPivot NzdUsd MT4
COSMOS4U - D. Vezeris & Co, L.P.
Financial freedom with realistic mindset New product by COSMOS4U ADXPivot NZDUSD                                                                                                                                                                                                                                                                                                     The needs of the average investor for financial freedom by using reliable and realistic products are greater than eve
FREE
CoSMOS4U AdPivot MT5
COSMOS4U - D. Vezeris & Co, L.P.
COSMOS4U Adaptive Pivot Indicator, is a straightforward and effective way to optimize your trade decisions. It can be easily customized to fit any strategy. Get an insight into the following features, incorporated in COSMOS4U Adaptive Pivot: Three ways of monitoring trades (Long, Short, Long and Short), Periods used to calculate high and low close prices in order to declare opening position before or after Take Profit, All timeframes supported (M1, M15, H1, H4, D, W, M…), All symbols, Colors for
FREE
Filtro:
sdiseye
184
sdiseye 2021.03.20 09:33 
 

Indicator did not perform as advertised and the author would not respond to enquiries. I will definitely not recommend this indicator to anyone

Responder ao comentário
Versão 2.70 2017.10.31
There are code optimization and style modifications.
Versão 2.60 2016.10.03
COSMOS4U Volume Indicator and COSMOS4U AdMACD Configuration utility synchronization upgrade
From now on you can update the indicator using the AdMACD Trading System Configuration utility.
Watch on https://youtu.be/gfDX1-AvTwk
Versão 2.51 2016.09.08
Trend lines and objects deletion fixed.
Versão 2.50 2016.09.01
There are code optimization and style modifications.
Versão 2.0 2016.02.03
New features:
Second moving average.
Option for real or tick volume.

Removed:
COSMOS4U chart style