• Visão global
  • Comentários
  • Discussão

Trend Approximator

The Trend Approximator indicator is a powerful trend indicator that helps traders identify turning points in the Forex market. Here are the main characteristics and parameters of this indicator:

Main characteristics:

Trend Indicator: Trend Approximator is a trend indicator that helps determine the direction of the current trend and identify potential reversal points.

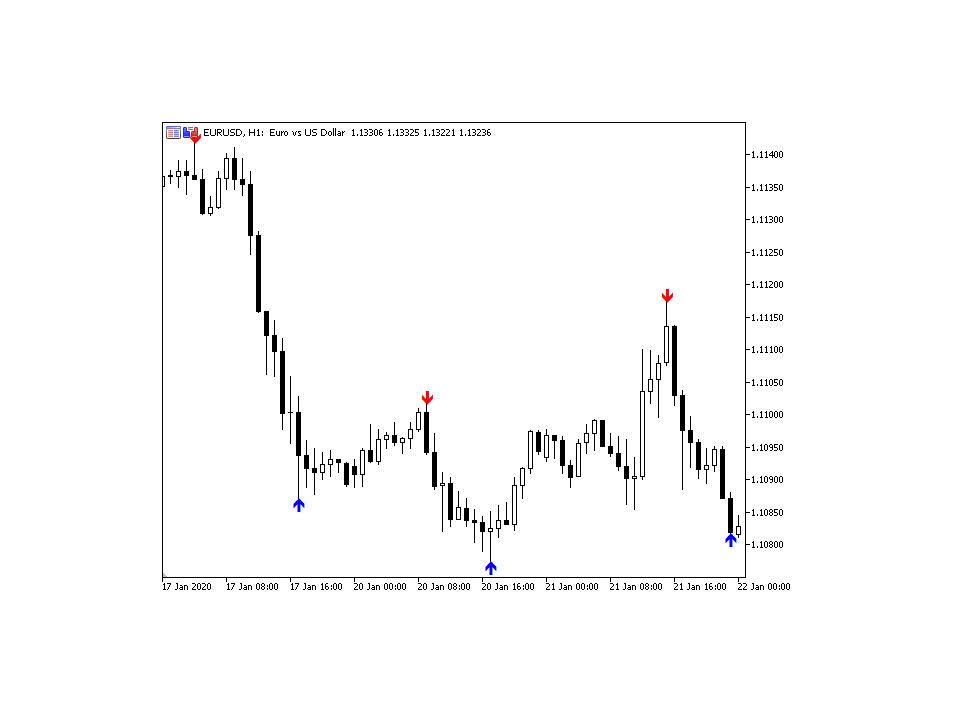
Finding Pivot Points: It searches for and displays pivot points on a price chart, allowing traders to react to changes in the market trend.

Noise Reduction: The purpose of developing the indicator is to provide signals with less noise, making it more efficient and reliable to use.

Indicator parameters (customizable):

HistoryDepth: History depth that is taken into account when calculating the indicator. This parameter can affect the accuracy of signals and the speed of reaction to trend changes.

MaxRange: The maximum size of candles taken into account in the analysis. This setting allows you to control what data is used for calculations.

MinimumRange: Minimum size of candles for analysis. This parameter helps filter out noise and focus on more significant price movements.

GlobalTrend: Option to display the global trend. This can be useful for traders who want to see the general direction of the market on a chart.

Signals and Alerts:

UseAlerts: Ability to display alerts. This means that the indicator can output audio or visual signals on the chart when signals are detected.

UseSendMail: Sending E-mail messages to mail when signals are triggered. This is convenient for traders who want to receive notifications to their email.

UseSendPush: Send Push notifications to a mobile device. This makes it possible to keep abreast of market events even outside the workplace.

Usage:

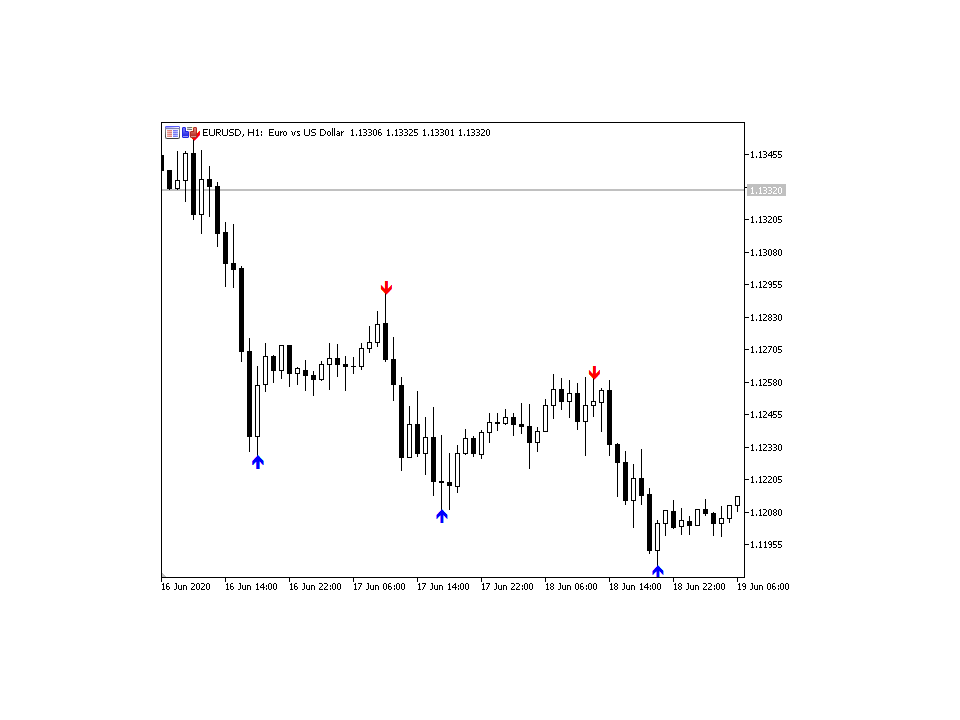
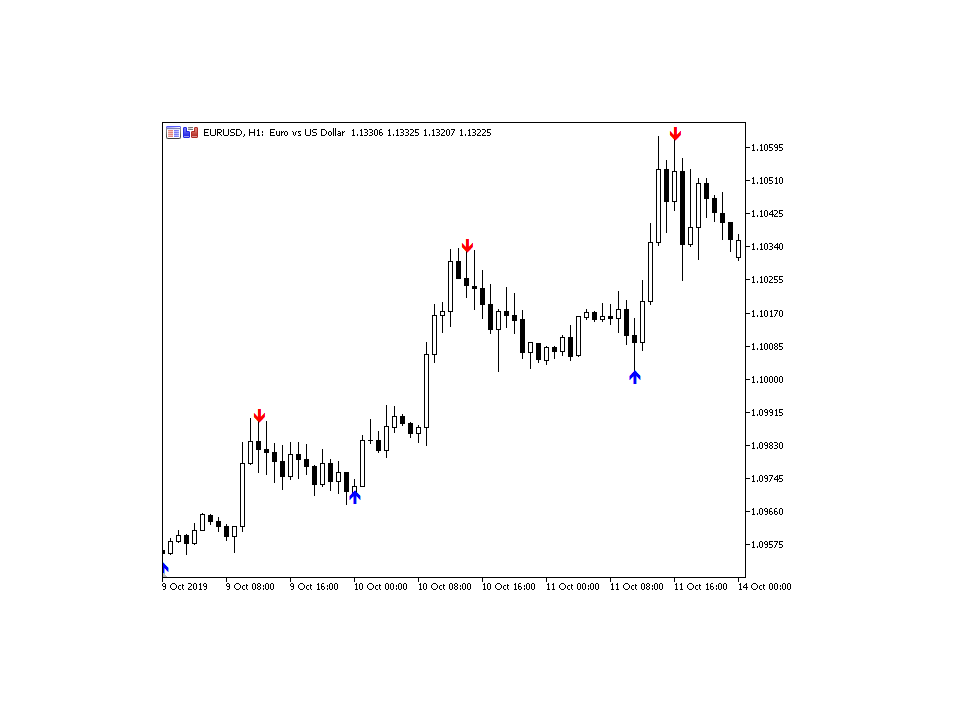
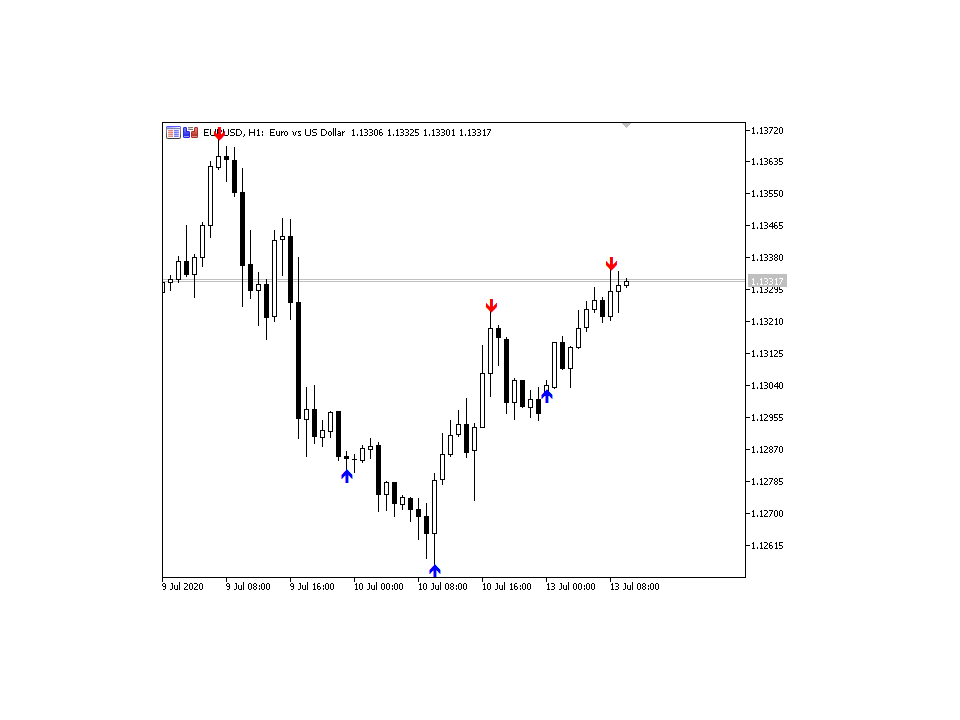
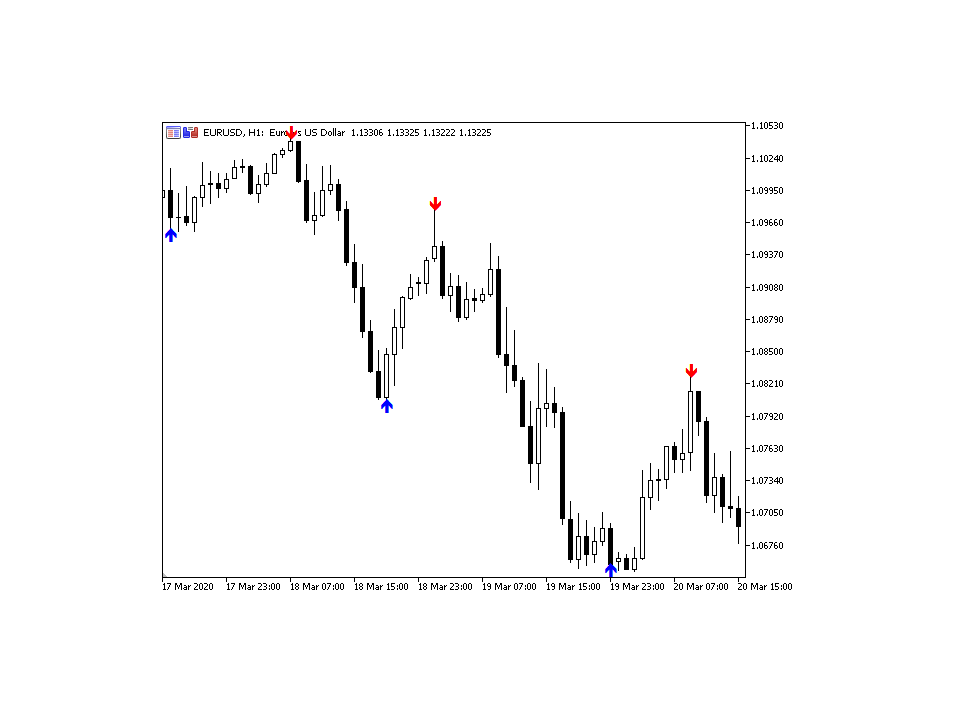
Entry Point: The Trend Approximator indicator provides signals about possible turning points. The trader can use these signals to make decisions about entering a trade.

Additional tool: The indicator should be used as an additional tool to confirm signals from other technical indicators or strategies.

Signals: A blue signal indicates a possible upward reversal, a red one, on the contrary, a downward reversal. The stronger the signal (larger digital value), the more likely a reversal is.

The Trend Approximator indicator helps traders effectively use trend analysis to make decisions in the Forex market, providing more accurate signals and alerts about possible reversals.
Produtos recomendados
Mine Farm
Maryna Kauzova
Mine Farm is one of the most classic and time-tested scalping strategies based on the breakdown of strong price levels. Mine Farm is the author's modification of the system for determining entry and exit points into the market... Mine Farm - is the combination of great potential with reliability and safety. Why Mine Farm?! - each order has a short dynamic Stop Loss - the advisor does not use any risky methods (averaging, martingale, grid, locking, etc.) - the advisor tries to get the most
Your Trend Friend
Luigi Nunes Labigalini
5 (1)
A tendência é sua amiga! Veja a cor do indicador e faça suas operações nessa direção. Ele não repinta. Ou seja, depois que cada candle se fecha, a cor dele é definitiva e não irá se alterar. Você pode focar em movimentos mais curtos e rápidos ou tendências mais longas, basta testar o que melhor se encaixa no seu operacional de acordo com o ativo e tempo gráfico usado. Altere o parâmetro de entrada "Length" e o indicador irá se adaptar automaticamente (quanto maior ele for, maior a tendência an
SolarTrade Suite Financial Robot: LaunchPad Market Expert - concebido para abrir negociações! Este é um robô comercial que utiliza algoritmos especiais inovadores e avançados para calcular os seus valores, o seu assistente no mundo dos mercados financeiros. Utilize o nosso conjunto de indicadores da série SolarTrade Suite para escolher melhor o momento de lançamento deste robô. Veja os nossos outros produtos da série SolarTrade Suite na parte inferior da descrição. Quer navegar com confiança
O Captador de Tendências: A Estratégia do Captador de Tendências com Indicador de Alerta é uma ferramenta versátil de análise técnica que auxilia os traders na identificação de tendências de mercado e potenciais pontos de entrada e saída. Apresenta uma Estratégia dinâmica do Captador de Tendências, adaptando-se às condições do mercado para uma representação visual clara da direção da tendência. Os traders podem personalizar os parâmetros de acordo com suas preferências e tolerância ao risco. O
FREE
High Low Open Close
Alexandre Borela
4.98 (42)
Se você gosta deste projeto, deixe uma revisão de 5 estrelas. Este indicador desenha os preços abertos, altos, baixos e finais para o especificado período e pode ser ajustado para um fuso horário específico. Estes são níveis importantes olhados por muitos institucional e profissional comerciantes e pode ser útil para você saber os lugares onde eles podem ser mais activa. Os períodos disponíveis são: Dia anterior. Semana anterior. Mês anterior. Quarto anterior. Ano anterior. Ou: Dia atual. Seman
FREE
ProEngulfing For MT5
Ashkan Hazegh Nikrou
Versão gratuita do ProEngulfing é o QualifiedEngulfing, com limitação de um sinal por dia e menos funcionalidades. Junte-se ao canal Koala Trading Solution na comunidade mql5 para saber as últimas novidades sobre todos os produtos Koala. Link de adesão: https ://www .mql5 .com /en /channels /koalatradingsolution A versão MT4 deste produto já está disponível para download no link abaixo: https ://www .mql5 .com /en /market /product /52023 Apresentando o ProEngulfing – Seu indicador profissional
Owl Smart Levels MT5
Sergey Ermolov
4.07 (28)
Versão MT4  |  FAQ O Indicador Owl Smart Levels é um sistema de negociação completo dentro de um indicador que inclui ferramentas populares de análise de mercado, como fractais avançados de Bill Williams , Valable ZigZag que constrói a estrutura de onda correta do mercado e níveis de Fibonacci que marcam os níveis exatos de entrada no mercado e lugares para obter lucros. Descrição detalhada da estratégia Instruções para trabalhar com o indicador Consultor de negociação Owl Helper Chat privado d
Value Chart Candlesticks
Flavio Javier Jarabeck
4.73 (11)
The idea of a Value Chart indicator was presented in the very good book I read back in 2020 , " Dynamic Trading Indicators: Winning with Value Charts and Price Action Profile ", from the authors Mark Helweg and David Stendahl. The idea is simple and the result is pure genius: Present candlestick Price analysis in a detrended way! HOW TO READ THIS INDICATOR Look for Overbought and Oversold levels. Of course, you will need to test the settings a lot to find the "correct" one for your approach. It
FREE
This indicator has been developed to identify and display these trends quickly and easily, allowing you to see instantly, those currency pairs which are trending, and those which are not – and in all timeframes, with just one click. The 28 currency pairs are displayed as a fan as they sweep from strong to weak and back again, and this is why we call it the ‘currency array’. All 28 pairs are arrayed before you, giving an instant visual description of those pairs that are trending strongly, those
Antes de tudo, vale ressaltar que esta Ferramenta de Negociação é um Indicador Não Repintante, Não Redesenhante e Não Atrasado, o que a torna ideal para negociação profissional. Curso online, manual do utilizador e demonstração. O Indicador de Conceitos de Ação de Preço Inteligente é uma ferramenta muito poderosa tanto para traders novos quanto experientes. Ele combina mais de 20 indicadores úteis em um único, combinando ideias avançadas de negociação como Análise do Trader do Círculo Interno
O indicador cria cotações atuais, que podem ser comparadas com as históricas e, com base nisso, fazer uma previsão do movimento dos preços. O indicador possui um campo de texto para navegação rápida até a data desejada. Opções: Símbolo - seleção do símbolo que o indicador exibirá; SymbolPeriod - seleção do período do qual o indicador coletará dados; IndicatorColor - cor do indicador; HorisontalShift - deslocamento das cotações desenhadas pelo indicador pelo número especificado de barras; I
Indicador único que implementa uma abordagem profissional e quantitativa para significar negociação de reversão. Ele capitaliza o fato de que o preço desvia e retorna à média de maneira previsível e mensurável, o que permite regras claras de entrada e saída que superam amplamente as estratégias de negociação não quantitativas. [ Installation Guide | Update Guide | Troubleshooting | FAQ | All Products ] Sinais de negociação claros Incrivelmente fácil de negociar Cores e tamanhos personalizáveis
Was: $249  Now: $149   Market Profile defines a number of day types that can help the trader to determine market behaviour. A key feature is the Value Area, representing the range of price action where 70% of trading took place. Understanding the Value Area can give traders valuable insight into market direction and establish the higher odds trade. It is an excellent addition to any system you may be using. Inspired by Jim Dalton’s book “Mind Over Markets”, this indicator is designed to suit the
Este é um indicador de agressão comprador e vendedor que analisa o formato de cada vela e projeta esses dados em forma de histograma. Há 4 histogramas em um só. Na parte frontal temos dois: Superior - força compradora Inferior - força vendedor Na parte de trás temos também dois histogramas, ambos da mesma cor. Eles medem a força conjunta dos compradores e vendedores. Esses histogramas podem ser desativados nos Parâmetros de Entrada. É possível também ter o volume real ou de tick para fazer essa
FREE
Market Profile 3 ForexArby com
Hussien Abdeltwab Hussien Ryad
3.93 (14)
Market Profile 3 MetaTrader 5 indicator  version 4.70— is a classic Market Profile implementation that can show the price density over time, outlining the most important price levels, value area, and control value of a given trading session. This indicator can be attached to timeframes between M1 and D1 and will show the Market Profile for daily, weekly, monthly, or even intraday sessions. Lower timeframes offer higher precision. Higher timeframes are recommended for better visibility. It is als
FREE
Order Book, known also as Market Book, market depth, Level 2, - is a dynamically updated table with current volumes of orders to buy and to sell specific financial instument at price levels near Bid and Ask. MetaTrader 5 provides the means for receiving market book from your broker, but in real time only, without access to its history. The indicator OrderBook Cumulative Indicator accumulates market book data online and visualizes them on the chart. In addition, the indicator can show the market
The Penta-O is a 6-point retracement harmonacci pattern which usually precedes big market movements. Penta-O patterns can expand and repaint quite a bit. To make things easier this indicator implements a twist: it waits for a donchian breakout in the right direction before signaling the trade. The end result is an otherwise repainting indicator with a very reliable trading signal. The donchian breakout period is entered as an input. [ Installation Guide | Update Guide | Troubleshooting | FAQ | A
GoldTrader
Yashar Seyyedin
Please backtest with the exact balance of your live account before applying to real money. ==> If account balance is too low it may not trade at all! For MT4 version please contact via private message. martingale version is available here . Strategy description - Detect trend based on EMA18-EMA50-SMA200 alignment in three time frames: M15, H1, H4 - Trade in trend direction and exit when above alignment is broken. - The bot is tuned to trade XAUUSD(Gold). - The bot output is break even in rangin
FREE
Show Pips for MT5
Roman Podpora
4.67 (21)
Este indicador de informação será útil para quem quer estar sempre atento à situação atual da conta. -   Indicadores mais úteis O indicador exibe dados como lucro em pontos, porcentagem e moeda, bem como o spread do par atual e o tempo até o fechamento da barra no período atual. Existem várias opções para colocar a linha de informação no gráfico: À direita do preço (corre atrás do preço); Como comentário (no canto superior esquerdo do gráfico); No canto selecionado da tela. Também é possível se
FREE
Perfect Sniper
Ignacio Agustin Mene Franco
Perfect Sniper! is a triple indicator with support resistance detection, downtrend channel, uptrend channel Bands included! where he hunts the rebounds in the red lines for sale, in the green lines mark purchase, in the lower bands that are the breaks gives another second entry either buy or sell, perfect to take advantage of the double entrance, It is used in any temporality, It is used to scalp and long on h1 or h4 to D1. It works for Forex markets, All pairs. It is used for the synthetic inde
Green Power
Ignacio Agustin Mene Franco
Black Card Pack indicator 5/3 Green power It has the high and low breakout strategy giving the signal with the red or green dot the red dot for short and the green dot for long , perfect for forex markets and synthetic index markets, works for all seasons It is used for scalping and intraday! Ideal for Crash and boom markets!! Volatilitys y jumps !! Micro y macro en forex !
Point Black
Ignacio Agustin Mene Franco
Black Card Pack indicator 5/1 point black It has the strategy of professional bollingers where each arrow gives you a different entry signal. It is used to operate in m1 and in d1 It is used for scalping and intraday, modified for forex markets ! suitable for all pairs modified for synthetic index markets suitable for all pairs! Ideal for volatility and jumps!
Flow Bookmap
Thalles Nascimento De Carvalho
Flow Bookmap: Visualize o Fluxo de Mercado e Proteja Seu Operacional ️ QUER DOMINAR O MERCADO COM INFORMAÇÕES PRECISAS SOBRE COMPRADORES E VENDEDORES? O Flow Bookmap é a ferramenta definitiva para traders que buscam entender o comportamento do mercado em profundidade. Ele transforma os dados do fluxo de ordens em uma interface intuitiva no gráfico do MT5, destacando regiões de interesse crítico para decisões rápidas e seguras. Como Funciona? O Flow Bookmap interpreta a interação entre
Noize Absorption Index - is the manual trading system that measures the difference of pressure between bears forces and bulls forces. Green line - is a noize free index that showing curent situation. Zero value of index shows totally choppy/flat market.Values above zero level shows how powerfull bullish wave is and values below zero measures bearish forces.Up arrow appears on bearish market when it's ready to reverse, dn arrow appears on weak bullish market, as a result of reverse expectation.
Follow The Line MT5
Oliver Gideon Amofa Appiah
4.52 (29)
This indicator obeys the popular maxim that: "THE TREND IS YOUR FRIEND" It paints a GREEN line for BUY and also paints a RED line for SELL. (you can change the colors). It gives alarms and alerts of all kinds. IT DOES NOT REPAINT and can be used for all currency pairs and timeframes. Yes, as easy and simple as that. Even a newbie can use it to make great and reliable trades. NB: For best results, get my other premium indicators for more powerful and reliable signals. Get them here: https://www.m
FREE
O indicador   "Haven Key Levels PDH PDL"   ajuda os traders a visualizar os níveis chave no gráfico. Ele marca automaticamente os seguintes níveis: DO (Daily Open)   — nível de abertura do dia. NYM (New York Midnight)   — nível da meia-noite de Nova York. PDH (Previous Day High)   — máxima do dia anterior. PDL (Previous Day Low)   — mínima do dia anterior. WO (Weekly Open)   — nível de abertura da semana. MO (Monthly Open)   — nível de abertura do mês. PWH (Previous Week High)   — máxima da sem
FREE
STRICTLY FOR BOOM INDEX ONLY!!!!! Here I bring the Maximum Trend Arrows OT1.0 MT5 indicator. This indicator is made up of a combination of different trend indicators for entries and exits, for entries an orange arrow will paint on the chart below the current market and a red flag for closing of trades and it produces buy arrows only. When the orange arrow appears, it will appear along with it's sound to notify you. The 1H timeframe is recommended, don't use it anywhere else than on the 1H timefr
Introducing   Order Blocks Breaker , a brand-new way to identify and leverage order blocks in your trading strategy. After developing multiple order block tools with unique concepts, I’m proud to present this tool that takes things to the next level. Unlike previous tools,   Order Blocks Breaker   not only identifies order blocks but also highlights   Breaker Order Blocks —key areas where the price is likely to retest after a breakout. MT4 -  https://www.mql5.com/en/market/product/124101/ This t
WaveTrend Plus
Nguyen Thanh Cong
5 (5)
Introduction WaveTrend Plus is an amazing oscillator that can detect optimal entry points in the market with high precision using complex computations of price and momentum. This version packs many improvements compared to the original WaveTrend such as cleaner visuals, oversold/overbought signals and divergence detection Signal Buy when oversold signal appear (green dot below) or when a bullish divergence is detected (green dashed line) Sell when overbought signal appear (red dot above) or
FREE
Trading Utility for Forex Currency Pairs Only not for Gold  Functions Auto Lot Calculation based on Risk Auto stoploss  Auto TakeProfit Breakeven Auto Close Half % Close in percentage with respect to the PIPs Pending Orders BuyLimit Sell Limit with distances BuyStop Sell Stop    with distances Trading Informations Risk in percentage For Multiple trades Combine Takeprofit and Combine Stoplosses
Os compradores deste produto também adquirem
TPSproTREND PrO MT5
Roman Podpora
4.71 (17)
TPSpro TREND PRO  - is a trend indicator that automatically analyzes the market and provides information about the trend and each of its changes, as well as giving signals for entering trades without redrawing! The indicator uses each candle, analyzing them separately. referring to different impulses - up or down impulse. Exact entry points into transactions for currencies, crypto, metals, stocks, indices!  ИНСТРУКЦИЯ RUS         INSTRUCTIONS  ENG       R ecommended to use with an indicator   -
TPSpro RFI Levels MT5
Roman Podpora
4.53 (19)
INSTRUÇÕES         Russo   -        ENG       R   ecomendado para uso com um indicador       -       TPSpro   TREND PRO -   Versão MT4         Um elemento-chave na negociação são as zonas ou níveis a partir dos quais as decisões de comprar ou vender um instrumento de negociação são tomadas. Apesar das tentativas dos principais participantes de esconder sua presença no mercado, eles inevitavelmente deixam rastros. Nossa tarefa era aprender como identificar esses rastros e interpretá-los corretame
This indicator is based on the mathematics of the great trader W.D. Ganna. With its help, you can easily find strong levels by analyzing swings to find the optimal entry point. The indicator works on all instruments and all timeframes. The indicator is fully manual and has control buttons. All you need to do is press the NEW button, a segment will appear, which you can place on any movement, swing or even 1 candle that you want to analyze. By placing the segment, press the OK button. A grid (th
Este é um indicador para MT5 que fornece sinais precisos para entrar em uma negociação sem redesenhar. Ele pode ser aplicado a qualquer ativo financeiro: forex, criptomoedas, metais, ações, índices. Ele fornecerá estimativas bastante precisas e informará quando é melhor abrir e fechar um negócio. Assista o vídeo (6:22) com um exemplo de processamento de apenas um sinal que compensou o indicador! A maioria dos traders melhora seus resultados de negociação durante a primeira semana de negociação c
This indicator identifies and displays zones, as it were areas of strength, where the price will unfold. The indicator can work on any chart, any instrument, at any timeframe. The indicator has two modes. The indicator is equipped with a control panel with buttons for convenience and split into two modes. Manual mode: To work with manual mode, you need to press the NEW button, a segment will appear. This segment is stretched over the movement and the LVL button is pressed. The level is displayed
PZ Trend Trading MT5
PZ TRADING SLU
3.8 (5)
O Trend Trading é um indicador projetado para lucrar o máximo possível com as tendências que ocorrem no mercado, cronometrando retrocessos e rupturas. Ele encontra oportunidades de negociação analisando o que o preço está fazendo durante as tendências estabelecidas. [ Guia de instalação | Guia de atualização | Solução de problemas | FAQ | Todos os produtos ] Negocie mercados financeiros com confiança e eficiência Lucre com as tendências estabelecidas sem ser chicoteado Reconhecer retrocessos
Quantum TrendPulse
Bogdan Ion Puscasu
5 (13)
Apresentando   Quantum TrendPulse   , a ferramenta de negociação definitiva que combina o poder do   SuperTrend   ,   RSI   e   Stochastic   em um indicador abrangente para maximizar seu potencial de negociação. Projetado para traders que buscam precisão e eficiência, este indicador ajuda você a identificar tendências de mercado, mudanças de momentum e pontos de entrada e saída ideais com confiança. Principais características: Integração SuperTrend:   siga facilmente a tendência predominante do
MetaForecast M5
Vahidreza Heidar Gholami
5 (3)
MetaForecast prevê e visualiza o futuro de qualquer mercado com base nas harmonias nos dados de preços. Embora o mercado nem sempre seja previsível, se houver um padrão nos preços, o MetaForecast pode prever o futuro com a maior precisão possível. Em comparação com outros produtos similares, o MetaForecast pode gerar resultados mais precisos ao analisar as tendências do mercado. Parâmetros de entrada Past size (Tamanho do passado) Especifica o número de barras que o MetaForecast usa para criar
RelicusRoad Pro MT5
Relicus LLC
4.78 (18)
Agora US $ 147 (aumentando para US $ 499 após algumas atualizações) - Contas ilimitadas (PCs ou Macs) Manual do usuário do RelicusRoad + vídeos de treinamento + acesso ao grupo de discórdia privado + status VIP UMA NOVA FORMA DE OLHAR PARA O MERCADO O RelicusRoad é o indicador de negociação mais poderoso do mundo para forex, futuros, criptomoedas, ações e índices, oferecendo aos traders todas as informações e ferramentas necessárias para se manterem rentáveis. Fornecemos análises técnicas e
Timeframes Trend Scanner is a trend analyzer or trend screener indicator that helps you know the trend in all timeframes of symbol you're watching. This indicator provides clear & detailed analysis results on a beautiful dashboard, let you able to use this result right away without need to do any additional analysis. Please note that this indicator doesn't work with Strategy Tester. Sorry for that! How it works Step 1: Calculate values of 23 selected & trusted technical indicators (Oscillator &
EXCLUSIVE! JUST  10 COPIES  AVAILABLE!   BONUS AUX VIP Club 2024 : Include EA CAP, CEP, LDH, PSC307 & AO4C to enhance the performance of this tool to its maximum potential  Click Here to Download Files   ( for users only ) FREE Trading Education Available Daily via Zoom --- For More Info or Instant Message Click link ---  https://t.me/abcdwave Transform your trading with the "Five Magic Bullets" Indicator, tailored for traders who embrace the power of Elliott Wave Chaos Theory.
PZ Swing Trading MT5
PZ TRADING SLU
5 (5)
Swing Trading é o primeiro indicador projetado para detectar oscilações na direção da tendência e possíveis oscilações de reversão. Ele usa a abordagem de negociação de linha de base, amplamente descrita na literatura de negociação. O indicador estuda vários vetores de preço e tempo para rastrear a direção da tendência agregada e detecta situações nas quais o mercado está sobrevendido ou sobrecomprado em excesso e pronto para corrigir. [ Guia de instalação | Guia de atualização | Solução de prob
CBT Quantum Maverick Sistema de Negociação de Opções Binárias de Alta Eficiência O CBT Quantum Maverick é um sistema de opções binárias de alto desempenho, projetado para traders que buscam precisão, simplicidade e um enfoque disciplinado. Não exige personalização: o sistema está otimizado para resultados eficazes desde o início. Basta seguir os sinais, que podem ser dominados com um pouco de prática. Principais características: Precisão nos sinais: Sinais baseados na próxima vela, utilizando
Royal Scalping Indicator M5
Vahidreza Heidar Gholami
5 (6)
Royal Scalping Indicator is an advanced price adaptive indicator designed to generate high-quality trading signals. Built-in multi-timeframe and multi-currency capabilities make it even more powerful to have configurations based on different symbols and timeframes. This indicator is perfect for scalp trades as well as swing trades. Royal Scalping is not just an indicator, but a trading strategy itself. Features Price Adaptive Trend Detector Algorithm Multi-Timeframe and Multi-Currency Trend Low
CONTACT US  after purchase to get the Indicator Manual. Try Now—Limited 50% Discount for First 10 Buyers! Download the  Metatrader 4 Version Read the product description carefully before purchasing the product.  Due to regulatory restrictions, our service is unavailable in certain countries such as India, Pakistan, and Bangladesh. William Delbert Gann (W.D. Gann) was an exceptional market analyst, whose trading technique was based on a complex blend of mathematics, geometry, astrology, and anc
Introduction to Fractal Pattern Scanner Fractal Indicator refers to the technical indicator that makes use of the fractal geometry found in the financial market. Fractal Pattern Scanner is the advanced Fractal Indicator that brings the latest trading technology after the extensive research and development work in the fractal geometry in the financial market. The most important feature in Fractal Pattern Scanner is the ability to measure the turning point probability as well as the trend probabil
Hello I Want to introduce The Forex Buy Sell Arrow Premium MT5 i recently release this premium indicator! its 1000% Non Repaint Indicator, It Work Perfectly Well,, i tested it day by day, Just mind blowing Result,  Including Powerful trend Algorithm! How It Work? well, it work market trend formula, when trend Bullish Or when trend Bearish,  Recommend Timeframe M30, H1 it work all timeframe, and all currency pair, 100% non repaint, How to take signal From Forex Buy Sell Arrow Premium Ind
Royal Wave Pro M5
Vahidreza Heidar Gholami
3.5 (4)
Royal Wave is a Trend-Power oscillator which has been programmed to locate and signal low-risk entry and exit zones. Its core algorithm statistically analyzes the market and generates trading signals for overbought, oversold and low volatile areas. By using a well-designed alerting system, this indicator makes it easier to make proper decisions regarding where to enter and where to exit trades. Features Trend-Power Algorithm Low risk Entry Zones and Exit Zones Predictions for Overbought and Over
Golden Spikes Detector
Batsirayi L Marango
3.25 (4)
Golden Spikes Detector Este indicador é baseado em uma estratégia avançada principalmente para picos de negociação nos índices Boom e Crash. Algoritmos complexos foram implementados para detectar apenas entradas de alta probabilidade. Ele alerta sobre possíveis entradas de compra e venda. Para negociar picos na corretora Deriv ou Binária, receba apenas os alertas Buy Boom e Sell Cash. Ele foi otimizado para ser carregado em um período de 5 minutos, embora a análise de vários períodos de tempo se
Quantum Trend Sniper
Bogdan Ion Puscasu
4.73 (51)
Apresentando       Quantum Trend Sniper Indicator   , o inovador Indicador MQL5 que está transformando a maneira como você identifica e negocia as reversões de tendência! Desenvolvido por uma equipe de traders experientes com experiência comercial de mais de 13 anos,       Indicador de Atirador de Tendência Quântica       foi projetado para impulsionar sua jornada de negociação a novos patamares com sua forma inovadora de identificar reversões de tendência com precisão extremamente alta. ***Com
Apresentando       Quantum Breakout PRO   , o inovador Indicador MQL5 que está transformando a maneira como você negocia Breakout Zones! Desenvolvido por uma equipe de traders experientes com experiência comercial de mais de 13 anos,       Quantum Breakout PRO       foi projetado para impulsionar sua jornada comercial a novos patamares com sua estratégia de zona de fuga inovadora e dinâmica. O Quantum Breakout Indicator lhe dará setas de sinal em zonas de breakout com 5 zonas-alvo de lucro e su
TPA True Price Action indicator reveals the true price action of the market makers through 100% non-repainting signals strictly at the close of a candle! TPA shows entries and re-entries, every time the bulls are definitely stronger than the bears and vice versa. Not to confuse with red/green candles. The shift of power gets confirmed at the earliest stage and is ONE exit strategy of several. There are available now two free parts of the TPA User Guide for our customers. The first "The Basics"
FxaccurateLS
Shiv Raj Kumawat
WHY IS OUR FXACCCURATE LS MT5 THE PROFITABLE ? PROTECT YOUR CAPITAL WITH RISK MANAGEMENT Gives entry, stop and target levels from time to time. It finds Trading opportunities by analyzing what the price is doing during established trends. POWERFUL INDICATOR FOR A RELIABLE STRATEGIES We have made these indicators with a lot of years of hard work. It is made at a very advanced level. Established trends provide dozens of trading opportunities, but most trend indicators completely ignore them! The
AT Forex Indicator MT5
Marzena Maria Szmit
5 (5)
The AT Forex Indicator MT5 is a sophisticated trading tool designed to provide traders with a comprehensive analysis of multiple currency pairs. This powerful indicator simplifies the complex nature of the forex market, making it accessible for both novice and experienced traders. AT Forex Indicator uses advanced algorithms to detect trends, patterns and is an essential tool for traders aiming to enhance their forex trading performance. With its robust features, ease of use, and reliable signal
Este é sem dúvida o indicador de reconhecimento automático de formação de preço harmônico mais completo que você pode encontrar para a MetaTrader Platform. Ele detecta 19 padrões diferentes, leva as projeções de Fibonacci tão a sério quanto você, exibe a Zona de Reversão Potencial (PRZ) e encontra níveis adequados de stop loss e take-profit. [ Guia de instalação | Guia de atualização | Solução de problemas | FAQ | Todos os produtos ] Detecta 19 formações harmônicas de preços diferentes Traça
Elliott Wave Trend was designed for the scientific wave counting. This tool focuses to get rid of the vagueness of the classic Elliott Wave Counting using the guideline from the template and pattern approach. In doing so, firstly Elliott Wave Trend offers the template for your wave counting. Secondly, it offers Wave Structural Score to assist to identify accurate wave formation. It offers both impulse wave Structural Score and corrective wave Structure Score. Structural Score is the rating to sh
BookMap HeatMap
Roberto Spadim
1 (2)
This Indicator creates a heatmap based on depth of market of the current symbol or another symbol. Other symbol is useful when you trade futures market and a contract has 'mini' and 'full' split. For example, in Brazil (B3 - BMF&Bovespa), WDO and DOL are future Forex contract of BRL/USD (where 1 DOL = 5 WDO) and big banks work mostly with DOL (where liquidity is important). Please use with M1 timeframe , objects are too small to be displayed at higher timeframes (MT5 limit). The number of level
KT Renko Patterns MT5
KEENBASE SOFTWARE SOLUTIONS
O KT Renko Patterns analisa o gráfico Renko tijolo por tijolo para identificar padrões gráficos conhecidos que são amplamente utilizados por traders em diversos mercados financeiros. Em comparação com gráficos baseados em tempo, os gráficos Renko tornam a identificação de padrões muito mais fácil e visualmente clara, graças à sua aparência limpa e objetiva. O KT Renko Patterns possui vários padrões Renko, muitos dos quais são explicados com profundidade no livro "Profitable Trading with Renko
Advanced Supply Demand MT5
Bernhard Schweigert
4.5 (14)
Atualmente com 33% de desconto! A melhor solução para qualquer Trader Novato ou especialista! Este indicador é uma ferramenta de negociação exclusiva, de alta qualidade e acessível porque incorporamos uma série de recursos proprietários e uma nova fórmula. Com esta atualização, você poderá mostrar fusos horários duplos. Você não só será capaz de mostrar um TF mais alto, mas também mostrar ambos, o TF do gráfico, MAIS o TF mais alto: MOSTRANDO ZONAS ANINHADAS. Todos os traders de Oferta e Demanda
Blahtech Supply Demand MT5
Blahtech Limited
4.54 (13)
Was: $299  Now: $149  Supply Demand uses previous price action to identify potential imbalances between buyers and sellers. The key is to identify the better odds zones, not just the untouched ones. Blahtech Supply Demand indicator delivers functionality previously unavailable on any trading platform. This 4-in-1 indicator not only highlights the higher probability zones using a multi-criteria strength engine, but also combines it with multi-timeframe trend analysis, previously confirmed swings
Mais do autor
Gyroscopes mt5
Nadiya Mirosh
5 (2)
Gyroscope        professional forex expert   (for EURUSD, GBPUSD, USDJPY, AUDUSD, USDCHF, EURGBP, EURJPY, NZDUSD, USDCAD, EURCHF, AUDJPY, CADJPY pairs)   alyzing the market using the Elliot Wave Index. Elliott wave theory is the interpretation of processes in financial markets through a system of visual models (waves) on price charts. The author of the theory, Ralph Elliott, identified eight variants of alternating waves (of which five are in the trend and three are against the trend). The mov
Herodotus v5
Nadiya Mirosh
Forex market expert Herodotus applies Elliott Wave theory to analyze the following currency pairs: EURUSD GBPUSD USDJPY AUDUSD USDCHF EURGBP EURJPY NZDUSD USDCAD EURCHF AUDJPY CADJPY Elliott Wave Theory Elliott Wave Theory is a price movement analysis method that represents market trends through repeating wave structures. Ralph Nelson Elliott identified eight types of waves: Five waves (1, 2, 3, 4, 5) form the primary trend movement. Waves 1, 3, and 5 are impulse waves that move with the trend.
Smoking
Nadiya Mirosh
I suggest that everyone who is interested in the Smoking indicator try to trade. Smoking is a technical analysis tool that uses mathematical calculations to determine various aspects of price movement and is based on historical data. Smoking reveals special aspects of price movement and allows traders to make the right decision. All trading indicators analyze the price from different angles based on historical data. Therefore, it is not entirely correct to say that they can predict the future.
Fracture
Nadiya Mirosh
The Fracture indicator uses many moving averages that are with a given Length step. As a result of the work, the resulting lines are formed, which are displayed on the price chart as blue and red lines. The simplest use case for the indicator is to open a trade in the direction of an existing trend. The best result is obtained by combining the indicator with fundamental news; it can act as a news filter, that is, show how the market reacts to this or that news. The indicator lines can also be in
Looking for a quality pivot point indicator? So Prosecution is what you need! To identify pivot points, the Prosecution indicator analyzes many conditions, as the aggregate analysis provides a more accurate picture of the market situation. What are pivot points? Pivot point analysis is often used in conjunction with the calculation of support and resistance levels, as is the case with trend line analysis. When analyzing pivot points, the first support and resistance levels are calculated using
Before
Nadiya Mirosh
The Before indicator predicts the most likely short-term price movement based on complex mathematical calculations. Most of the standard indicators commonly used in trading strategies are based on fairly simple calculations. This does not mean that there were no outstanding mathematicians in the world at the time of their creation. It is just that computers did not yet exist in those days, or their power was not enough for the sequential implementation of complex mathematical operations. Nowad
AnalizatorMTF is an oscillator indicator, a more progressive version of the indicator, with easy customization and ease of use. The following levels are used to identify signals: 0; 0.75 / -0.75; 0.9 / -0.9, as well as the configuration of the indicator curve itself. The difference from other similar indicators is in the pointers of entry points in the form of arrows of the corresponding direction and color and the possibility of displaying higher timeframes on lower ones. The indicator can be
AnalizatorSSRC is an oscillator indicator that is easy to set up and easy to use. The following levels are used to identify signals: 0; 0.75 / -0.75; 0.9 / -0.9, as well as the configuration of the indicator curve itself. Its main difference is the absence of a signal line and signals associated with its intersections. The indicator can be used as part of various strategies. Like other oscillators, it shows trend and flat zones, as well as oversold and overbought areas.
The correlation coefficient reflects the relationship between two values. It shows the dependence of changes in one value on changes in another. For example, from changes in the price of EURUSD and EURNZD. The correlation coefficient in trade, currency relations is constantly changing. Special indicators of correlation help to define it, trace changes, draw correct conclusions. One of them is the Hubbles Correlator indicator. The indicator allows you to simultaneously display several other char
Trend Indicator, a revolutionary trend trading and filtering solution with all the important trend tool features built into one tool! The Step Success indicator is good for any trader, suitable for any trader for both forex and binary options. You do not need to set up anything, everything is perfected with time and experience, it works great during a flat and a trend.
The Analytical cover trend indicator is a revolutionary trend trading and filtering solution with all the important features of a trend tool built into one tool! The Analytical cover indicator is good for any trader, suitable for any trader for both forex and binary options. You don’t need to configure anything, everything is perfected by time and experience, it works great during a flat and in a trend. The Analytical cover trend indicator is a tool for technical analysis of financial markets
What are "pivot points"? Pivot point analysis is often used in conjunction with the calculation of support and resistance levels, as is the case with trend line analysis. Pivot point analysis calculates the first support and resistance levels using the trading range width between the pivot point and the previous day's high or low price. The second support and resistance levels are calculated using the entire width between the previous day's high and low prices. Looking for a quality pivot poin
The Trend Live indicator is a development for trend trading. Trend indicators make it possible to classify the direction of price movement by determining its strength. Solving this problem helps investors enter the market on time and get a good return. The Trend Live indicator helps to analyze the market on the selected time interval. They define the mainstream. Easy to set up and works on all pairs and all time frames. Trend Live is a trend trading and filtering solution with all the important
With the help of the Impulses Enter forex indicator algorithm, you can quickly understand what kind of trend is currently developing in the market. The Elephant indicator accompanies long trends, can be used without restrictions on instruments or timeframes. With this indicator, you can try to predict future values. But the main use of the indicator is to generate buy and sell signals. The indicator tracks the market trend, ignoring sharp market fluctuations and noises around the average price.
Trend Oracle trend indicator, shows entry signals. Displays both entry points and the trend itself. Shows statistically calculated moments for entering the market with arrows. When using the indicator, it is possible to optimally distribute the risk coefficient. The indicator can be used for both short-term pipsing and long-term trading. Uses all one parameter for settings. Length - the number of bars to calculate the indicator. When choosing a parameter, it is necessary to visually similarize s
Using the Trend alternate indicator algorithm, you can quickly understand what kind of trend is currently developing on the market. The Trend Alternate Indicator accompanies lengths, can be used without instruments or timframes. With this indicator, you can try to predict future values. But the main application of the indicator is to generate signals for the purchase and sale. The indicator monitors the market trend with ignoring the sharp fluctuations in the market and the noise around the aver
Bot Speed
Nadiya Mirosh
B ot Speed Forex trading advisor is an automatic scalping system that opens and closes deals using a special tick analysis algorithm programmed in code without human intervention. The main task of the ego is to instantly make a deal where a person loses time for analysis and decision making. They also automate trading, removing the emotional burden from a person and allowing you to save time. Scalping is one of the varieties of short-term strategies, moreover, the shortest of them. Using this t
The Riko Trend indicator is a revolutionary trend trading and filtering solution with all the important features of a trend tool built into one tool! The Riko Trend indicator is good for any trader, suitable for any trader for both forex and binary options. You don’t need to configure anything, everything is perfected by time and experience, it works great during a flat and in a trend. The Riko Trend indicator is a technical analysis tool for financial markets that reflects the current price f
With the help of the Fine Market Forex indicator algorithm, you can quickly understand what kind of trend is currently developing in the market. Fine Market is a combined indicator based on several instruments. Fine Market is based on classic basic technical indicators - MA, RSI, MACD, Bollinger Bands, Stochastic. A trader does not need to impose several lines on Forex charts and set up each indicator separately. Fine Market is already successfully combined and has simplified settings, convenie
It is no secret that the movements of currency pairs for a certain part of the time occur in a certain price corridor, which is called a channel. The lower limit is considered the level of support, the upper one - resistance. Do not confuse with horizontal support and resistance levels! The distance between the support and resistance levels of a channel is called the range or channel width. The key difference between the Channel Mirosh indicator and other channel indicators (for example, from th
With the help of this Practica Trend forex indicator algorithm, you can quickly understand what kind of trend is currently developing in the market. The Practical Trend indicator accompanies long trends, can be used without restrictions on instruments or timeframes. With this indicator, you can try to predict future values. But the main use of the indicator is to generate buy and sell signals. The Practical Trend indicator is used in the forex markets. One of the main definitions for monitorin
Trend analysis is perhaps the most important area of technical analysis and is the key to determining the overall direction of an instrument's movement. The Quest Trend indicator determines the prevailing trend. They help analyze the market on a selected time interval. Trends are based on the principle of higher highs, higher lows (for an uptrend) and lower highs, lower lows (for a downtrend). They can have different time periods and they can be related to each other like fractals. For example,
NeoX
Nadiya Mirosh
Using the Neo Forex indicator algorithm, you can quickly understand what trend is currently developing in the market. The NeoX indicator accompanies long trends and can be used without restrictions on instruments or timeframes. Using this indicator you can try to predict future values. But the main use of the indicator is to generate buy and sell signals. The indicator tracks the market trend, ignoring sharp market fluctuations and noise around the average price. The indicator implements a type
Barry Hood's leading trend indicator is designed to more accurately determine the direction of the trend in financial markets. Here are the main characteristics and operating principles of this indicator: Adaptive Four-Level Smoothing: The indicator uses a mechanism that allows it to effectively adapt to changing market conditions. This allows you to more accurately determine the current trend. Characteristics and features: Redraws only on the zero candle: This means that the indicator is red
The   Trend Seeker   indicator is perfectly suited for tracking long-term trends in the Forex market and can be used without restrictions on instruments or time intervals. This indicator allows attempting to forecast future values, but its main application lies in generating buy and sell signals. The AlphaTrend Seeker tracks market trends, disregarding sharp fluctuations and noise around the average price. It is based on the idea of technical analysis, asserting that the market has a cyclical n
Market Magnet - This is not just a convenient tool, but rather an indispensable assistant for those who prefer to analyze the market using a clean chart. Sometimes even experienced traders need an additional analytical tool to identify key entry and exit points for trades. That's where Market Magnet comes in. This indicator is ideal for those who often have difficulty identifying trend inflection points or drawing trend lines on a chart. It offers a visual representation of key market moments,
Onion mt4
Nadiya Mirosh
The   Onion   Trend Indicator is a revolutionary trend trading and market data filtering solution that combines all the important features of a trend tool in one tool! It is great for any trader, be it Forex or binary options. No settings are required, everything is optimized by time and experience, it works effectively both in flat conditions and in trend conditions. The Onion Trend Indicator is a technical analysis tool for financial markets that reflects current deviations in the price of s
Likdon
Nadiya Mirosh
Using the Likdon Forex indicator algorithm, you can quickly determine the current trend in the market. The Elephant indicator tracks long trends and can be used without restrictions on instruments or timeframes. With its help, you can try to predict future price values, but its main purpose is to generate buy and sell signals. The indicator tracks the market trend, ignoring sharp fluctuations and market noise around the average price. It implements a technical analysis method based on the assu
Arriator
Nadiya Mirosh
The Arriator forex indicator algorithm allows you to quickly determine the current trend in the market. The Elephant indicator accompanies long-term trends and can be used without restrictions on instruments or timeframes. This indicator not only helps predict future values, but also generates buy and sell signals. It tracks market trends, ignoring wild swings and market noise around the average price. The indicator implements a type of technical analysis based on the idea of ​​market cyclicalit
Gyroscopes G4
Nadiya Mirosh
Gyroscope        professional forex expert   (for EURUSD, GBPUSD, USDJPY, AUDUSD, USDCHF, EURGBP, EURJPY, NZDUSD, USDCAD, EURCHF, AUDJPY, CADJPY pairs)   alyzing the market using the Elliot Wave Index. Elliott wave theory is the interpretation of processes in financial markets through a system of visual models (waves) on price charts. The author of the theory, Ralph Elliott, identified eight variants of alternating waves (of which five are in the trend and three are against the trend). The mov
Filtro:
Sem comentários
Responder ao comentário