• Visão global
  • Comentários
  • Discussão
  • O que há de novo

GoldenCeres

Caros operadores de Forex,

Estou encantado em apresentar o indicador GoldenCeres, uma ferramenta que tem sido fundamental em nossa jornada de negociação no último ano. Meu amigo mais próximo e eu temos usado este indicador para navegar com sucesso pelos mercados de Forex, e agora estamos ansiosos para compartilhá-lo com a comunidade MQL5.

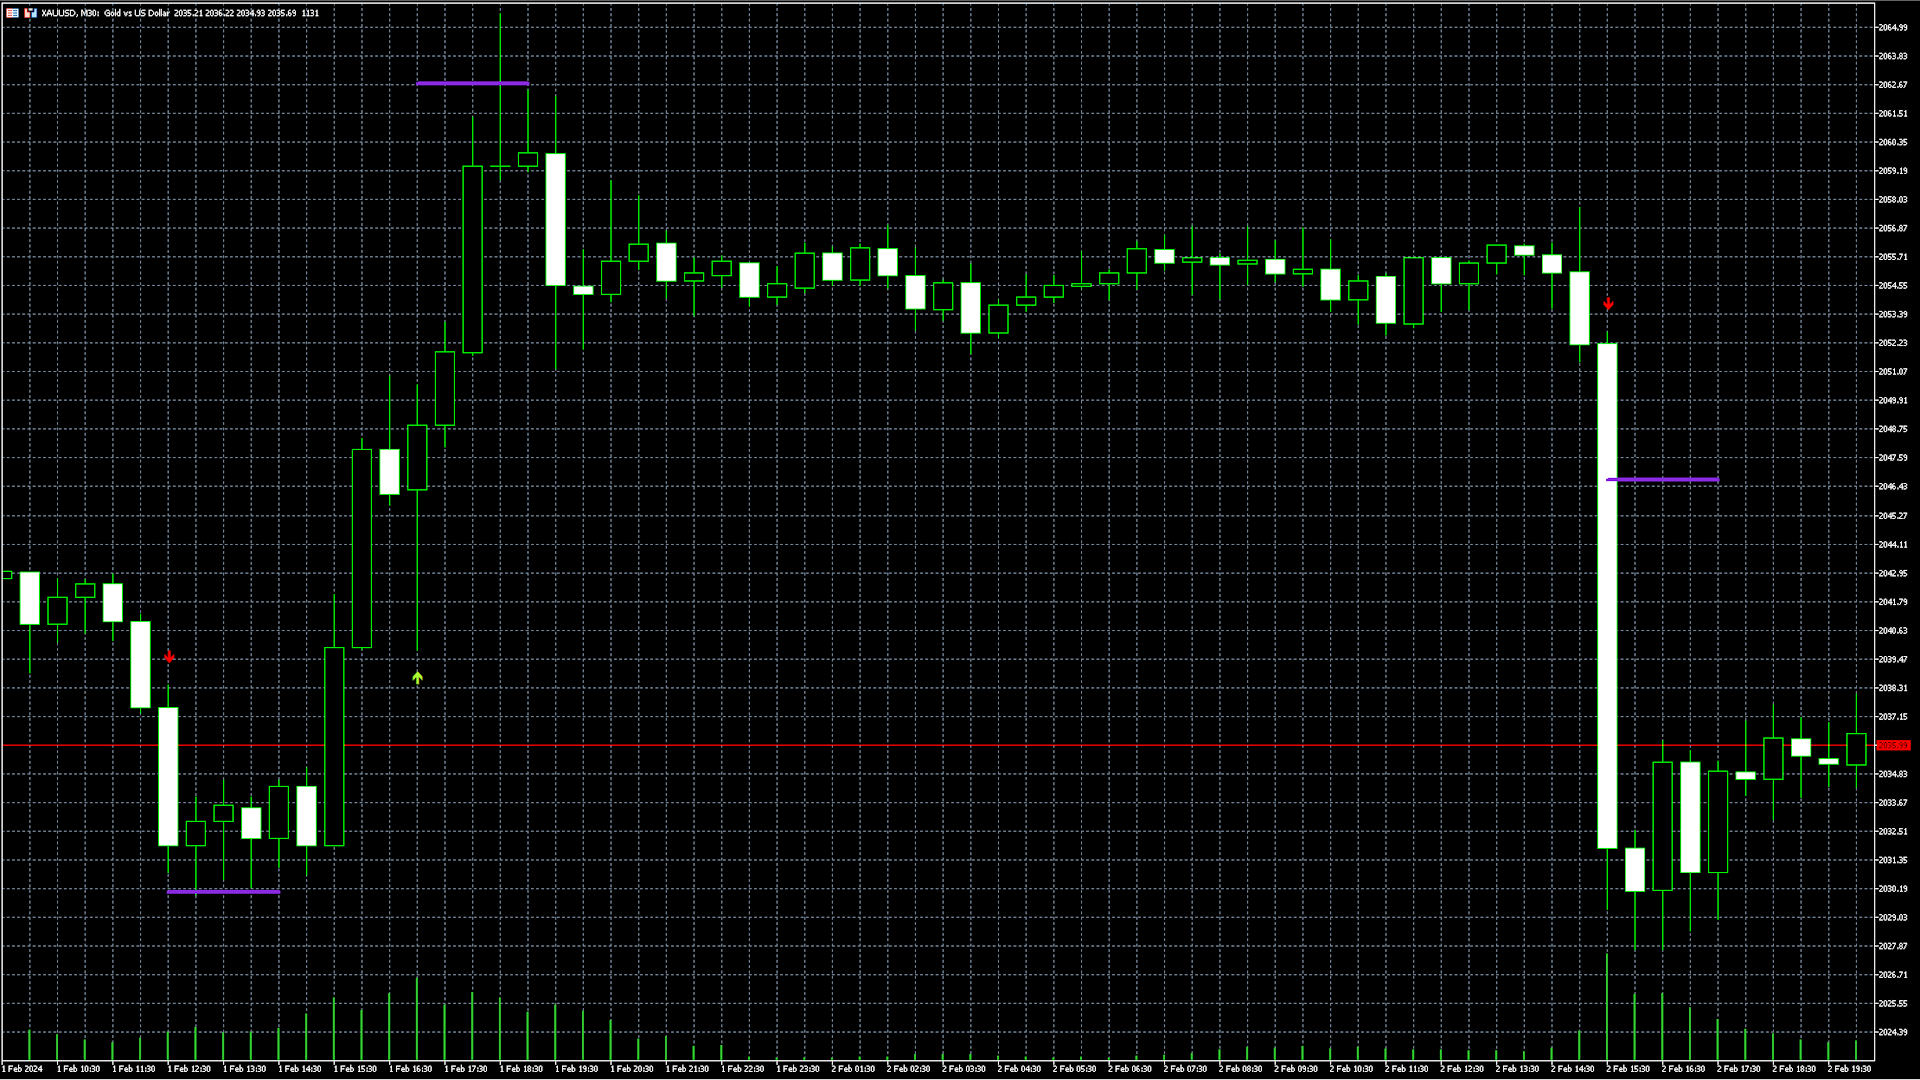
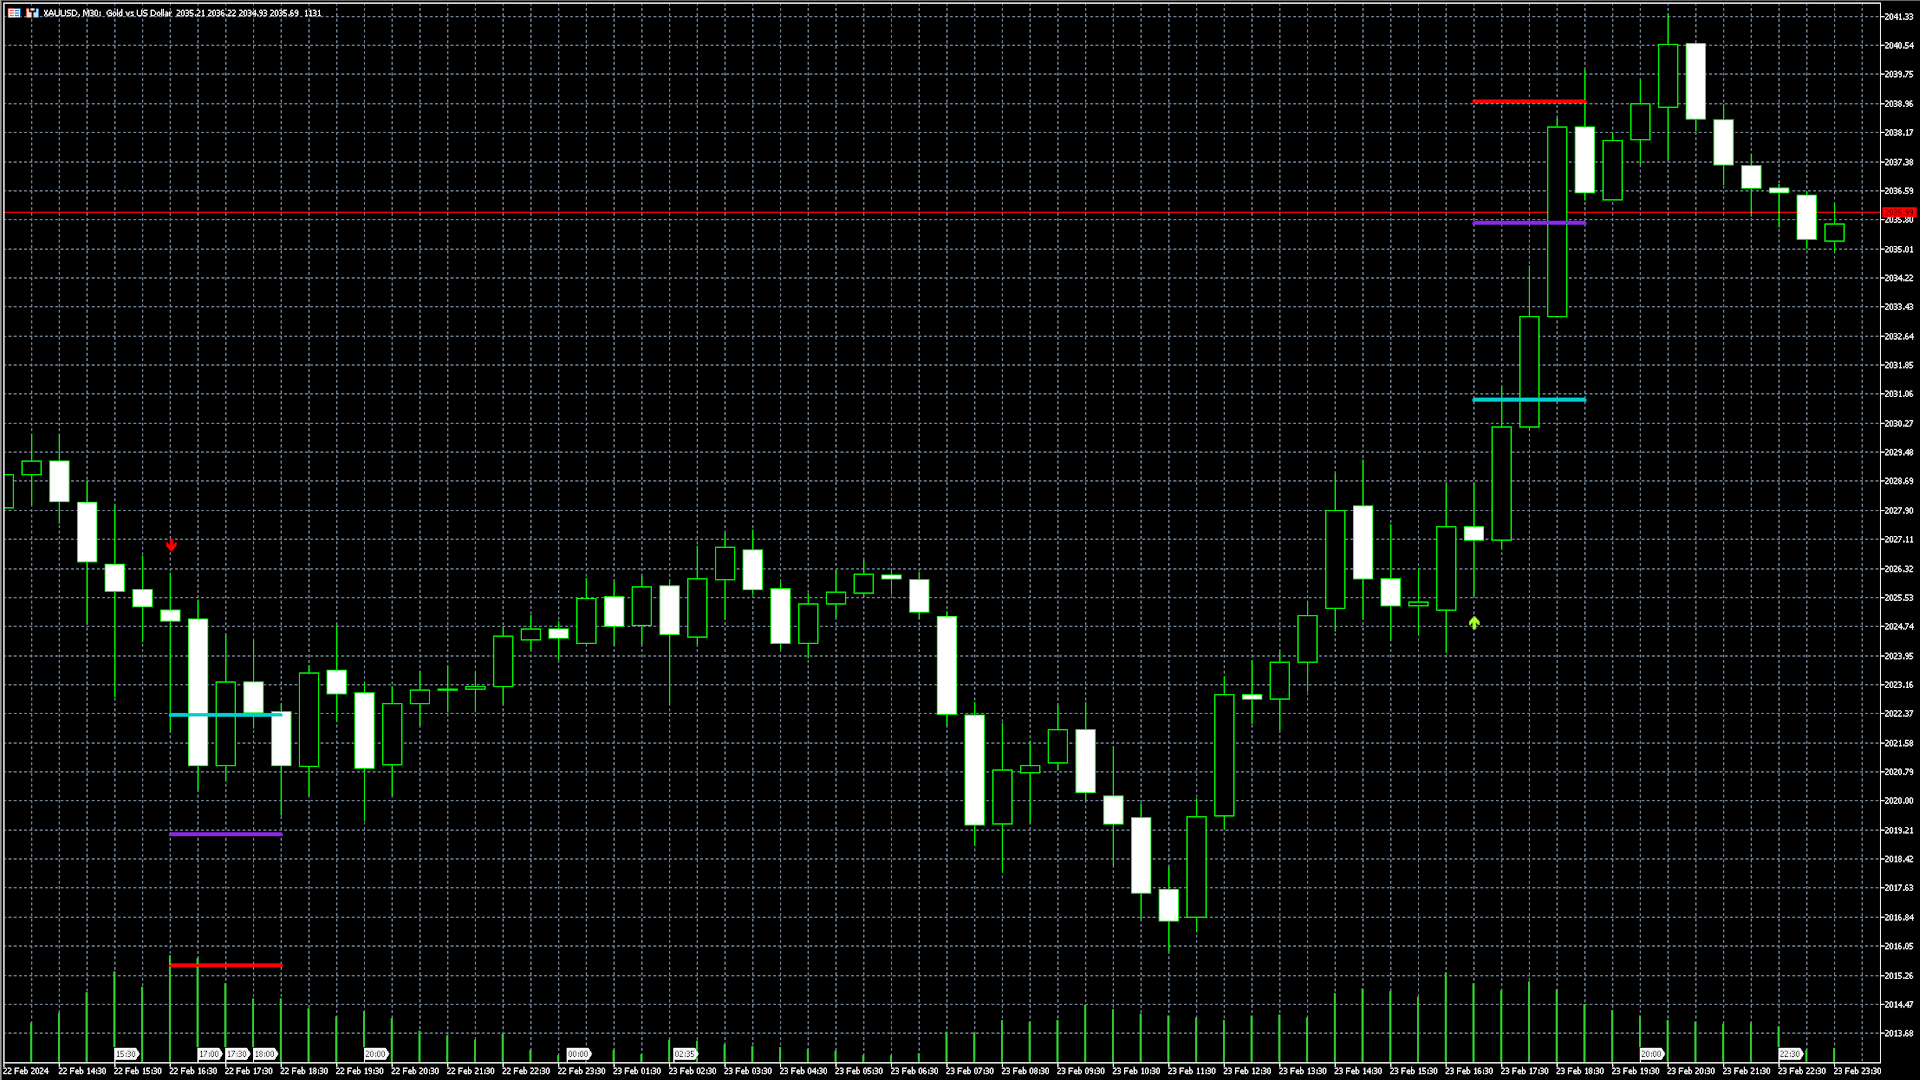
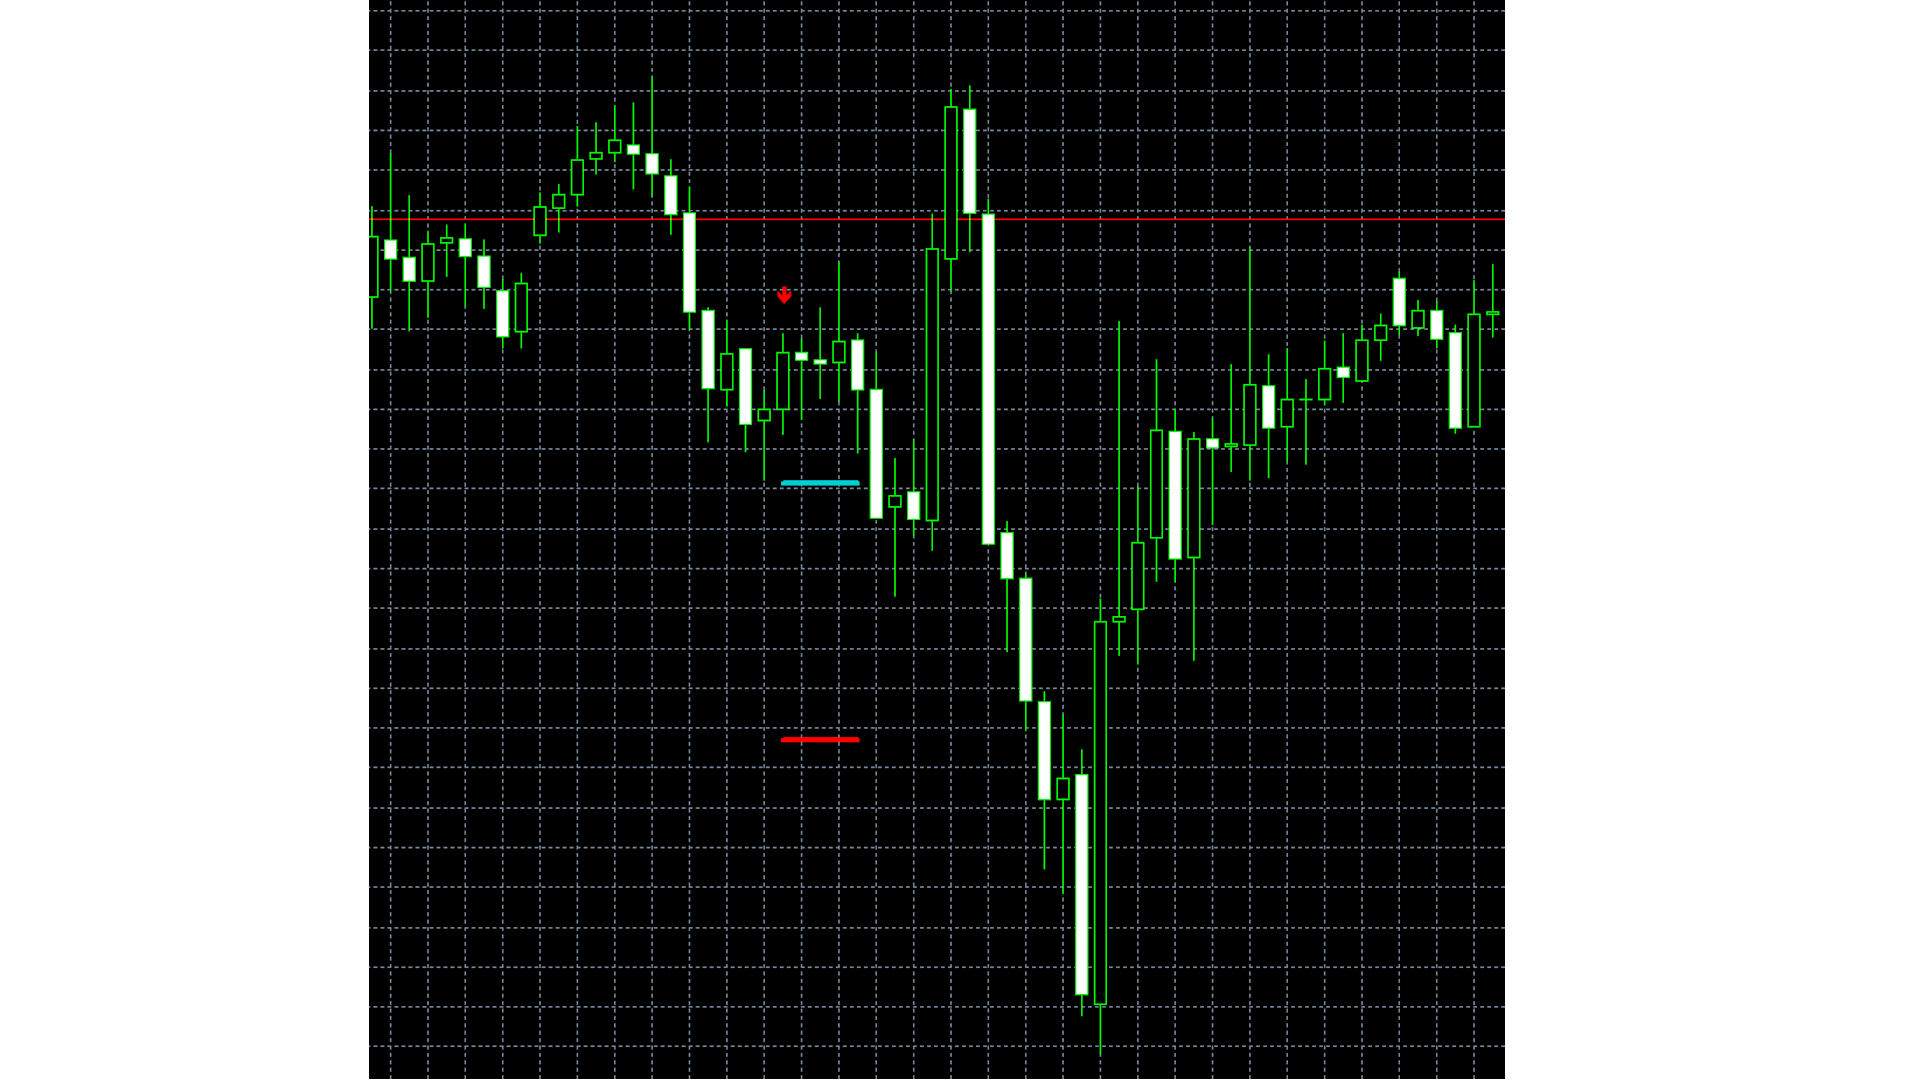
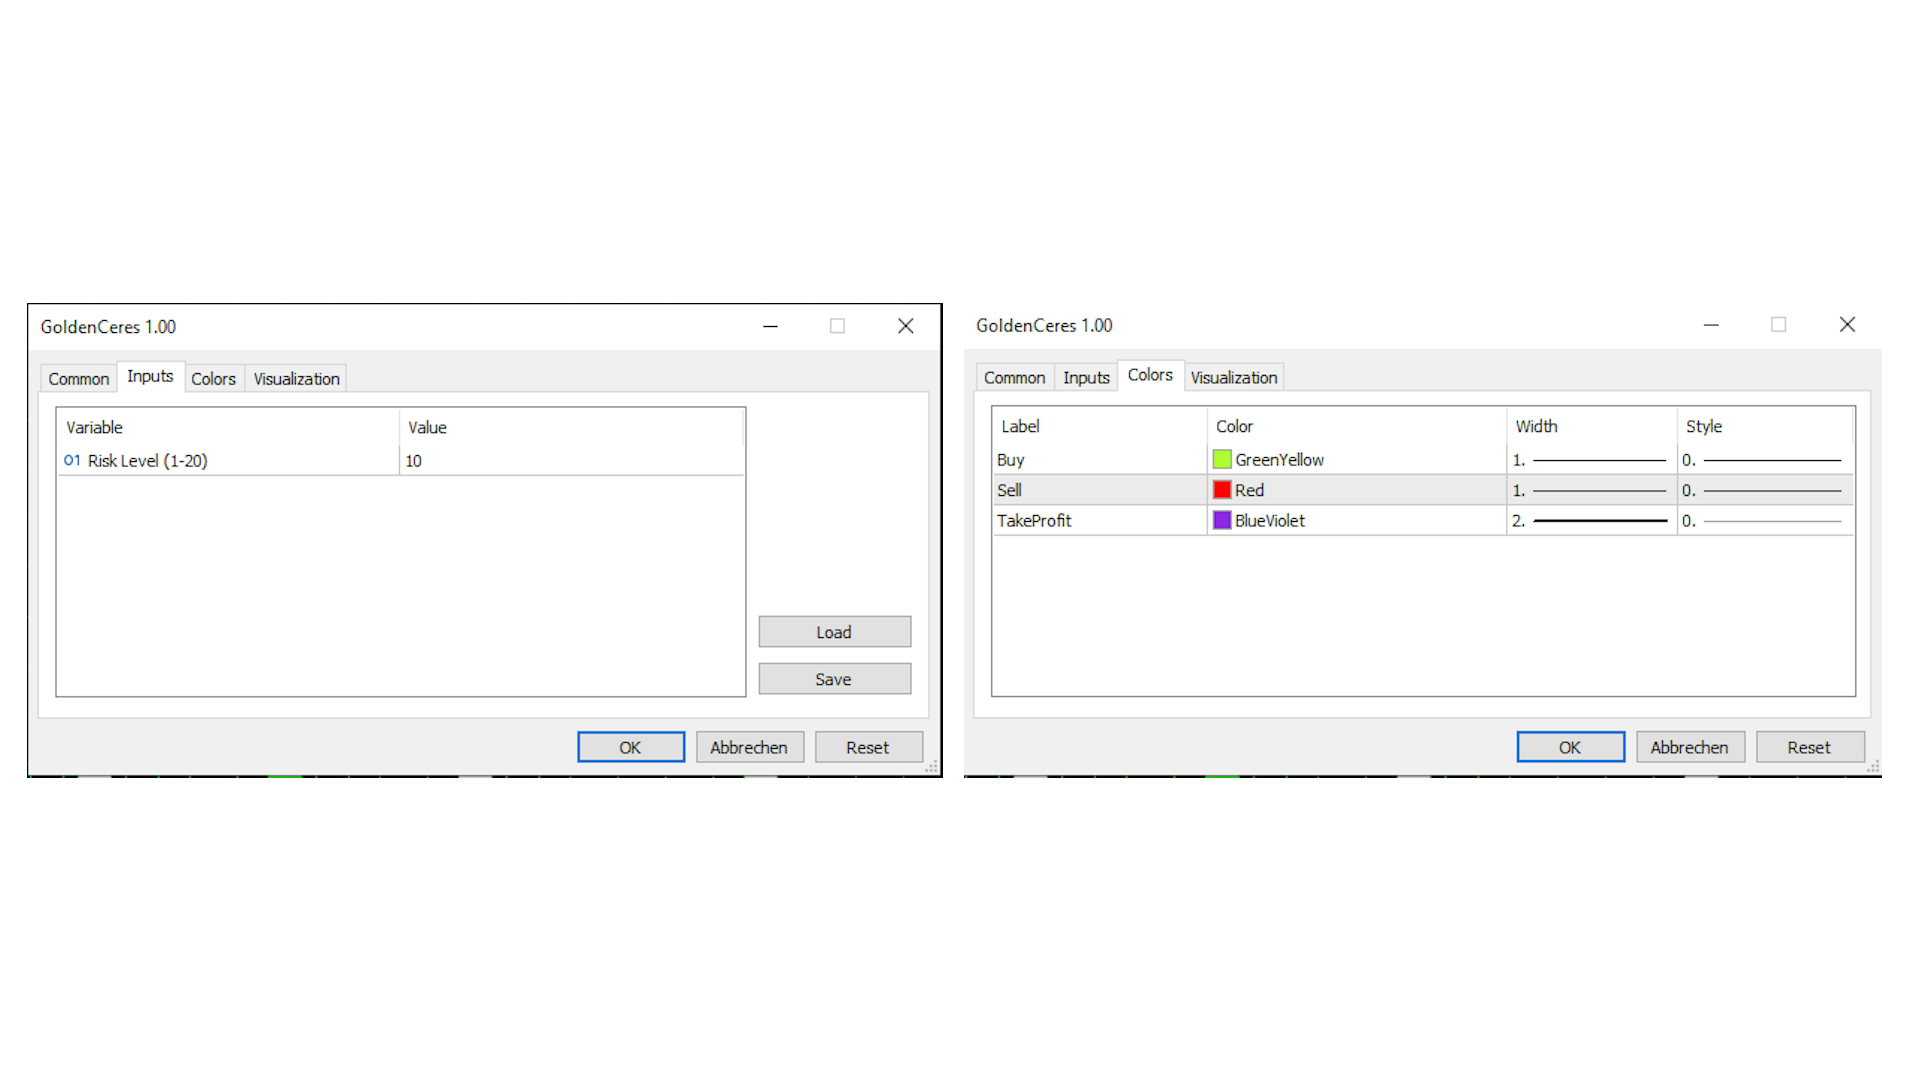
GoldenCeres é um indicador intuitivo e fácil de usar, projetado para operadores que têm alguma experiência em negociação Forex. Ele fornece sinais claros de compra ou venda diretamente no gráfico, simplificando os processos de tomada de decisão, sem qualquer atraso. Além disso, ele oferece um nível recomendado de TakeProfit, representado como uma pequena linha roxa no gráfico. A precisão deste nível recomendado pode ser personalizada usando uma variável de entrada que nomeamos como ‘Risk Level’.

A variável ‘Risk Level’ varia de 1 a 20. Um valor de 1 indica uma estratégia conservadora com alta probabilidade de atingir o nível de TakeProfit, mas uma recompensa relativamente menor. Um valor de 10 sugere uma abordagem equilibrada com uma boa chance de atingir o nível de TakeProfit e uma recompensa decente. Um valor de 20 representa uma estratégia agressiva com menor probabilidade de atingir o nível de TakeProfit, mas uma recompensa potencial significativamente maior.

GoldenCeres é especificamente projetado para o gráfico XAUUSD de 30 minutos, embora possa ser aplicado a outros gráficos XAU. Por favor, note que seu desempenho pode variar em diferentes prazos, pois ele é otimizado para o gráfico XAUUSD de 30 minutos.

Estamos comprometidos com a melhoria contínua e acolhemos quaisquer sugestões ou ideias para melhorias. Atualizações regulares serão fornecidas para garantir que GoldenCeres permaneça uma ferramenta confiável para suas necessidades de negociação.

Desejando-lhe uma jornada de negociação bem-sucedida e um dia maravilhoso!

Atenciosamente, Keve Nagy


Produtos recomendados
RFX5 Forex Strength Meter
Rasoul Mojtahedzadeh
5 (1)
RFX Forex Strength Meter is a powerful tool to trade 8 major currencies in the Forex market, U.S. Dollar ( USD ) European Euro ( EUR ) British Pound ( GBP ) Swiss Franc ( CHF ) Japanese Yen ( JPY ) Australian Dollar ( AUD ) Canadian Dollar ( CAD ) New Zealand Dollar ( NZD ) The indicator calculates the strength of each major currency using a unique and accurate formula starting at the beginning of each trading day of your broker. Any trading strategy in the Forex market can be greatly improved
Gioteen Volatility Index (GVI) - your ultimate solution to overcoming market unpredictability and maximizing trading opportunities. This revolutionary indicator helps you in lowering your losing trades due to choppy market movements. The GVI is designed to measure market volatility, providing you with valuable insights to identify the most favorable trading prospects. Its intuitive interface consists of a dynamic red line representing the volatility index, accompanied by blue line that indicate
Multi-currency, multi-timeframe, harmonic pattern indicator AB = CD. Supports sending push notifications about signals to a mobile device, messages on e-mail, as well as messages using alerts on all available currency pairs and timeframes. This indicator was based on the indicator Harmonic ABCD Universal. Version for MetaTrader 5:  https://www.mql5.com/en/market/product/44972 . See also: Harmonic ABCD Universal for MetaTrader 4 . Using modern software development methods has made the indicator a
Analyze up to 3 additional charts of other timeframes , without switching the main chart. My   #1 Utility : includes 65+ functions  |   Contact me  if you have any questions The indicator opens in a  separate window: The window   can be moved   to any place on the chart (using the   [<M>]   button). The window can also be minimized to save space ( [ <^>]  button) In the window that appears, you can configure: The period   of the 1st chart (left); The period   of the 2nd chart (center); The peri
Forex Relative Performance indicator This indicator calculates the relative strength of major currencies against the US dollar. The basic idea behind this indicator is "to buy strong currency and to sell weak currency". This indicator allows you to quickly identify the best forex pair to trade according to your trading style (Intraday, Scalping, Swing, or Long Term)
The indicator is designed to work on any trading platform. The program is based on proprietary algorithms and W.D.Ganna's mathematics, allowing you to calculate target levels of price movement based on three points with the highest degree of certainty. It is a great tool for stock trading. The indicator has three buttons: NEW - call up a triangle for calculation. DEL - delete the selected triangle. DELS - completely remove all constructions. The probability of achieving the goals is more than 80
Market screener: Spread and Swap, for selected Symbols. You can customize the list: set only the Symbols (currency pairs) that are needed. The number of Symbols is unlimited. The list can be sorted in ascending or descending order (Symbol name). The panel can be moved to any place on the chart. You can also minimize the panel. Displayed values: Current market price (BID); Spread size; Swap, for Long positions; Swap, for Short positions; Overall P/L of the entire account; My  #1 Utility : includ
Sansa MovingAvarage Cross MM Description in English and Italian = This Indicator is based on the cross of two Moving Avarage, and gives you the signal of Buy and Sell when they Cross, with Arrows and Alerts. What’s the best about it? You can set up the two Moving Avarage just as you need! When you attach the indicator on the chart , a window will open where , in the INPUT section, you can choose the MATimeFrame(H1,H4,M30 ....),  the MaMethod ( Simple, Exponential.....),SlowMa Periods( 50
Panel Visao axetrend
Danilo Maia Siqueira
painel para visão de tendência; AutoSignals Trend O indicador rastreia a tendência em 5 tempos gráficos diferentes do mesmo ativo, tendo como base 6 sinais par cada tempo gráfico. O indicador tem como principal objetivo, nos mostrar a tendência majoritária do ativo financeiro em que ele foi colocado. O sistema passa as informações das tendências em diversos tempos gráficos, dessa forma o usuário consegue ter uma visão ampla do movimento do ativo, este tipo de ferramenta faz com que o usuár
"Hunttern harmonic pattern finder" base on the dynamic zigzag with the notification and prediction mode This version of the indicator identifies 11 harmonic patterns and predicts them in real-time before they are completely formed. It offers the ability to calculate the error rate of Zigzag patterns depending on a risk threshold. It moreover sends out a notification once the pattern is complete. The supported patterns: ABCD BAT ALT BAT BUTTERFLY GARTLEY CRAB DEEP CRAB CYPHER SHARK THREE
Welcome to a highly versatile and customizable trading indicator designed to elevate your trading strategy. This indicator integrates four moving averages (MAs) and order blocks, providing you with a powerful tool for market analysis and decision-making. Key Features: Four Moving Averages (MAs): This indicator allows you to utilize up to four different moving averages simultaneously. You can adjust each MA's period, color, and style to tailor the indicator to your specific trading needs. Whether
O indicador cria cotações atuais, que podem ser comparadas com as históricas e, com base nisso, fazer uma previsão do movimento dos preços. O indicador possui um campo de texto para navegação rápida até a data desejada. Opções: Símbolo - seleção do símbolo que o indicador exibirá; SymbolPeriod - seleção do período do qual o indicador coletará dados; IndicatorColor - cor do indicador; HorisontalShift - deslocamento das cotações desenhadas pelo indicador pelo número especificado de
The volatility scanner indicator is a tool that helps traders identify and analyze  volatility in all the market timeframes for the current chart. This way you can find potentially profitable trades on every timeframe for the current symbol. What It Does? Scan all timeframes to find a volatility contraction. Color the button yellow if there is a volatility squeeze at that timeframe. Clicking on the button instantly changes timeframe. How To Use It? Just put it on the chart and click on the y
Gartley Hunter Multi
Siarhei Vashchylka
5 (8)
Gartley Hunter Multi - An indicator for searching for harmonic patterns simultaneously on dozens of trading instruments and on all possible timeframes. Manual (Be sure to read before purchasing) | Version for MT4 Advantages 1. Patterns: Gartley, Butterfly, Shark, Crab. Bat, Alternate Bat, Deep Crab, Cypher 2. Simultaneous search for patterns on dozens of trading instruments and on all possible timeframes 3. Search for patterns of all possible sizes. From the smallest to the largest 4. A
PZ Trend Trading MT5
PZ TRADING SLU
3.67 (3)
O Trend Trading é um indicador projetado para lucrar o máximo possível com as tendências que ocorrem no mercado, cronometrando retrocessos e rupturas. Ele encontra oportunidades de negociação analisando o que o preço está fazendo durante as tendências estabelecidas. [ Guia de instalação | Guia de atualização | Solução de problemas | FAQ | Todos os produtos ] Negocie mercados financeiros com confiança e eficiência Lucre com as tendências estabelecidas sem ser chicoteado Reconhecer retrocesso
This is a tool to estimate your probability of bankruptcy. features. estimate a probability of bankruptcy (Nauzer J. Balsara) from your trade history usually, it is small print and never interfere with trades alert in large prints and color when it exceed the alert level you can set parameters(i.e. winning ratio) fixed and simulate freely *1: this value is for reference only and is not guaranteed to occur.
FREE
MACD Divergence on MT5
KEENBASE SOFTWARE SOLUTIONS
KT MACD Divergence shows the regular and hidden divergences build between the price and oscillator. If your trading strategy anticipates the trend reversal, you can include the MACD regular divergence to speculate the potential turning points. And if your trading strategy based on the trend continuation, MACD hidden divergence would be a good fit. Limitations of KT MACD Divergence Using the macd divergence as a standalone entry signal can be a risky affair. Every divergence can't be interpr
Volume plays a crucial role in trading, serving as a key indicator of market activity and investor sentiment. Here are some important roles of volume in trading: Confirming trends: Dow Theory emphasizes the importance of volume in determining market trends. Larger volume usually indicates greater disagreement between bulls and bears, while smaller volume may indicate higher market agreement with the current price. Capturing institutional moves: By analyzing volume over a period of time, one c
Heiken Ashi OHLC
Bogdan Gabriel Ilie
Are you tired of trading without a clear direction ?  Do market fluctuations and noise leave you feeling overwhelmed ?  Here is the solution you've been searching for! Imagine an indicator that simplifies trading, cuts through market noise, and provides crystal-clear signals. The Heiken Ashi OHLC Indicator does just that! What does the Heiken Ashi OHLC Indicator do? It transforms traditional candlestick charts into a trader's dream. Instead of dealing with erratic price movements, you'll wi
FREE
Difícil de encontrar e com pouca frequência, as divergências são um dos cenários de negociação mais confiáveis. Este indicador localiza e verifica automaticamente divergências ocultas e regulares usando seu oscilador favorito. [ Guia de instalação | Guia de atualização | Solução de problemas | FAQ | Todos os produtos ] Fácil de trocar Encontra divergências regulares e ocultas Suporta muitos osciladores conhecidos Implementa sinais de negociação baseados em fugas Exibe níveis adequados de
Introducing "X Marks the Spot" – Your Ultimate MetaTrader 5 Indicator for Perfect Trades! Are you tired of the guesswork in trading? Ready to take your MetaTrader 5 experience to a whole new level? Look no further – "X Marks the Spot" is here to revolutionize your trading strategy! What is "X Marks the Spot"? "X Marks the Spot" is not just another indicator – it's your personal trading compass that works seamlessly on all timeframes . Whether you're a beginner or an experienced trader,
The indicator detects divergence signals - the divergences between the price peaks and the MACD oscillator values. The signals are displayed as arrows in the additional window and are maintained by the messages in a pop-up window, e-mails and push-notifications. The conditions which formed the signal are displayed by lines on the chart and in the indicator window. The indicator parameters MacdFast - fast MACD line period MacdSlow - slow MACD line period MacdSignal - MACD signal line period Mac
Point Black
Ignacio Agustin Mene Franco
Black Card Pack indicator 5/1 point black It has the strategy of professional bollingers where each arrow gives you a different entry signal. It is used to operate in m1 and in d1 It is used for scalping and intraday, modified for forex markets ! suitable for all pairs modified for synthetic index markets suitable for all pairs! Ideal for volatility and jumps!
Ferramentas para ganhar e pesquisar. O núcleo dos sinais de negociação e estratégia é baseado no algoritmo do autor para a formação de padrões de previsão de preços. Aplicável a qualquer instrumento! Complementado com um sistema de controle baseado no MA "Nine-Tailed Fox" , atualizando e ajustando o sinal com a maior precisão possível para o mercado, instrumento e período de trabalho. Elegíveis: Todos os instrumentos em todos os mercados (há exceções). Para quem é: fundos de hedge, gestores d
Win43 Scalper
Eadvisors Software Inc.
O novo s43 Scalper para Mini-Índice (WIN-IND) faz operações de curto prazo no timeframe 1min buscando pequenas variações do mercado, utiliza nova tecnologia de trade, os resultados no intraday são íncríveis, confira:      Após a instalação adicione no gráfico dos instrumentos win para visualizar os resultados no backteste. Recomendamos o timeframe de 1min.
View Trade Status
Jose Pablo Estrella Mejia
This indicator will help you have a better visualization of the status of your open trades. You can see profits or losses in USD or %, as well as a total of all trades and the percentage of profit or loss according to your account size. You can change the font size and color. I hope you find it useful and it makes monitoring your trades easier.  This indicator adjusts to the size of your screen and will be positioned in the bottom right corner of your screen for better convenience.
HAWA GOLD MT5 Advanced trading indicator with realistic pre-defined entry and exit levels with almost 80% win rate.  The system focuses only  Small and Steady Profits . It uses fixed stop loss for every signal to keep money management in place.  As compare to other available indicators in market, HAWA gold has unique feature of displaying total profit and loss in terms of points where 1PIP=10points and Minimum profit is 10 pips. Its smart and advanced algorithm detects trend and trend strengt
The TSO Currency Trend Aggregator is an indicator that compares a selected currency's performance in 7 different pairs. Instantly compare how a currency is performing in 7 different pairs. Easily get confirmation of a currency's strength Combine the indicator for both currencies of a pair to get the total view of how strong/weak each currency is. The trend is classified as positive (green), negative (red) or neutral (grey). Can easily be used in an EA (see below) Currencies EUR USD GBP JPY AUD
MTF Stoch
Zhi Quan Xiao
This is a multi frame stochastic indicator, you can attach any time frame of stoch indicator on one chart. It is very useful if you like to check multi time frame stoch data. If you are interested in EA,click below links to take a look: https://www.mql5.com/en/market/product/80170 https://www.mql5.com/en/market/product/81136 How to use: > Atach the first time frame you want on to the currency pair's chart > Atach the second time frame you want on to the currency pair's   chart > Atach the thir
FREE
This indicator scans the 1-3 Trendline pattern . The indicator is a 100 % non repaint low risk breakout system . The patterns are formed around swing high and swing lows which make them a low risk pattern with high reward. PATTERN BACKGROUND The 1-3 Trendline Breakout pattern is formed by four(4) points which are composed of three (3) primary points and the pattern neck. A trendline is always formed by the point 1 and the neck of the pattern . When price breaks out of the trendline formed ,
Os compradores deste produto também adquirem
Atomic Analyst MT5
Issam Kassas
4.79 (19)
Primeiramente, vale ressaltar que este Indicador de Negociação não repinta, não redesenha e não apresenta atrasos, tornando-o ideal tanto para negociação manual quanto automatizada. Manual do utilizador: configurações, entradas e estratégia. O Analista Atômico é um Indicador de Ação de Preço PA que utiliza a força e o momentum do preço para encontrar uma vantagem melhor no mercado. Equipado com filtros avançados que ajudam a remover ruídos e sinais falsos, e aumentam o potencial de negociação.
Primeiramente, vale ressaltar que este Sistema de Trading é um Indicador Não Repintado, Não Redesenho e Não Atrasado, o que o torna ideal tanto para o trading manual quanto para o automatizado. Curso online, manual e download de predefinições. O "Sistema de Trading Inteligente MT5" é uma solução completa de trading projetada para traders novos e experientes. Ele combina mais de 10 indicadores premium e apresenta mais de 7 estratégias de trading robustas, tornando-o uma escolha versátil para dive
Gold Stuff mt5
Vasiliy Strukov
4.9 (183)
Gold Stuff mt5-um indicador de tendência projetado especificamente para o ouro, também pode ser usado em qualquer instrumento financeiro. O indicador não é redesenhado ou atrasado. O timeframe recomendado é H1. Importante! Entre em contato comigo imediatamente após a compra para obter instruções e bônus!  Você pode obter uma cópia gratuita do nosso indicador Strong Support e Trend Scanner, envie uma mensagem privada. a mim! PARÂMETRO Draw Arrow-incl.desligado. desenhar setas no gráfico. A
TPSpro RFI Levels MT5
Roman Podpora
4.67 (9)
Reversal First Impulse levels (RFI)      INSTRUCTIONS        RUS       -       ENG              R ecommended to use with an indicator   -   TPSpro  TREND PRO -  Version MT4                 A key element in trading is zones or levels from which decisions to buy or sell a trading instrument are made. Despite attempts by major players to conceal their presence in the market, they inevitably leave traces. Our task was to learn how to identify these traces and interpret them correctly. Main functi
Quantum Trend Sniper
Bogdan Ion Puscasu
4.92 (48)
Apresentando       Quantum Trend Sniper Indicator   , o inovador Indicador MQL5 que está transformando a maneira como você identifica e negocia as reversões de tendência! Desenvolvido por uma equipe de traders experientes com experiência comercial de mais de 13 anos,       Indicador de Atirador de Tendência Quântica       foi projetado para impulsionar sua jornada de negociação a novos patamares com sua forma inovadora de identificar reversões de tendência com precisão extremamente alta. ***C
Agora US $ 147 (aumentando para US $ 499 após algumas atualizações) - Contas ilimitadas (PCs ou Macs) Manual do usuário do RelicusRoad + vídeos de treinamento + acesso ao grupo de discórdia privado + status VIP UMA NOVA FORMA DE OLHAR PARA O MERCADO O RelicusRoad é o indicador de negociação mais poderoso do mundo para forex, futuros, criptomoedas, ações e índices, oferecendo aos traders todas as informações e ferramentas necessárias para se manterem rentáveis. Fornecemos análises técnica
Introduction to X3 Chart Pattern Scanner X3 Cherart Pattern Scanner is the non-repainting and non-lagging indicator detecting X3 chart patterns including Harmonic pattern, Elliott Wave pattern, X3 patterns, and Japanese Candlestick patterns. Historical patterns match with signal patterns. Hence, you can readily develop the solid trading strategy in your chart. More importantly, this superb pattern scanner can detect the optimal pattern of its kind. In addition, you can switch on and off individu
Apresentando       Quantum Breakout PRO   , o inovador Indicador MQL5 que está transformando a maneira como você negocia Breakout Zones! Desenvolvido por uma equipe de traders experientes com experiência comercial de mais de 13 anos,       Quantum Breakout PRO       foi projetado para impulsionar sua jornada comercial a novos patamares com sua estratégia de zona de fuga inovadora e dinâmica. O Quantum Breakout Indicator lhe dará setas de sinal em zonas de breakout com 5 zonas-alvo de lucro e
AT Forex Indicator MT5
Marzena Maria Szmit
5 (4)
The AT Forex Indicator MT5 is a sophisticated trading tool designed to provide traders with a comprehensive analysis of multiple currency pairs. This powerful indicator simplifies the complex nature of the forex market, making it accessible for both novice and experienced traders. AT Forex Indicator uses advanced algorithms to detect trends, patterns and is an essential tool for traders aiming to enhance their forex trading performance. With its robust features, ease of use, and reliable signal
Elliott Wave Trend was designed for the scientific wave counting. This tool focuses to get rid of the vagueness of the classic Elliott Wave Counting using the guideline from the template and pattern approach. In doing so, firstly Elliott Wave Trend offers the template for your wave counting. Secondly, it offers Wave Structural Score to assist to identify accurate wave formation. It offers both impulse wave Structural Score and corrective wave Structure Score. Structural Score is the rating to sh
FX Volume MT5
Daniel Stein
4.94 (17)
Receba a sua atualização diária do mercado com detalhes e screenshots através do nosso Morning Briefing aqui no mql5 e no Telegram ! O Volume FX é o PRIMEIRO e ÚNICO indicador de volume que fornece uma visão REAL do sentimento do mercado do ponto de vista de um corretor. Ele fornece uma visão incrível de como os participantes do mercado institucional, como corretores, estão posicionados no mercado Forex, muito mais rápido do que os relatórios COT. Ver essas informações diretamente no seu gráfi
IVISTscalp5
Vadym Zhukovskyi
5 (5)
Apresentamos a você o indicador iVISTscalp5, que não é apenas único, mas também eficaz em operações de negociação. Este indicador é baseado em dados de tempo e é o resultado de muitos anos de experiência e análise aprofundada dos mercados financeiros. O indicador iVISTscalp5 é uma excelente ferramenta para negociação manual. Conveniência, simplicidade e visualização - toda a complexidade está escondida dentro dele. Simplificamos as configurações e o uso do indicador iVISTscalp5 ao máximo. O indi
XQ Indicator MetaTrader 5
Marzena Maria Szmit
5 (1)
Step into the realm of Forex trading with confidence and precision using XQ, a cutting-edge Forex indicator designed to elevate your trading game to unprecedented heights. Whether you're a seasoned trader or just stepping into the world of currency exchange, XQ Forex Indicator empowers you with the insights and signals needed to make informed trading decisions. The signal conditions are a combination of three indicators, and XQ Forex Indicator only display  medium and long-term trends . The ind
Este é sem dúvida o indicador de reconhecimento automático de formação de preço harmônico mais completo que você pode encontrar para a MetaTrader Platform. Ele detecta 19 padrões diferentes, leva as projeções de Fibonacci tão a sério quanto você, exibe a Zona de Reversão Potencial (PRZ) e encontra níveis adequados de stop loss e take-profit. [ Guia de instalação | Guia de atualização | Solução de problemas | FAQ | Todos os produtos ] Detecta 19 formações harmônicas de preços diferentes Tr
Bill Williams Advanced
Siarhei Vashchylka
5 (7)
Bill Williams Advanced is designed for automatic chart analysis using Bill Williams' "Profitunity" system. The indicator analyzes four timeframes at once. Manual (Be sure to read before purchasing) Advantages 1. Automatically analyzes the chart using the "Profitunity" system of Bill Williams. The found signals are placed in a table in the corner of the screen. 2. Equipped with a trend filter based on the Alligator indicator. Most of the system signals are recommended to be used only accordi
Introduction to Fractal Pattern Scanner Fractal Indicator refers to the technical indicator that makes use of the fractal geometry found in the financial market. Fractal Pattern Scanner is the advanced Fractal Indicator that brings the latest trading technology after the extensive research and development work in the fractal geometry in the financial market. The most important feature in Fractal Pattern Scanner is the ability to measure the turning point probability as well as the trend probabil
MTF Supply Demand Zones MT5
Georgios Kalomoiropoulos
5 (1)
Próxima geração de zonas automatizadas de oferta e demanda. Algoritmo novo e inovador que funciona em qualquer gráfico. Todas as zonas estão sendo criadas dinamicamente de acordo com a ação do preço do mercado. DOIS TIPOS DE ALERTAS --> 1) QUANDO O PREÇO ATINGE UMA ZONA 2) QUANDO UMA NOVA ZONA É FORMADA Você não recebe mais um indicador inútil. Você obtém uma estratégia de negociação completa com resultados comprovados.     Novas características:     Alertas quando o preço ati
FxaccurateLS
Shiv Raj Kumawat
WHY IS OUR FXACCCURATE LS MT5 THE PROFITABLE ? PROTECT YOUR CAPITAL WITH RISK MANAGEMENT Gives entry, stop and target levels from time to time. It finds Trading opportunities by analyzing what the price is doing during established trends. POWERFUL INDICATOR FOR A RELIABLE STRATEGIES We have made these indicators with a lot of years of hard work. It is made at a very advanced level. Established trends provide dozens of trading opportunities, but most trend indicators completely ignore them!
PZ Swing Trading MT5
PZ TRADING SLU
5 (4)
Swing Trading é o primeiro indicador projetado para detectar oscilações na direção da tendência e possíveis oscilações de reversão. Ele usa a abordagem de negociação de linha de base, amplamente descrita na literatura de negociação. O indicador estuda vários vetores de preço e tempo para rastrear a direção da tendência agregada e detecta situações nas quais o mercado está sobrevendido ou sobrecomprado em excesso e pronto para corrigir. [ Guia de instalação | Guia de atualização | Solução de prob
PZ Day Trading MT5
PZ TRADING SLU
2.83 (6)
Este indicador detecta reversões de preços em zigue-zague, usando apenas análise de ação de preços e um canal donchiano. Ele foi projetado especificamente para negociações de curto prazo, sem repintar ou retroceder. É uma ferramenta fantástica para traders astutos, com o objetivo de aumentar o tempo de suas operações. [ Guia de instalação | Guia de atualização | Solução de problemas | FAQ | Todos os produtos ] Surpreendentemente fácil de negociar Fornece valor em cada período de tempo Imple
The iChannels
BeeXXI Corporation
5 (1)
Ultra-fast recognition of parabolic channels (as well as linear, horizontal and wavy channels) throughout the depth of history, creating a hierarchy of channels. Required setting: Max bars in chart: Unlimited This indicator is designed primarily for algorithmic trading, but can also be used for manual trading.  This indicator will have a very active evolution in the near future and detailed descriptions on how to apply to create robots
Dragon Multi Indicator MT5
Mansour Babasafary
5 (5)
3 Indicators in 1 indicator Strategy based on price action Made specifically for the best forex currency pairs Can be used in the best time frame of the market at a very reasonable price This indicator is basically 3 different indicatos . But we have combined these 3 indicators in 1 indicator so that you can use 3 indicators at the lowest price. All three strategies are based on price action. But based on different trends. Long term, medium term and short term Attributes : No repaintin
O Oscilador de Índice de Precisão (Pi-Osc) de Roger Medcalf da Precision Trading Systems A Versão 2 foi cuidadosamente reconfigurada para carregar rapidamente em seu gráfico, e algumas outras melhorias técnicas foram incorporadas para aprimorar a experiência. O Pi-Osc foi criado para fornecer sinais precisos de temporização de negociações projetados para encontrar pontos de exaustão extremos, os pontos para os quais os mercados são forçados a ir apenas para tirar as ordens de todos. Este
TPA True Price Action indicator reveals the true price action of the market makers through 100% non-repainting signals strictly at the close of a candle! TPA shows entries and re-entries, every time the bulls are definitely stronger than the bears and vice versa. Not to confuse with red/green candles. The shift of power gets confirmed at the earliest stage and is ONE exit strategy of several. There are available now two free parts of the TPA User Guide for our customers. The first "The Basics"
Matreshka
Dimitr Trifonov
5 (1)
Matreshka self-testing and self-optimizing indicator: 1. Is an interpretation of the Elliott Wave Analysis Theory. 2. Based on the principle of the indicator type ZigZag, and the waves are based on the principle of interpretation of the theory of DeMark. 3. Filters waves in length and height. 4. Draws up to six levels of ZigZag at the same time, tracking waves of different orders. 5. Marks Pulsed and Recoil Waves. 6. Draws arrows to open positions 7. Draws three channels. 8. Notes support and re
Cansado de traçar linhas de suporte e resistência? A Resistência de suporte é um indicador de período múltiplo que detecta e plota automaticamente linhas de suporte e resistência no gráfico com um toque muito interessante: conforme os níveis de preços são testados ao longo do tempo e sua importância aumenta, as linhas se tornam mais espessas e mais escuras. [ Guia de instalação | Guia de atualização | Solução de problemas | FAQ | Todos os produtos ] Melhore sua análise técnica da noite para o d
The Price Action Finder Multi indicator is an indicator of entry points that searches for and displays Price Action system patterns on dozens of trading instruments and on all standard time frames: (m1, m5, m15, m30, H1, H4, D1, Wk, Mn). The indicator places the found patterns in a table at the bottom of the screen. By clicking on the pattern names in the table, you can move to the chart where this pattern is located. Manual (Be sure to read before purchasing) | Version for MT4 Advantages 1. Pa
[ MT4 Version ] Only the next 10 units at current price! Final price: $299 Are you tired of spending months on demo or live accounts to test your trading strategies? The Backtesting Simulator is the ultimate tool designed to elevate your backtesting experience to new heights. Utilizing Metatrader historical symbol information, it offers an unparalleled simulation of real market conditions. Take control of your testing speed, test ideas quickly or at a slower pace, and witness remarkable improve
How to use Pair Trading Station Pair Trading Station is recommended for H1 time frame and you can use it for any currency pairs. To generate buy and sell signal, follow few steps below to apply Pair Trading Station to your MetaTrader terminal. When you load Pair Trading Station on your chart, Pair Trading station will assess available historical data in your MetaTrader platforms for each currency pair. On your chart, the amount of historical data available will be displayed for each currency pai
Piranha version 2
Maria Strudov
5 (1)
"Piranha" - an autonomous trading system that determines overbought and oversold levels on the chart. Red and blue zones represent overbought and oversold levels respectively. Entry points are marked with arrows: a downward arrow in the red zone for "sell" and an upward arrow in the blue zone for "buy". The Take profit level is indicated by the green moving average. Key features: Adjusting the Take profit level as the green moving average changes position. Averaging ability when a new market e
Filtro:
Sem comentários
Responder ao comentário
Versão 1.12 2024.02.28
*) Performance update
Versão 1.11 2024.02.27
*) Agora, o Ceres envia apenas uma mensagem por vela, simplificando a comunicação e reduzindo o ruído.
Versão 1.10 2024.02.26
1. Recurso de Notificações Móveis: O indicador agora suporta o envio de notificações para dispositivos Android e iOS usando seu MQID. Este recurso pode ser ativado ou desativado convenientemente através das variáveis de entrada.

2. Resolução de Erros: Abordamos um problema em que a linha de Take Profit (TP) não era visível imediatamente após um sinal de Compra/Venda. Este erro foi corrigido, melhorando a confiabilidade e a facilidade de uso do indicador.