• Visão global
  • Comentários (1)
  • Discussão (3)

Seconds Timeframes Chart MT5

Gráfico de Segundos para MetaTrader 5

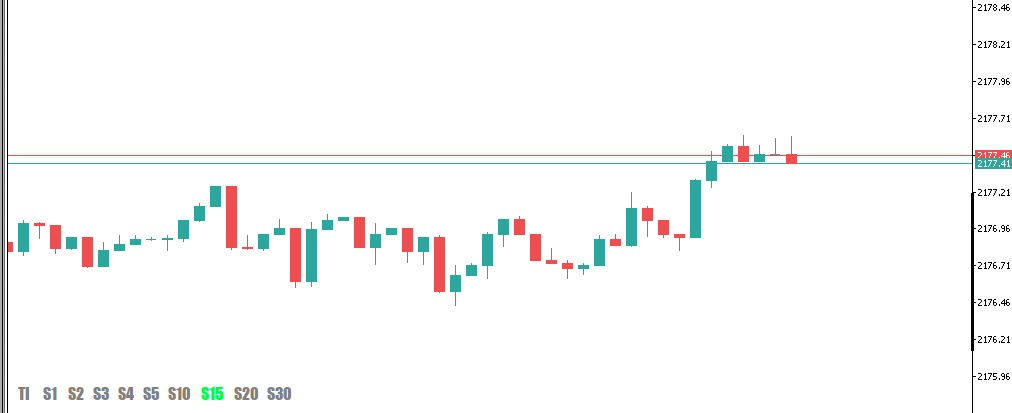
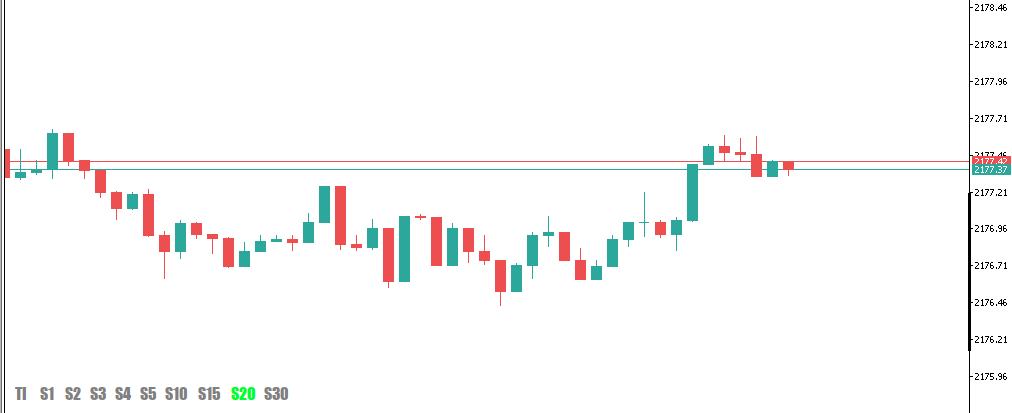
Os Indicadores permitem que você crie gráficos no terminal MetaTrader 5 com um período em segundos. O período em tal gráfico é definido em segundos, não em minutos ou horas. Assim, você pode criar gráficos com um período menor que M1. Por exemplo, S15 é um período com um período de 15 segundos. Você pode aplicar indicadores, Expert Advisors e scripts ao gráfico resultante.

Você obtém um gráfico totalmente funcional no qual pode trabalhar tão bem quanto em um gráfico regular.

O período em segundos é construído não apenas em tempo real, mas também no histórico, devido ao banco de dados de ticks existente. Assim, a qualquer momento, você pode abrir um período em segundos no qual o histórico já foi acumulado.

Ao mesmo tempo, os dados são atualizados de forma síncrona com o gráfico básico, sem atrasos.

Você pode selecionar períodos em segundos: S1, S2, S3, S4, S5, S6, S10, S12, S15, S20, S30.
E também, você pode definir qualquer valor desejado.

Nota:

Após instalar este Indicador e adicionar ao gráfico, pressione a tecla "Z" para alternar entre o período padrão e o gráfico no intervalo de segundos.
Produtos recomendados
Noize Absorption Index - is the manual trading system that measures the difference of pressure between bears forces and bulls forces. Green line - is a noize free index that showing curent situation. Zero value of index shows totally choppy/flat market.Values above zero level shows how powerfull bullish wave is and values below zero measures bearish forces.Up arrow appears on bearish market when it's ready to reverse, dn arrow appears on weak bullish market, as a result of reverse expectation.
Owl Smart Levels MT5
Sergey Ermolov
4.31 (39)
Versão MT4  |  FAQ O Indicador Owl Smart Levels é um sistema de negociação completo dentro de um indicador que inclui ferramentas populares de análise de mercado, como fractais avançados de Bill Williams , Valable ZigZag que constrói a estrutura de onda correta do mercado e níveis de Fibonacci que marcam os níveis exatos de entrada no mercado e lugares para obter lucros. Descrição detalhada da estratégia Instruções para trabalhar com o indicador Consultor de negociação Owl Helper Chat privado d
A Gann Box (ou Gann Square) é um método de análise de mercado baseado no artigo "Fórmula matemática para previsões de mercado" de WD Gann. Este indicador pode representar três modelos de Quadrados: 90, 52(104), 144. Existem seis variantes de grades e duas variantes de arcos. Você pode plotar vários quadrados em um gráfico simultaneamente. Parâmetros Square — seleção de um modelo quadrado: 90 — quadrado de 90 (ou quadrado de nove); 52 (104) — quadrado de 52 (ou 104); 144 — quadrado universal
HMA Trend Professional MT5
Pavel Zamoshnikov
4.4 (5)
Improved version of the free HMA Trend indicator (for MetaTrader 4) with statistical analysis. HMA Trend is a trend indicator based on the Hull Moving Average (HMA) with two periods. HMA with a slow period identifies the trend, while HMA with a fast period determines the short-term movements and signals in the trend direction. The main differences from the free version: Ability to predict the probability of a trend reversal using analysis of history data. Plotting statistical charts for analyz
Volality Index Scalper
Lesedi Oliver Seilane
5 (1)
Volality Index scalper indicator  Meant for Volality pairs such as Volality 10, 25, 50, 75 and 100 The indicator works on all timeframes from the 1 minute to the monthly timeframe the indicator is non repaint the indicator has 3 entry settings 1 color change on zero cross 2 color change on slope change 3 color change on signal line cross Orange line is your sell signal Blue line is your buy signal.
Trend Line Map Pro MT5
STE S.S.COMPANY
4.17 (12)
O indicador Trend Line Map é um complemento do Trend Screener Indicator. Ele funciona como um scanner para todos os sinais gerados pelo Trend screener (Trend Line Signals). É um Trend Line Scanner baseado no Trend Screener Indicator. Se você não tiver o Trend Screener Pro Indicator, o Trend Line Map Pro não funcionará. It's a Trend Line Scanner based on Trend Screener Indicator. If you don't have Trend Screener Pro Indicator,     the Trend Line Map Pro will not work . Acessando nosso Blog
To get access to MT4 version please click here . - This is the exact conversion from TradingView: "Stochastic Momentum Index" By "UCSgears". - This is a popular version of stochastic oscillator on tradingview. - This is a light-load processing and non-repaint indicator. - Buffers are available for the lines on chart. - You can message in private chat for further changes you need. Thanks for downloading
Volume by Price MT5
Brian Collard
3.6 (5)
The Volumebyprice.com Indicator for MetaTrader 5 features Volume Profile and Market Profile TPO (Time Price Opportunity). Volume and TPO histogram bar and line charts. Volume Footprint charts. TPO letter and block marker collapsed and split structure charts. Static, dynamic and flexible range segmentation and compositing methods with relative and absolute visualizations. Session hours filtering and segment concatenation with Market Watch and custom user specifications. Graphical layering, posit
Magic Finger can help you identify trends and trading opportunities clearly. The finger points to the open position signal, and the discoloration line is confirmed by the trend. If you are a day trader, you can choose to trade during a period of active trading, referring to the discoloration line as the basis for the next order, finger signal as a filter. If you are a trend trader, you can choose a period above H1, wait for the appearance of the finger signal in the key price area, and enter
Laguerre SuperTrend Clouds   adds an Adaptive Laguerre averaging algorithm and alerts to the widely popular SuperTrend indicator. As the name suggests,   Laguerre SuperTrend Clouds (LSC)   is a trending indicator which works best in trendy (not choppy) markets. The SuperTrend is an extremely popular indicator for intraday and daily trading, and can be used on any timeframe. Incorporating Laguerre's equation to this can facilitate more robust trend detection and smoother filters. The LSC uses the
Renko Gold
Ignacio Agustin Mene Franco
Renko Gold! clearly indicates the floors and ceilings where it goes from 4 lines, the line below that marks the floor in green confirming with the thinnest line clarifies the purchase entry, the same is for sale, the top line marks the ceiling and the thinnest red line marks the sale, This indicator works for all temporalities! For Forex and Synthetic Indices markets! It also works for crypto markets! Good profit! World Investor.
O nível Premium é um indicador único com mais de 80% de precisão nas previsões corretas! Este indicador foi testado pelos melhores Especialistas em Negociação por mais de dois meses! O indicador do autor você não encontrará em nenhum outro lugar! A partir das imagens você pode ver por si mesmo a precisão desta ferramenta! 1 é ótimo para negociar opções binárias com um tempo de expiração de 1 vela. 2 funciona em todos os pares de moedas, ações, commodities, criptomoedas Instruções:
The Penta-O is a 6-point retracement harmonacci pattern which usually precedes big market movements. Penta-O patterns can expand and repaint quite a bit. To make things easier this indicator implements a twist: it waits for a donchian breakout in the right direction before signaling the trade. The end result is an otherwise repainting indicator with a very reliable trading signal. The donchian breakout period is entered as an input. [ Installation Guide | Update Guide | Troubleshooting | FAQ | A
Esta é a versão customizada da Gekko para o famoso indicaor Heiken Ashi. Ele amplia o uso das famosas barras de Heiken Ashi e calcula sinais fortes de entrada e saída. Parâmetros de Entrada Number of Bars to Plot Indicator:  número de barras históricas para plotar o indicador, mantenha  baixo para melhor desempenho; Produce Arrow Signals:  escolha se o indicador irá produzir sinais de seta para compras e vendas; Produces Signal Only When a Bar Closes:  coloque true para esperar pelo fechamento d
This indicator is used to compare the relative strength of the trade on the chart against the other several selected symbols. By comparing the price movement of each traded variety based on the same base day, several trend lines of different directions can be seen, reflecting the strong and weak relationship between the several different traded varieties, so that we can have a clearer understanding of the market trend. For example, you can apply this indicator on a EurUSD chart and compare it
No Demand No Supply MT5
Trade The Volume Waves Single Member P.C.
No Demand No Supply   This indicator identifies   No Demand –No Supply candles to your chart and plots volume bars colored according to the signal. It can be applied to all timeframes or to a specific one only. It can also be used as regular volume indicator  with exceptional future of WEIGHTED VOLUME. Furthermore is has an alert notification, sound and email when a signals occurs. The indicator does not repaint but the alert will come on two candles back due to the definition of No Demand No Su
O indicador mostra padrões harmônicos no gráfico   sem repintar   com o mínimo de atraso possível. A busca por topos de indicadores é baseada no princípio de onda de análise de preços. As configurações avançadas permitem que você escolha parâmetros para seu estilo de negociação. Na abertura de uma vela (barra), quando um novo padrão é formado, uma seta da direção provável do movimento do preço é fixada, a qual permanece inalterada. O indicador reconhece os seguintes padrões e suas variedades: AB
Was: $249  Now: $99   Market Profile defines a number of day types that can help the trader to determine market behaviour. A key feature is the Value Area, representing the range of price action where 70% of trading took place. Understanding the Value Area can give traders valuable insight into market direction and establish the higher odds trade. It is an excellent addition to any system you may be using. Inspired by Jim Dalton’s book “Mind Over Markets”, this indicator is designed to suit the
Cumulative delta indicator As most traders believe, the price moves under the pressure of market buying or selling. When someone redeems an offer standing in the cup, the deal is a "buy". If someone pours into the bid standing in the cup - the deal goes with the direction of "sale". The delta is the difference between purchases and sales. A cumulative delta - the difference between the cumulative sum of purchases and sales for a certain period of time. It allows you to see who is currently contr
Indicator and Expert Adviser  EA Available in the comments section of this product. Download with Indicator must have indicator installed for EA to work. Mt5 indicator alerts for bollinger band and envelope extremes occurring at the same time. Buy signal alerts occur when A bullish candle has formed below both the lower bollinger band and the lower envelope  Bar must open and close below both these indicators. Sell signal occur when A bear bar is formed above the upper bollinger band and upp
An indicator of pattern #31 ("Long Island") from Encyclopedia of Chart Patterns by Thomas N. Bulkowski. The second gap is in the opposite direction. Parameters: Alerts - show alert when an arrow appears   Push - send a push notification when an arrow appears (requires configuration in the terminal) GapSize - minimum gap size in points ArrowType - a symbol from 1 to 17 ArrowVShift - vertical shift of arrows in points   ShowLevels - show levels ColUp - color of an upward line ColDn - color of a
Trading Utility for Forex Currency Pairs Only not for Gold  Functions Auto Lot Calculation based on Risk Auto stoploss  Auto TakeProfit Breakeven Auto Close Half % Close in percentage with respect to the PIPs Pending Orders BuyLimit Sell Limit with distances BuyStop Sell Stop    with distances Trading Informations Risk in percentage For Multiple trades Combine Takeprofit and Combine Stoplosses
FFx Watcher Pro MT5
Eric Venturi-Bloxs
3.67 (3)
The FFx Watcher PRO is a dashboard displaying on a single chart the current direction of up to 15 standard indicators and up to 21 timeframes. It has 2 different modes: Watcher mode: Multi Indicators User is able to select up to 15 indicators to be displayed User is able to select up to 21 timeframes to be displayed Watcher mode: Multi Pairs User is able to select any number of pairs/symbols User is able to select up to 21 timeframes to be displayed This mode uses one of the standard indicators
Cansado de traçar linhas de suporte e resistência? A Resistência de suporte é um indicador de período múltiplo que detecta e plota automaticamente linhas de suporte e resistência no gráfico com um toque muito interessante: conforme os níveis de preços são testados ao longo do tempo e sua importância aumenta, as linhas se tornam mais espessas e mais escuras. [ Guia de instalação | Guia de atualização | Solução de problemas | FAQ | Todos os produtos ] Melhore sua análise técnica da noite para o d
Scanner
Ervand Oganesyan
Scanner de mercado multitimeframe e multisímbolo. O indicador testará a estratégia técnica selecionada em todos os instrumentos e prazos de sua escolha e exibirá os resultados da verificação em uma fração de segundo. Caso de uso Inicie o indicador, defina o tempo de negociação e a lógica de negociação. Certifique-se de que os resultados da varredura sejam lucrativos na maioria dos instrumentos e, em seguida, alterne para o gráfico pretendido com um único clique do mouse. Os sinais comerciais e
Your Trend Friend
Luigi Nunes Labigalini
5 (1)
A tendência é sua amiga! Veja a cor do indicador e faça suas operações nessa direção. Ele não repinta. Ou seja, depois que cada candle se fecha, a cor dele é definitiva e não irá se alterar. Você pode focar em movimentos mais curtos e rápidos ou tendências mais longas, basta testar o que melhor se encaixa no seu operacional de acordo com o ativo e tempo gráfico usado. Altere o parâmetro de entrada "Length" e o indicador irá se adaptar automaticamente (quanto maior ele for, maior a tendência a
Introduction The "Two Moving Average Crossover" indicator for MetaTrader 5 (MT5) is a technical analysis tool that displays two moving averages and notifies when the moving averages cross each other. The indicator calculates and plots two moving averages, one of which is faster and the other is slower. When the faster moving average crosses above the slower moving average, it is considered a bullish signal, indicating a potential trend reversal or the start of a new uptrend. Conversely, when th
Antes de tudo, vale ressaltar que esta Ferramenta de Negociação é um Indicador Não Repintante, Não Redesenhante e Não Atrasado, o que a torna ideal para negociação profissional. Curso online, manual do utilizador e demonstração. O Indicador de Conceitos de Ação de Preço Inteligente é uma ferramenta muito poderosa tanto para traders novos quanto experientes. Ele combina mais de 20 indicadores úteis em um único, combinando ideias avançadas de negociação como Análise do Trader do Círculo Intern
This indicator obeys the popular maxim that: "THE TREND IS YOUR FRIEND" It paints a Blue line for BUY and also paints a RED line for SELL. (you can change the colors). It gives alarms and alerts of all kinds. IT DOES NOT REPAINT COLOR and can be used for all currency pairs and timeframes. Yes, as easy and simple as that. Even a newbie can use it to make great and reliable trades. https://www.mql5.com/en/market/product/115553
Mine Farm
Maryna Kauzova
5 (1)
Mine Farm is one of the most classic and time-tested scalping strategies based on the breakdown of strong price levels. Mine Farm is the author's modification of the system for determining entry and exit points into the market... Mine Farm - is the combination of great potential with reliability and safety. Why Mine Farm?! - each order has a short dynamic Stop Loss - the advisor does not use any risky methods (averaging, martingale, grid, locking, etc.) - the advisor tries to get
Os compradores deste produto também adquirem
Atomic Analyst MT5
Issam Kassas
4.6 (20)
Primeiramente, vale ressaltar que este Indicador de Negociação não repinta, não redesenha e não apresenta atrasos, tornando-o ideal tanto para negociação manual quanto automatizada. Manual do utilizador: configurações, entradas e estratégia. O Analista Atômico é um Indicador de Ação de Preço PA que utiliza a força e o momentum do preço para encontrar uma vantagem melhor no mercado. Equipado com filtros avançados que ajudam a remover ruídos e sinais falsos, e aumentam o potencial de negociação.
Atbot
Zaha Feiz
4.97 (30)
AtBot: Como funciona e como usá-lo ### Como funciona O indicador "AtBot" para a plataforma MT5 gera sinais de compra e venda usando uma combinação de ferramentas de análise técnica. Ele integra a Média Móvel Simples (SMA), a Média Móvel Exponencial (EMA) e o índice de Faixa Verdadeira Média (ATR) para identificar oportunidades de negociação. Além disso, pode utilizar velas Heikin Ashi para melhorar a precisão dos sinais. Deixe uma avaliação após a compra e receba um presente especial. ### Princ
Primeiramente, vale ressaltar que este Sistema de Trading é um Indicador Não Repintado, Não Redesenho e Não Atrasado, o que o torna ideal tanto para o trading manual quanto para o automatizado. Curso online, manual e download de predefinições. O "Sistema de Trading Inteligente MT5" é uma solução completa de trading projetada para traders novos e experientes. Ele combina mais de 10 indicadores premium e apresenta mais de 7 estratégias de trading robustas, tornando-o uma escolha versátil para dive
TPSpro RFI Levels MT5
Roman Podpora
4.67 (9)
Reversal First Impulse levels (RFI)      INSTRUCTIONS        RUS       -       ENG              R ecommended to use with an indicator   -   TPSpro  TREND PRO -  Version MT4                 A key element in trading is zones or levels from which decisions to buy or sell a trading instrument are made. Despite attempts by major players to conceal their presence in the market, they inevitably leave traces. Our task was to learn how to identify these traces and interpret them correctly. Main functi
TPSproTREND PrO MT5
Roman Podpora
4.89 (9)
TPSpro TREND PRO  - is a trend indicator that automatically analyzes the market and provides information about the trend and each of its changes, as well as giving signals for entering trades without redrawing! The indicator uses each candle, analyzing them separately. referring to different impulses - up or down impulse. Exact entry points into transactions for currencies, crypto, metals, stocks, indices!  Version MT4               DETAILED DESCRIPTION               R ecommended to use with an
Gold Stuff mt5
Vasiliy Strukov
4.9 (185)
Gold Stuff mt5-um indicador de tendência projetado especificamente para o ouro, também pode ser usado em qualquer instrumento financeiro. O indicador não é redesenhado ou atrasado. O timeframe recomendado é H1. Importante! Entre em contato comigo imediatamente após a compra para obter instruções e bônus!  Você pode obter uma cópia gratuita do nosso indicador Strong Support e Trend Scanner, envie uma mensagem privada. a mim! PARÂMETRO Draw Arrow-incl.desligado. desenhar setas no gráfico. A
Quantum Trend Sniper
Bogdan Ion Puscasu
4.92 (48)
Apresentando       Quantum Trend Sniper Indicator   , o inovador Indicador MQL5 que está transformando a maneira como você identifica e negocia as reversões de tendência! Desenvolvido por uma equipe de traders experientes com experiência comercial de mais de 13 anos,       Indicador de Atirador de Tendência Quântica       foi projetado para impulsionar sua jornada de negociação a novos patamares com sua forma inovadora de identificar reversões de tendência com precisão extremamente alta. ***C
Este é um indicador para MT5 que fornece sinais precisos para entrar em uma negociação sem redesenhar. Ele pode ser aplicado a qualquer ativo financeiro: forex, criptomoedas, metais, ações, índices. Ele fornecerá estimativas bastante precisas e informará quando é melhor abrir e fechar um negócio. Assista o vídeo (6:22) com um exemplo de processamento de apenas um sinal que compensou o indicador! A maioria dos traders melhora seus resultados de negociação durante a primeira semana de negociação c
Trend Screener Pro MT5
STE S.S.COMPANY
4.88 (67)
Desbloqueie o poder da negociação de tendências com o indicador Trend Screener: sua solução definitiva de negociação de tendências, alimentada por lógica difusa e sistema de múltiplas moedas! Eleve sua negociação de tendências com o Trend Screener, o revolucionário indicador de tendências alimentado por lógica difusa. É um poderoso indicador de acompanhamento de tendências que combina mais de 13 ferramentas e recursos premium e 3 estratégias de negociação, tornando-o uma escolha versátil para to
FX Power MT5 NG
Daniel Stein
5 (6)
Receba a sua atualização diária do mercado com detalhes e screenshots através do nosso Morning Briefing aqui no mql5 e no Telegram ! O FX Power MT5 NG é a próxima geração do nosso medidor de força de moeda muito popular de longa data, o FX Power. E o que é que este medidor de força da próxima geração oferece? Tudo o que adorou no FX Power original MAIS Análise de força GOLD/XAU Resultados de cálculo ainda mais precisos Períodos de análise configuráveis individualmente Limite de cálculo personal
FX Volume MT5
Daniel Stein
4.94 (17)
Receba a sua atualização diária do mercado com detalhes e screenshots através do nosso Morning Briefing aqui no mql5 e no Telegram ! O Volume FX é o PRIMEIRO e ÚNICO indicador de volume que fornece uma visão REAL do sentimento do mercado do ponto de vista de um corretor. Ele fornece uma visão incrível de como os participantes do mercado institucional, como corretores, estão posicionados no mercado Forex, muito mais rápido do que os relatórios COT. Ver essas informações diretamente no seu gráfi
Easy By Sell is a market indicator for opening and closing positions. It becomes easy to track market entries with alerts. It indicates trend reversal points when a price reaches extreme values ​​and the most favorable time to enter the market. it is as effective as a Fibonacci to find a level but it uses different tools such as an algorithm based on ATR indicators and Stochastic Oscillator. You can modify these two parameters as you wish to adapt the settings to the desired period. My othe
IX Power MT5
Daniel Stein
4.17 (6)
O   IX Power   traz finalmente a precisão imbatível do FX Power para símbolos não-Forex. Determina com exatidão a intensidade das tendências a curto, médio e longo prazo nos seus índices, acções, mercadorias, ETFs e até criptomoedas favoritos. Pode   analisar tudo o que   o seu terminal tem para oferecer. Experimente e veja como   o seu timing melhora significativamente   quando negoceia. Características principais do IX Power Resultados de cálculo 100% precisos e sem repintura - para tod
TrendMaestro5
Stefano Frisetti
note: this indicator is for METATRADER4, if you want the version for METATRADER5 this is the link:  https://www.mql5.com/it/market/product/108106 TRENDMAESTRO ver 2.4 TRENDMAESTRO recognizes a new TREND in the bud, he never makes mistakes. The certainty of identifying a new TREND is priceless. DESCRIPTION TRENDMAESTRO identifies a new TREND in the bud, this indicator examines the volatility, volumes and momentum to identify the moment in which there is an explosion of one or more of these data a
Golden Spikes Premium
Kwaku Bondzie Ghartey
Golden Spikes Detector Acknowledgement and Dedications:  The name of this indicator was Inspired by an Original; Mr Grant Koopman; a Knowledgeable and experienced Synthetics trader. I dedicate this indicator to Mr Grant.  Overview: The Golden Spikes Premium is a groundbreaking trading indicator meticulously crafted for the Boom and Crash indices on the Deriv market. Tailored to meet the needs of discerning traders, this powerful tool operates exclusively on the one-minute timeframe, providin
Agora US $ 147 (aumentando para US $ 499 após algumas atualizações) - Contas ilimitadas (PCs ou Macs) Manual do usuário do RelicusRoad + vídeos de treinamento + acesso ao grupo de discórdia privado + status VIP UMA NOVA FORMA DE OLHAR PARA O MERCADO O RelicusRoad é o indicador de negociação mais poderoso do mundo para forex, futuros, criptomoedas, ações e índices, oferecendo aos traders todas as informações e ferramentas necessárias para se manterem rentáveis. Fornecemos análises técnica
XQ Indicator MetaTrader 5
Marzena Maria Szmit
3.5 (2)
Step into the realm of Forex trading with confidence and precision using XQ, a cutting-edge Forex indicator designed to elevate your trading game to unprecedented heights. Whether you're a seasoned trader or just stepping into the world of currency exchange, XQ Forex Indicator empowers you with the insights and signals needed to make informed trading decisions. The signal conditions are a combination of three indicators, and XQ Forex Indicator only display  medium and long-term trends . The ind
Trend Hunter MT5
Andrey Tatarinov
5 (1)
Trend Hunter é um indicador de tendência para trabalhar nos mercados Forex, criptomoeda e CFD. Uma característica especial do indicador é que ele segue a tendência com confiança, sem alterar o sinal quando o preço ultrapassa ligeiramente a linha de tendência. O indicador não é redesenhado; um sinal para entrar no mercado aparece após o fechamento da barra. Ao avançar ao longo de uma tendência, o indicador mostra pontos de entrada adicionais na direção da tendência. Com base nesses sinais, voc
The Smart Liquidity Profile is color-coded based on the importance of the traded activity at specific price levels, allowing traders to identify significant price levels such as support and resistance levels, supply and demand zones, liquidity gaps, consolidation zones, Buy-Side/Sell-Side Liquidity and so on.  Smart Liquidity Profile allows users to choose from a number of different time periods including 'Auto,' 'Fixed Range,' 'Swing High,' 'Swing Low,' 'Session,' 'Day,' 'Week,' 'Month,' 'Quart
Este painel mostra os últimos   padrões harmónicos   disponíveis para os símbolos seleccionados, pelo que poupará tempo e será mais eficiente /   versão MT4 . Indicador gratuito:   Basic Harmonic Pattern Colunas do indicador Symbol :   aparecem os símbolos seleccionados Trend :   de alta ou de baixa Pattern :   tipo de padrão (gartley, borboleta, morcego, caranguejo, tubarão, cifra ou ABCD) Entry :   preço de entrada SL:   preço de paragem de perda TP1:   preço do 1º take profit TP2:   preç
ATrend
Zaha Feiz
4.5 (2)
ATREND: Como Funciona e Como Usá-lo #### Como Funciona O indicador "ATREND" para a plataforma MT5 é projetado para fornecer aos traders sinais robustos de compra e venda, utilizando uma combinação de metodologias de análise técnica. Este indicador aproveita principalmente o Intervalo Verdadeiro Médio (ATR) para medir a volatilidade, juntamente com algoritmos de detecção de tendências para identificar possíveis movimentos de mercado. Deixe uma mensagem após a compra e receba um brinde especial.
Volatility Trend System - é um sistema de negociação que fornece sinais para entradas. O sistema de volatilidade fornece sinais lineares e pontuais na direção da tendência, bem como sinais para sair dela, sem redesenhar ou atrasos. O indicador de tendência monitora a direção da tendência de médio prazo, mostra a direção e sua mudança. O indicador de sinal é baseado em mudanças na volatilidade e mostra as entradas no mercado. O indicador está equipado com diversos tipos de alertas. Pode se
Advanced Supply Demand MT5
Bernhard Schweigert
4.53 (15)
Atualmente com 33% de desconto! A melhor solução para qualquer Trader Novato ou especialista! Este indicador é uma ferramenta de negociação exclusiva, de alta qualidade e acessível porque incorporamos uma série de recursos proprietários e uma nova fórmula. Com esta atualização, você poderá mostrar fusos horários duplos. Você não só será capaz de mostrar um TF mais alto, mas também mostrar ambos, o TF do gráfico, MAIS o TF mais alto: MOSTRANDO ZONAS ANINHADAS. Todos os traders de Oferta e Demanda
ICT, SMC, SMART MONEY CONCEPTS, SMART MONEY, Smart Money Concept, Support and Resistance, Trend Analysis, Price Action, Market Structure, Order Blocks, BOS/CHoCH,   Breaker Blocks ,  Momentum Shift,   Supply&Demand Zone/Order Blocks , Strong Imbalance,   HH/LL/HL/LH,    Fair Value Gap, FVG,  Premium  &   Discount   Zones, Fibonacci Retracement, OTE, Buy Side Liquidity, Sell Side Liquidity, BSL/SSL Taken, Equal Highs & Lows, MTF Dashboard, Multiple Time Frame, BigBar, HTF OB, HTF Market Structure
Matrix Arrow Indicator MT5
Juvenille Emperor Limited
5 (14)
O   Matrix Arrow Indicator MT5   é uma tendência única 10 em 1 seguindo um indicador multi-timeframe   100% sem repintura   que pode ser usado em todos os símbolos/instrumentos:   forex ,   commodities ,   criptomoedas ,   índices ,   ações .  O  Matrix Arrow Indicator MT5  determinará a tendência atual em seus estágios iniciais, reunindo informações e dados de até 10 indicadores padrão, que são: Índice de movimento direcional médio (ADX) Índice de canal de commodities (CCI) Velas clássicas de
Torne-se um Negociador Breaker e lucre com as mudanças na estrutura do mercado à medida que o preço reverte. O indicador de quebra de bloco de pedidos identifica quando uma tendência ou movimento de preço está chegando à exaustão e pronto para reverter. Ele o alerta sobre mudanças na estrutura do mercado, que normalmente ocorrem quando uma reversão ou uma grande retração está prestes a ocorrer. O indicador usa um cálculo proprietário que identifica rupturas e momento do preço. Toda vez que
Gartley Hunter Multi
Siarhei Vashchylka
5 (8)
Gartley Hunter Multi - An indicator for searching for harmonic patterns simultaneously on dozens of trading instruments and on all possible timeframes. Manual (Be sure to read before purchasing) | Version for MT4 Advantages 1. Patterns: Gartley, Butterfly, Shark, Crab. Bat, Alternate Bat, Deep Crab, Cypher 2. Simultaneous search for patterns on dozens of trading instruments and on all possible timeframes 3. Search for patterns of all possible sizes. From the smallest to the largest 4. A
Blahtech Supply Demand MT5
Blahtech Limited
4.54 (13)
Was: $299  Now: $99   Supply Demand uses previous price action to identify potential imbalances between buyers and sellers. The key is to identify the better odds zones, not just the untouched ones. Blahtech Supply Demand indicator delivers functionality previously unavailable on any trading platform. This 4-in-1 indicator not only highlights the higher probability zones using a multi-criteria strength engine, but also combines it with multi-timeframe trend analysis, previously confirmed swings
Order Block Hunter MT5
Noha Mohamed Fathy Younes Badr
5 (1)
Order block hunter indicator is the best indicator for  hunt the order blocks that area where there has been a large concentration of limit orders waiting to be executed Order blocks are identified on a chart by observing previous price action and looking for areas where the price experienced significant movement or sudden changes in direction .This indicator does that for you by using very complicated codes and helps you to take the best areas To buy and sell because it make marks at the best a
Native Channels
BeeXXI Corporation
5 (2)
This indicator recognizes all support and resistance levels. A number of unique high-performance techniques have been applied, which made the existence of this indicator possible. All formed channels are naturally visible: horizontal linear linear parabolic cubic (Polynomial 3 degrees - Wave) This is due to a bundle of approximating channels. The formed channels form "standing waves" in a hierarchical sequence. Thus, all support and resistance levels are visible. All parameter management is
Mais do autor
Best Pivot Point Indicator MT5
Abdelkhabir Yassine Alaoui
5 (1)
Best Pivot Point Indicator  display   pivot points   and   support and resistance   lines for the intraday trading. It calculates them using its own formula based on the previous trading session The indicator can display the following levels in addition to plain pivot points: Previous session's High and Low, today's Open. Sweet spots. Fibonacci levels. Camarilla pivots. Midpoint pivots.
FREE
Usdjpy Hunter
Abdelkhabir Yassine Alaoui
This is a classic trading strategy based on two Moving Averages crossover. customized for usdjpy with a Good risk management strategy RR 1/2 . (    Long when fast MA crosses slow MA from below and Short when fast MA crosses slow MA from above ) TF : 5MIN MAX Lot size to use : 2% e.g : Balance =100 => lot size = 0.02 Balance =1000 => lot size = 0.20 Balance =10000 => lot size = 2 ------
FREE
Basing Candles
Abdelkhabir Yassine Alaoui
Basing Candles indicator is an automatic indicator that detects and marks basing candles on the chart. A basing candle is a candle with body length less than 50% of its high-low range. A basing candle or basing candlestick is a trading indicator whose body length is less than half of its range between the highs and lows. That's less than 50% of its range. The indicator highlights the basing candles using custom candles directly in the main chart of the platform. The percentage criterion can be
FREE
Fixed Range Volume Profile MT5
Abdelkhabir Yassine Alaoui
2 (1)
Perfil de volume de intervalo fixo automático com alertas para MT5 Este indicador mostra onde o preço passou mais tempo, destacando níveis importantes que podem ser usados na negociação. e pode mostrar a densidade de preços ao longo do tempo, delineando os níveis de preços mais importantes, a área de valor e o valor de controle de uma determinada sessão de negociação. Este indicador pode ser anexado a timeframes entre M1 e D1 e mostrará o perfil de mercado para sessões diárias, semanais, me
Spread Actual
Abdelkhabir Yassine Alaoui
This indicator Displays current spread in the main window of the chart. You can modify the font parameters, indicator's position and the normalization of the spread value. The spread is redrawn after each tick, ensuring the most current and active spread value. This can be useful for brokers with variable spreads or with spreads that are widened often. You can also enable a spread label to be shown near the current Bid line. you can also set  alert : Email, and push notifications.
Volume Profile For MT5
Abdelkhabir Yassine Alaoui
Volume Profile is a very useful indicator . it allows you to spot the price levels where important price action took place. It is similar to support and resistance levels but with a different logic. ( Check Out  Fixed Range Volume Profile MT5  ) One of the first thing that traders mark up when analyzing a chart is support and resistance. Volume Profile can be used for doing that too. The indicator scans the defined number of previous bars and calculates the volume of activity at each price
DXY Correlation
Abdelkhabir Yassine Alaoui
O indicador pode ser usado para negociação de correlação dxy. ele calcula o índice do dólar (USDX ou DXY) usando os pares de moedas XAU/USD, EUR/USD, USD/JPY, GBP/USD, USD/CAD, USD/CHF e USD/SEK. Para negociá-los, você precisa encontrar um padrão de análise técnica confirmado no gráfico DXY e procurar um par de moedas correlacionado que tenha a mesma imagem em seu gráfico de preços.
Support And Resistance indicator that can display round levels and zones . It shows them directly on the chart, providing an easy help when you want to set stop-loss or take-profit level, or when you want to see the next market target.   If an asset price is moving down and bounces back up, the level is called support (think: price floor). If an asset price is moving upward and hits a level where it reverses downward, this is called resistance (think: price ceiling).
Filtro:
555903
50
555903 2024.05.07 11:00 
 

O usuário não deixou nenhum comentário para sua avaliação

Responder ao comentário