RSI Trend Bars
- Indicadores
- Chang Hou
- Versão: 1.0
- Ativações: 5
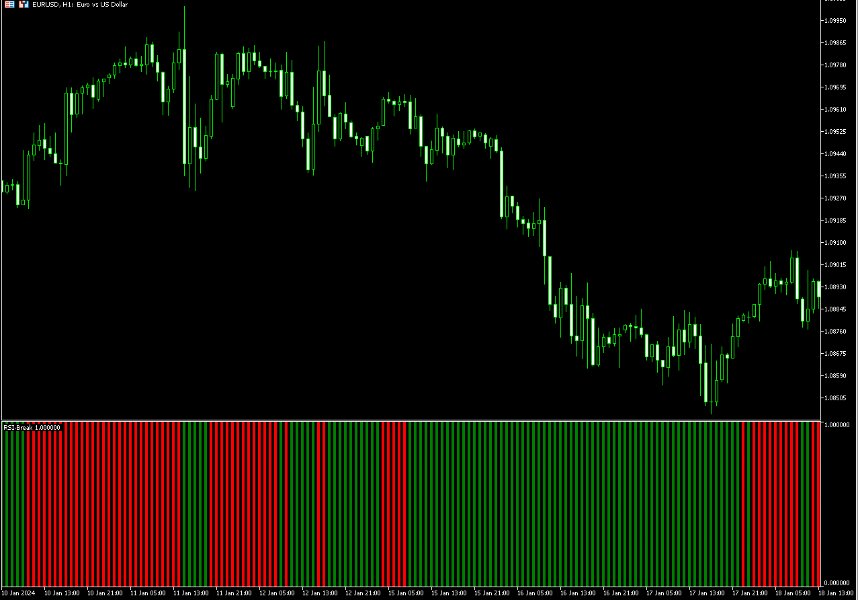
RSI Barometer Pro provides traders and investors with intuitive insights into market sentiment and potential trend reversals by representing RSI values using red and green bars.
The meticulous design of red and green bars in RSI Barometer Pro visually showcases market dynamics. When the bars appear green, it indicates that the RSI is below 50, suggesting a relatively stable market phase. Conversely, when the bars turn red, it signifies that the RSI is above 50, indicating potential market volatility. This intuitive visual effect simplifies the analysis process, allowing users to quickly grasp market conditions and make informed decisions.
RSI Barometer Pro has undergone rigorous testing and real-time data analysis, proving its exceptional accuracy in predicting market turning points. This accuracy provides traders and investors with valuable trading signals, enhancing their ability to navigate the markets effectively.
Additionally, RSI Barometer Pro offers customizable parameters to adapt to various market conditions and asset types. This flexibility allows users to fine-tune the indicator based on their specific trading strategies and preferences, ensuring optimal performance across different investment environments.
By harnessing the strengths of the traditional RSI indicator and incorporating innovative design and functionality optimizations, RSI Barometer Pro sets a new standard for precise and efficient market analysis. It empowers traders and investors with a comprehensive understanding of market trends, enabling them to make timely and well-informed trading decisions.
Discover the power of RSI Barometer Pro and revolutionize your market analysis. Stay ahead of the competition and seize profitable opportunities with confidence.


