ChartGetTools
- Indicadores
- Wartono
- Versão: 1.3
- Atualizado: 29 janeiro 2024
- Ativações: 20
All in one Indicator. Multiple market analysis tools. Non-Repaint Oscillator signals, Trend lines, Price channel, Fibonacci levels, Support and Resistance, Regression, Pivot levels, Candle Strength and Oversold/Overbought line detector. Includes buttons to hide or show. Advanced algorithms to detect important reversal points and draw trend lines or shapes automatically in appropriate areas. A simple and professional chart display, user friendly and easier to understand for faster and accurately decisions.
Sends warning messages to all alert features available in Metatrader 4. With the option to activate or deactivate.
Recommended timeframe: M5 to H4.
Instrument/symbols: any
Advantages:
- Each feature can be hidden or displayed, making it possible to use just one or several features and collaborate with your own strategy.
- Each feature has its own settings independently, except the circle of arrows. So, you are free to adjust it according to your trading strategy.
- Maximum License Activations.
- Non-Repaint arrows.
- Responsive button and Candle Strength bars display
- Auto color adjustment based on the market direction.
Parameters
- Show Main Trend. Option true/false to show/hide the Main trend. The Main trend can be seen on the screenshot. Highly recommended to set it to be true except you have your own plan/reason or you want to use certain part of its features to complete your existing strategy.
- Main Trend Period. The Period of Bars to calculate the main trend.
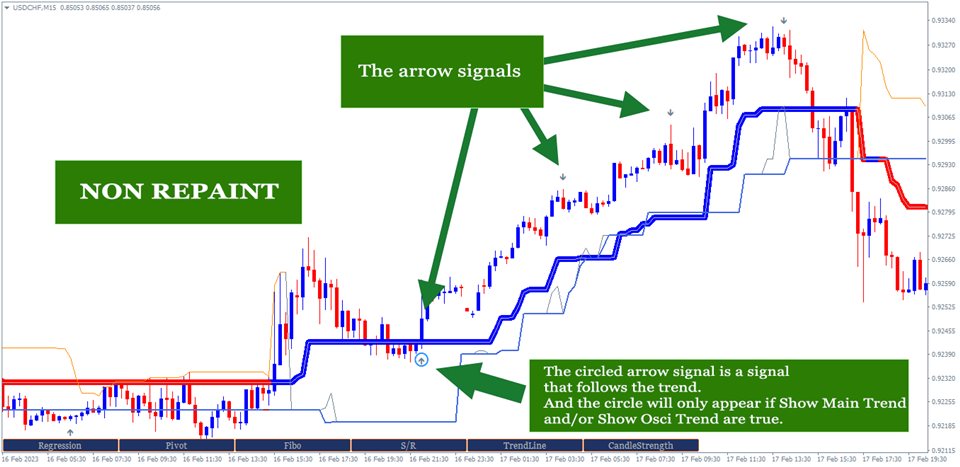
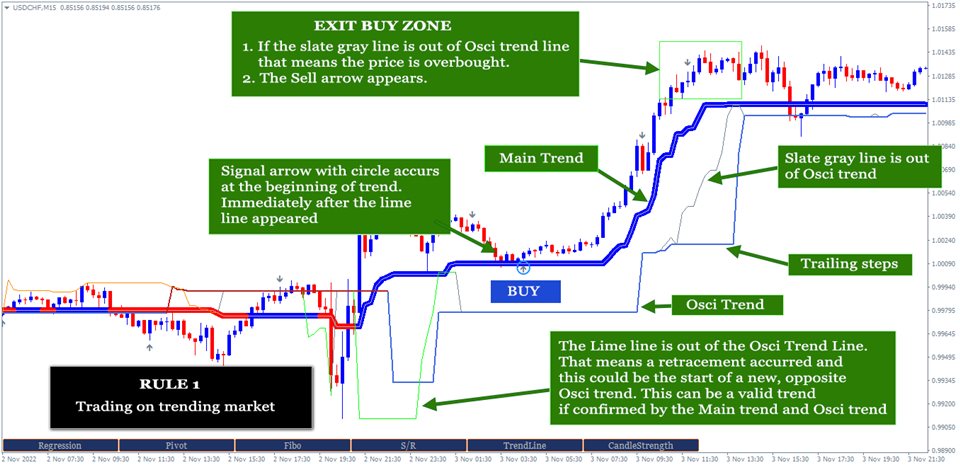
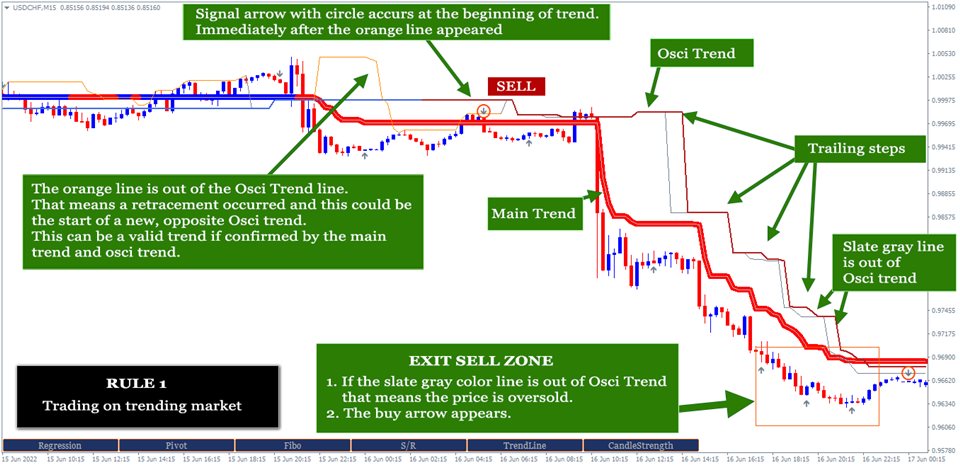
- Show Osci Trend. Option true/false to show/hide the Osci trend. The Osci trend can be seen on the screenshot. It is a second trend that can detect the trend early. And this trend is also followed by the 3 other sub trends. Their colors are Orange, SlateGray and Lime. Orange color appears at the beginning of downtrend, Lime at the beginning of uptrend and SlateGray appears as sign of oversold or overbought. Highly recommended to set it to be true except you have your own plan/reason or you want to use certain part of its features to complete your existing strategy. The circle of arrows will not appear if Show Main Trend: false and Show Osci trend: false.
- Osci Trend Period. The Period of Bars to calculate Osci trend.
- Show Signal Arrows. Option to show/hide the signal arrows. Non repaint, non-lagging arrows as a trigger of trading exit/entry. Arrows with circle are the trend following arrows that can be used for entry and the ones without circle are for exit with the rules can be seen on the screenshot.
- Signal Period. The period of signal. Recommended minimum value 5 and maximum 30.
- Use Maximum Bars. Option to use the number of bars to calculate trend and signals. Recommended to set it by default if you get low performance in your MT4.
- Maximum Bar. Define the number of bars here if point 7 above is true. The default value 500.
- Show Analysis buttons. Option true/false to show/hide tool buttons at the bottom of chart.
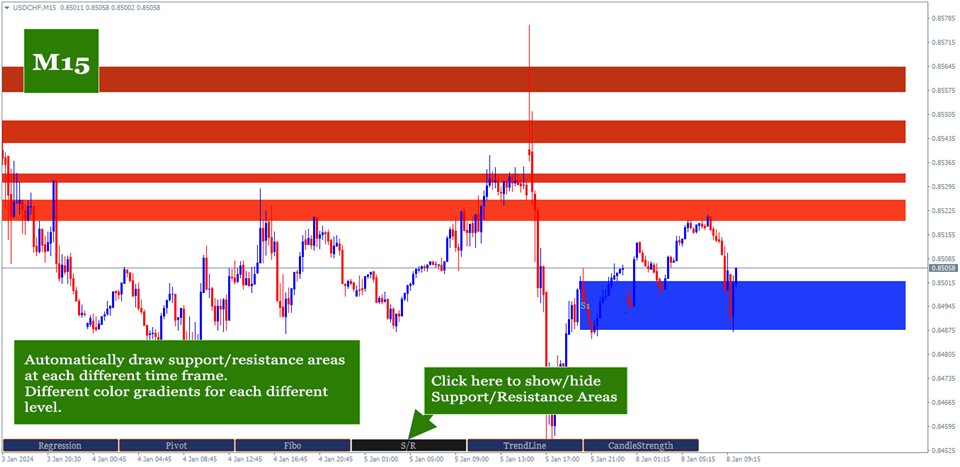
- Support/Resistance Period. The indicator will look for reversal points at every number of bars specified here until up to 1000 bars back. And it will draw Support/Resistance area based on the data.
- Support/Resistance Strength. This value is the minimum number of reversal points - highest high and lowest low - in the past that the indicator must count to display Support/Resistance area. The idea is that the higher the number, the higher the probability of a reversal in the future. If the entered value is not found in the existing history, the indicator will not display Support/Resistance area. So, the lower the value entered, the more Support/Resistance areas will possibly be displayed but with lower strength and vice versa.
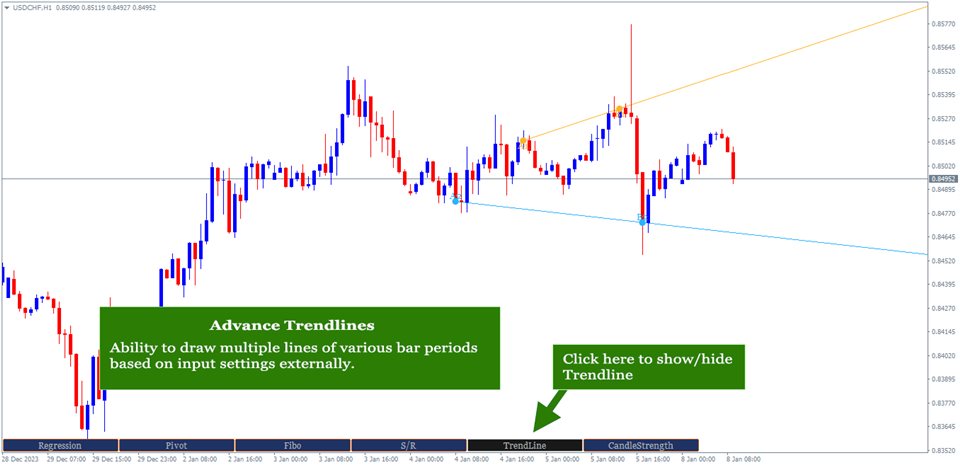
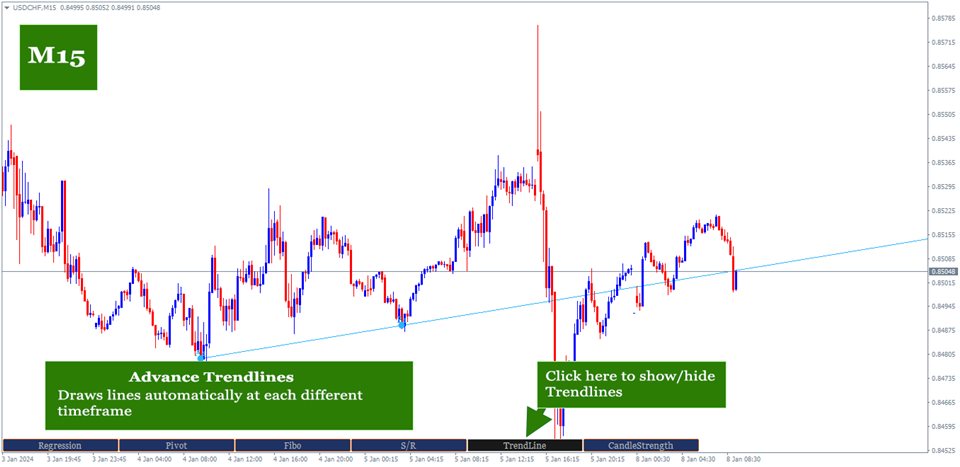
- Bars to search TrendLines. This is the maximum number of bars that the indicator must count to display a trendline. Within the range of bar values specified here, the indicator will look for the most relevant points and the most frequent price reversals to draw trend lines.
- TrendLines Period. This is similar to point 8 above. But this is to determine the trend line. The indicator will look for reversal points at every number of bars specified here until up to the number of 'Bars to search TrendLines' specified in point 12 above.
- Max. Lines Deviation It is the maximum distance between the last close price and upper/lower trendlines. The indicator will only display the lines inside the range.
- Max. Trendlines/Side. The indicator can display more than one line per 'up/down' side based on the values specified in points 12 and 13 above. With the condition that trend line is found based on the input above. Maximum value of this input is 30 for performance reason.
- Bars Multiplier. It is the multiplier of the value of ' Bars to search TrendLines' (point 12). This value will be used only if ' Max. Trendlines/Side' specified in point 15 is more than 1. The formula is Bars to search TrendLines x line index x Bars Multiplier. Example: Bars to search TrendLines= 300, Max. Trendlines/Side= 4 and Bars Multiplier= 2 then the indicator will draw the trend lines with such conditions:
- The first 2 lines (upper & lower) are drawn from the calculation of the last 600 bars. 300 x 1 x 2
- The second 2 lines (upper & lower) are drawn from the calculation of the last 1200 bars. 300 x 2 x 2
- The third 2 lines (upper & lower) are drawn from the calculation of the last 1800 bars. 300 x 3 x 2
- The fourth 2 lines (upper & lower) are drawn from the calculation of the last 2400 bars. 300 x 4 x 2
- And so on, if 'Max. Trendlines/Side' is added more in value.
- Trendlines width. The width of trend lines. The trend line thickness.
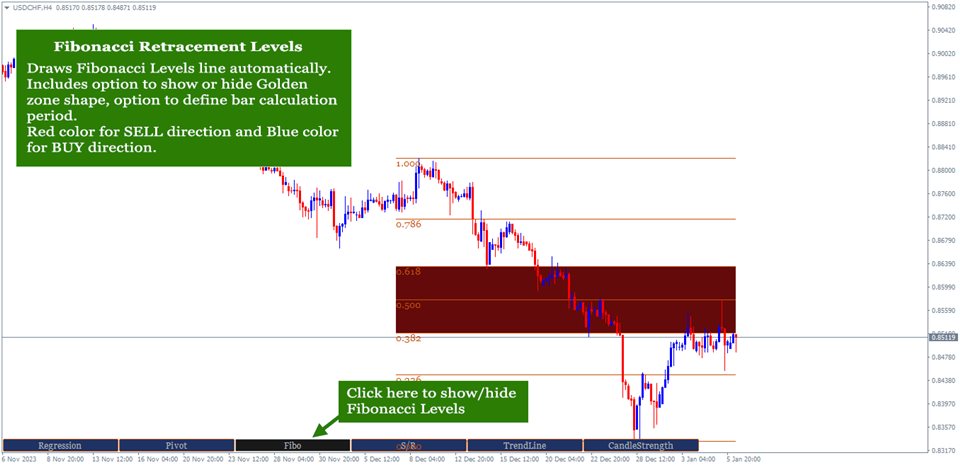
- Fibo Period. Number of bars to calculate the Fibonacci Retracement Levels.
- Shape Fibo Golden Ratio. Option to draw background color in the Golden Ratio area for Fibonacci Retracement Levels.
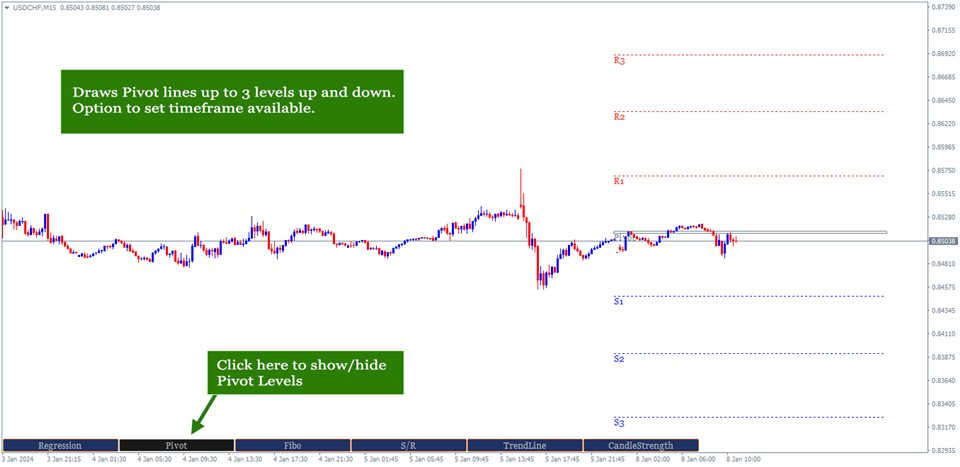
- Pivot Levels Timeframe. Option Timeframe to draw Pivot Levels. The Levels are drawn from the data of the last candle close of the timeframe specified here. Recommended timeframe D1 to trade on timeframe M5 to H1 and W1 to trade on H1 or H4.
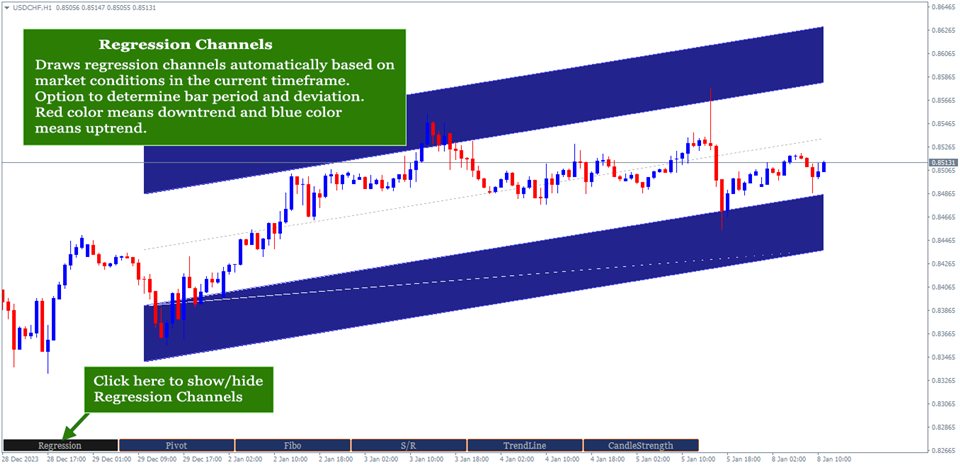
- Regression Period. The period of bars to calculate the regression channel.
- Regression Deviation. The deviation of regression channel.
- Follow Trend. Option true/false to send alert message only if the arrow is following direction of the current Main trend.
- Follow Osci Trend. Option true/false to send alert message only if the arrow is following direction of the current Osci trend.
- PopUp Alert. Option true/false to display alert message on the chart.
- Mobile Notification Alert. Option true/false to send alert message to MT4 mobile application.
- Email Alert. Option true/false to alert message to the email. The email setup is required in the MT4 platform.
Entry Rules:
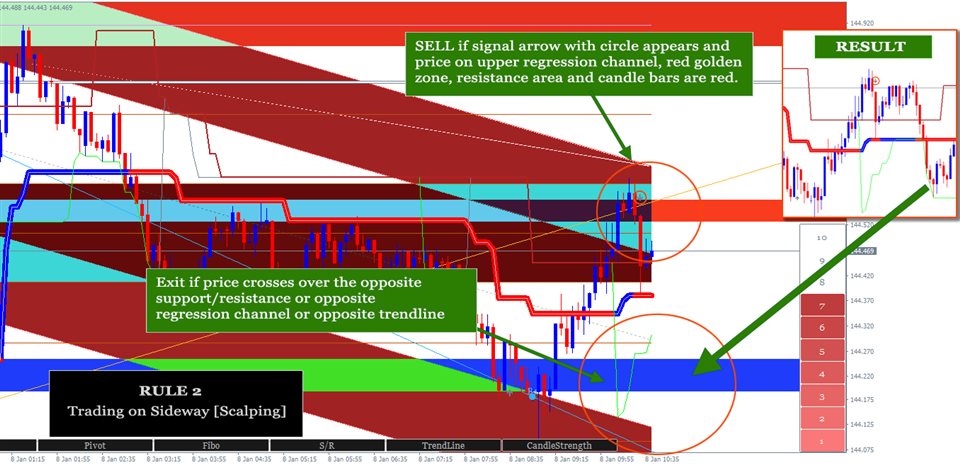
Consists of two rules: trading entry on a trending and trading entry on a sideway/ranging market, this is usually to take a small profit (scalping) when price is going up and down. Both have the same general rules, which are as follows:
- Follow the arrow with the circle. This arrow with the circle automatically follows the trend direction with the note if Show Main Trend: true and/or Show Osci Trend: true.
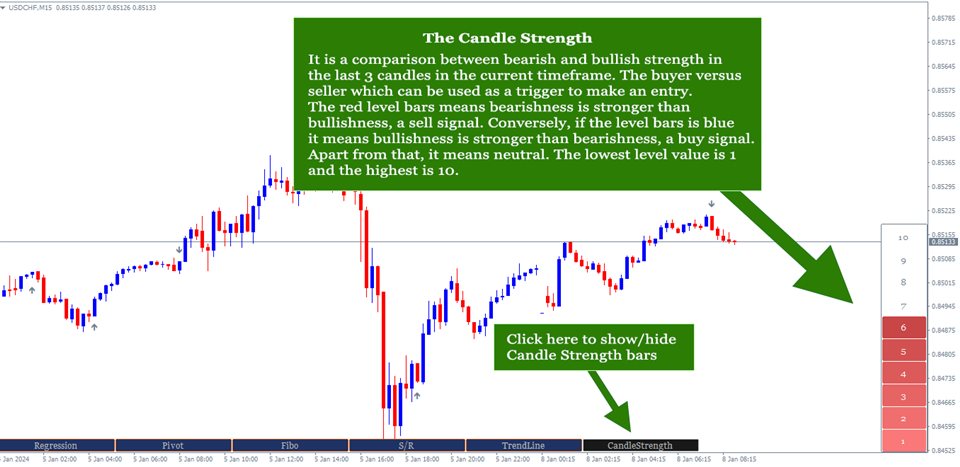
- Follow the direction of Candle Strength. Blue bars mean Buy and red bars mean Sell. Higher value of bars is better.
- At least one of these conditions matches. Price on the regression channel or price on the golden zone area.
The rules for trending market:
- The general 3 rules above are met.
- Several previous candles moved stronger with long candles in the direction of the trend followed by candles that started to weaken,
- Price is in the beginning of trend signed by lime/orange line is out of Osci trend. See the screenshot for more details.
- Price closely around the Main trend line and Osci trend line.
- The more these conditions match the better. Price on the regression channel, price on the golden zone area, price on the support/resistance area or price touches the upper/lower trend line.
The rules for sideways/ranging market:
- The general 3 rules above are met.
- The more these conditions match the better. Price on the regression channel, price on the golden zone area, price on the support/resistance area or price touches the upper/lower trend line.
Exit Rules:
How to exit depends on the type of entry mentioned above. Exit for trading on trending and exit for trading on sideways.
For trending trade, exit the market if one of the following conditions is met:
- The Slate Gray line is out of Osci Trend line and the opposite signal arrow is triggered.
- More than three opposite arrows have appeared after the entry time and the price touches the opposite support/resistance area or opposite regression channel.
- The opposite entry signal as mentioned on the Entry Rules above occurs.
Please note that the above entry/exit rules only apply if the indicator parameters are set by default or at least there are no significant changes. Otherwise, you can improvise based on your own knowledge, experience, strategy and trading style using the features available on the ChartGetTools indicator. It is all in one indicator and you can deactivate certain feature, if necessary, e.g. display a trend only or signal only, etc.
The trading example video: https://youtu.be/FX3mP5kfRV8
If you have any question, please don't hesitate to contact me.

