Simple Chart Analysis Tool
- Indicadores
- Guillaume Jouans
- Versão: 1.2
- Atualizado: 2 janeiro 2024
- Ativações: 5
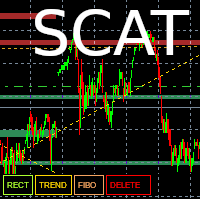
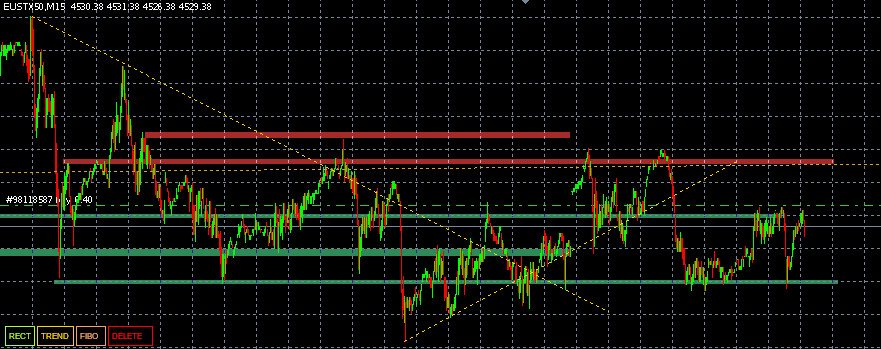
This tool allows you to draw trend lines, polarity zones, supports and resistances, Fibonacci retracements and save them.
The user has 4 buttons which are displayed in their default configuration at the bottom left of the main window :
- A "Level" button allowing you to draw support and resistance zones
- A “Trend” button allowing you to draw a trend line
- A “Fibo” button allowing you to display a Fibonacci retracement
- A “DELETE” button which allows you to delete the selected object.
After pressing the button (excluding DELETE button) of your choice, a first click determines the original position of the object, a second its final position.
Any addition to the chart is saved, allowing the trader to capitalize on his analyses.
Any modification is saved. If the user decides to assign a color to an object created with this tool, the color is saved.
The backup is made in the file indicated by the user (by default the file name is "chartAnalysis_Record.csv"). The objects added depend on the broker, so the user will be able to import their analyzes on all of their accounts, as long as they belong to the same broker.
Finally, it is possible to share this file, thus allowing anyone who has the SCAT tool to benefit from its analyses.
