• Visão global
  • Comentários
  • Discussão

Relative Trend Index

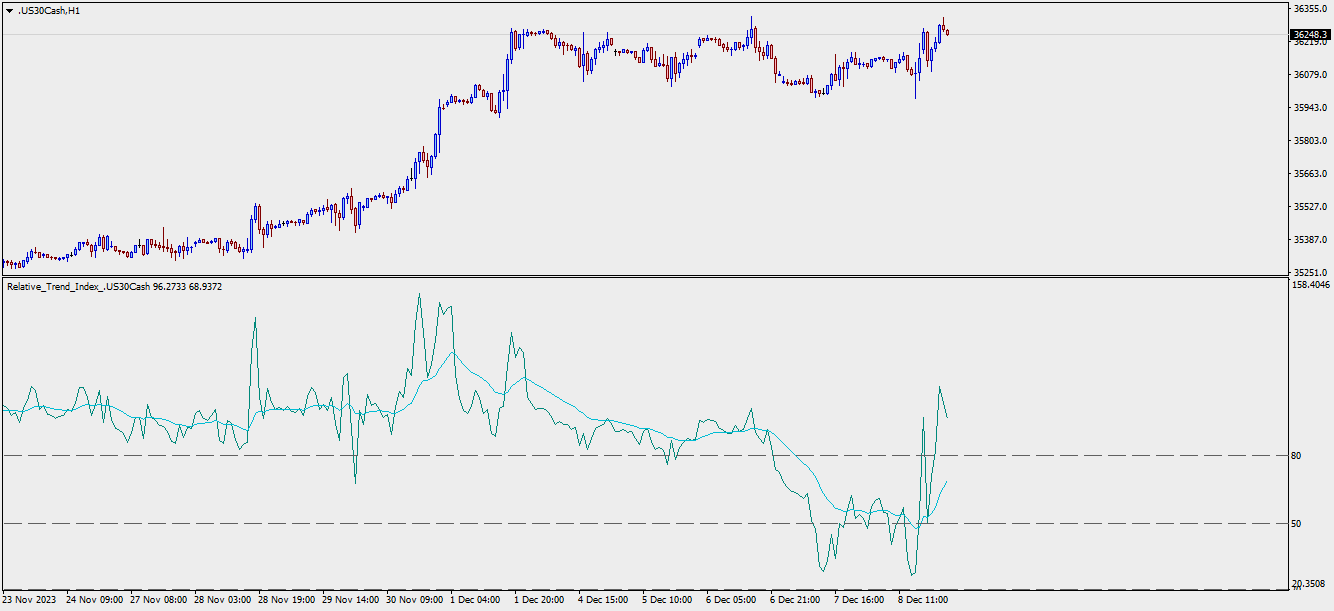
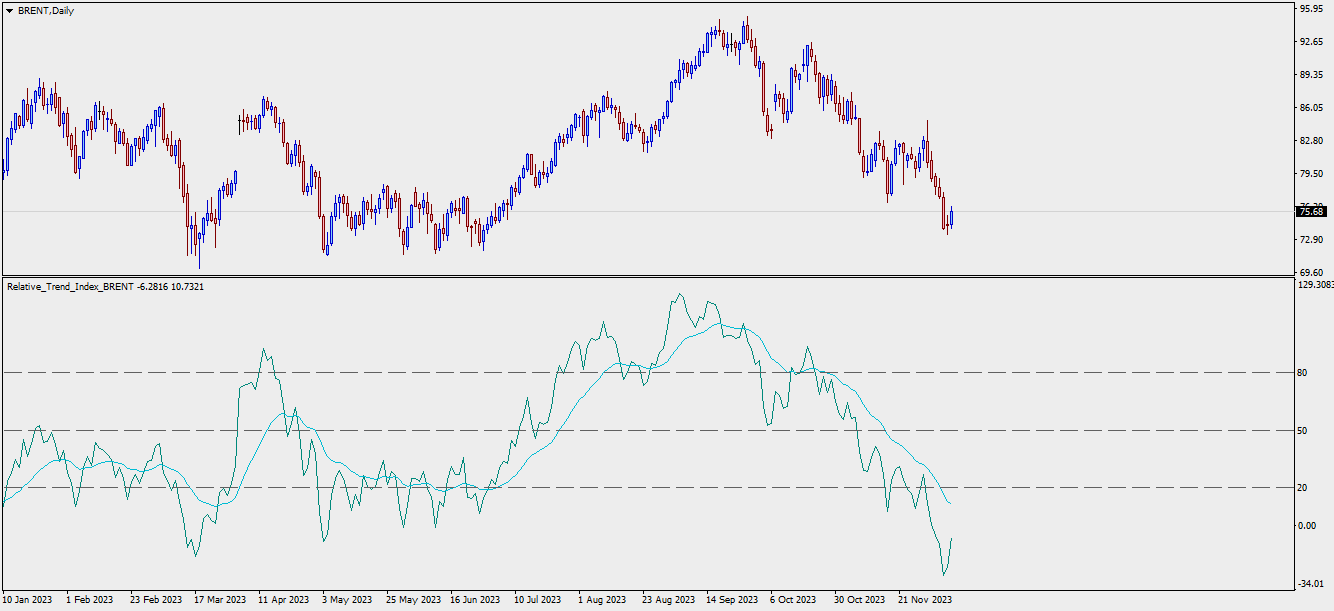
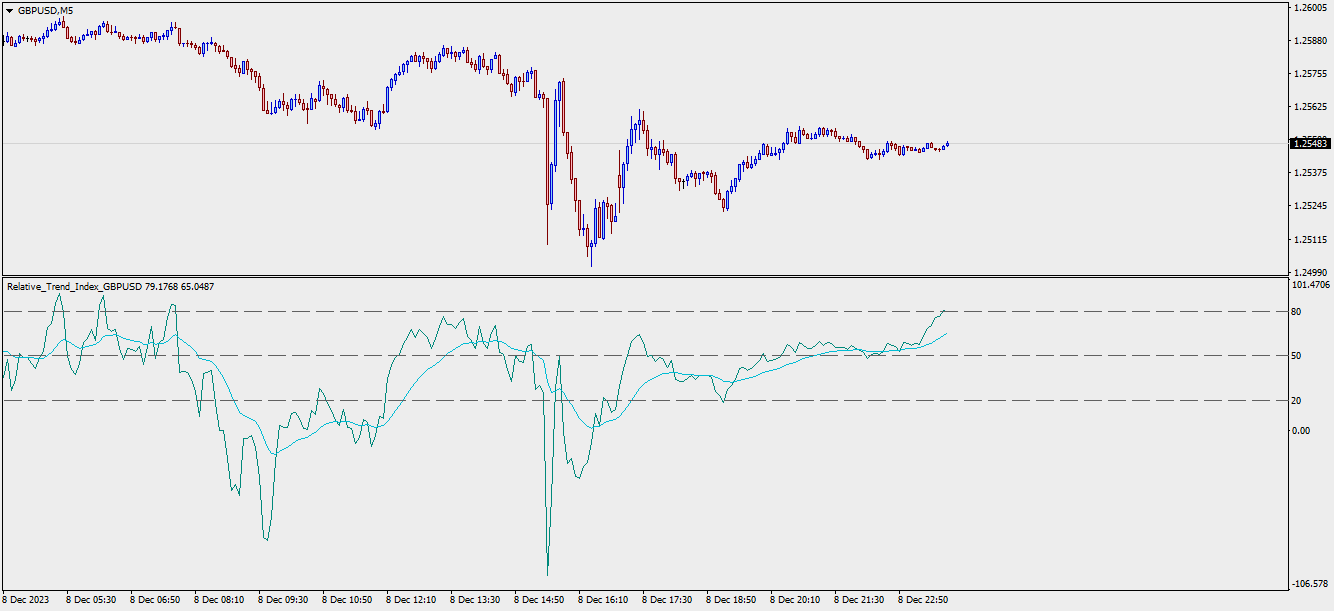
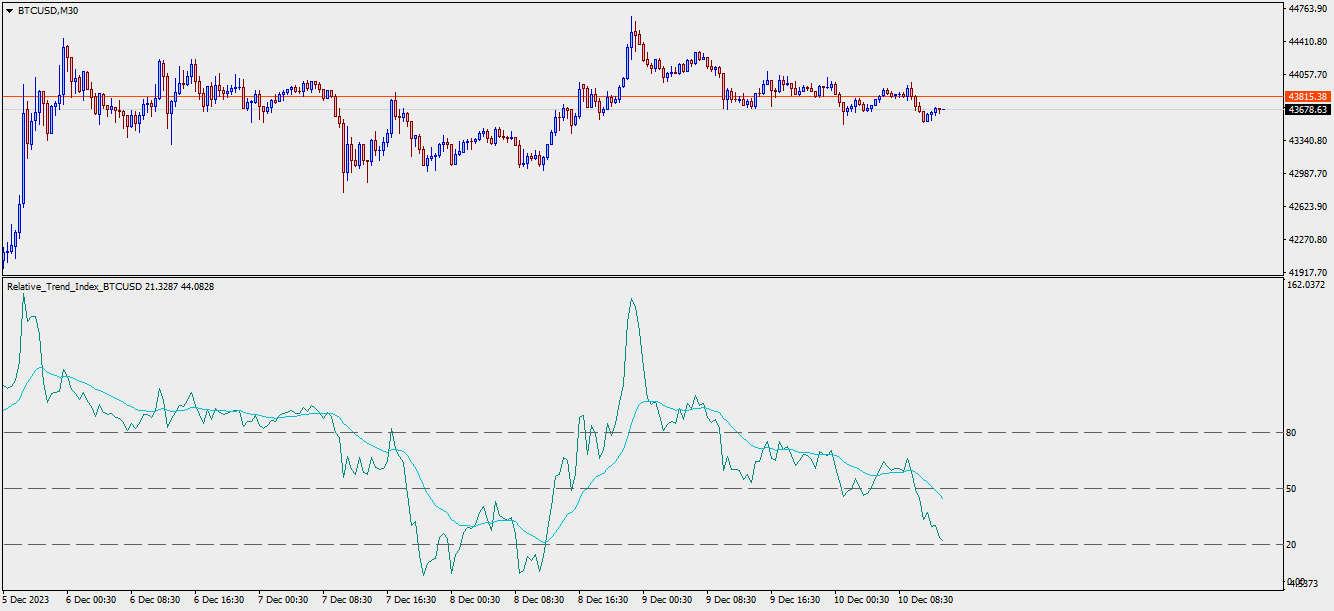
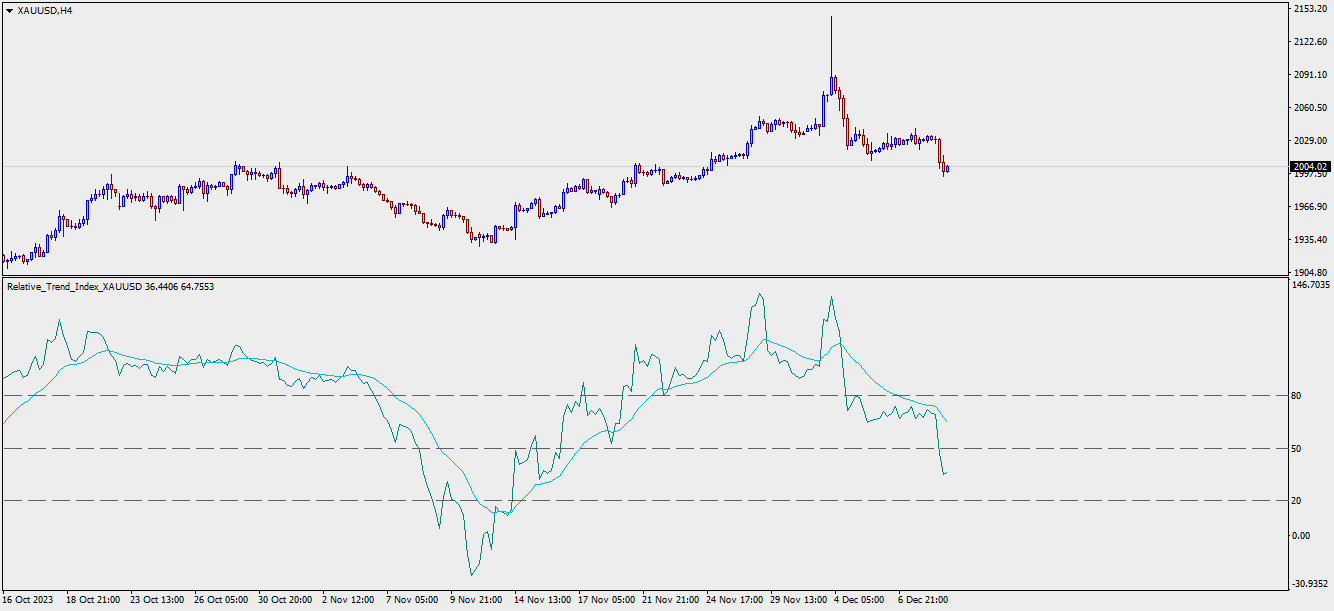
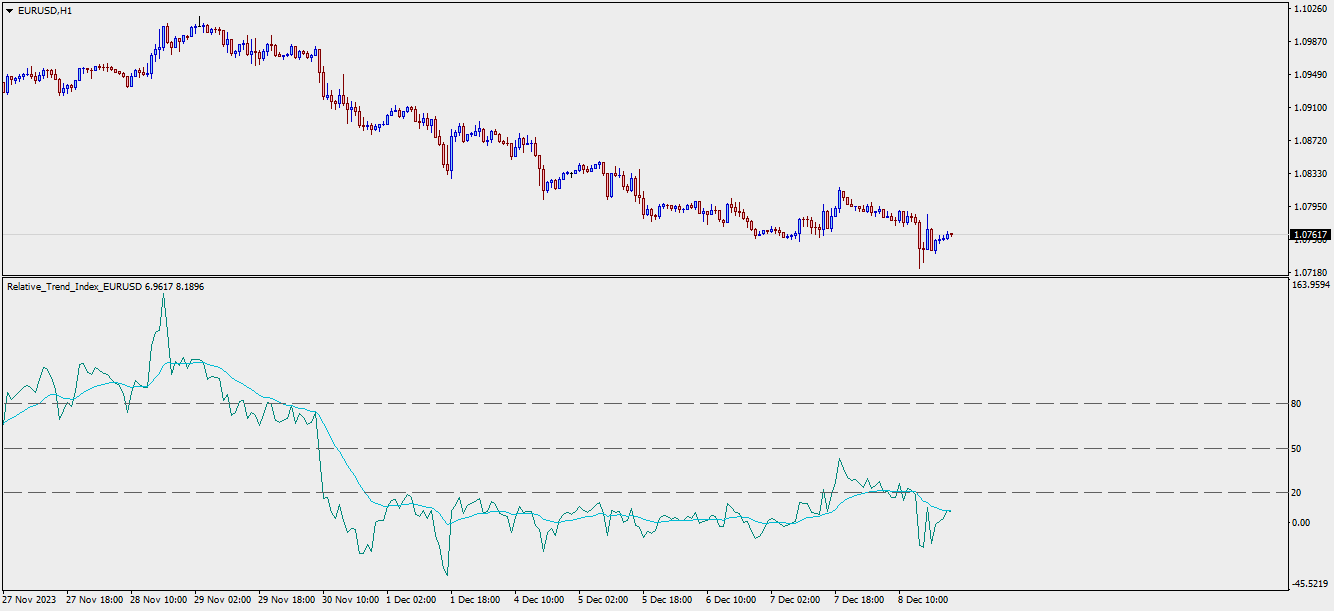
O indicador é traduzido de outra linguagem de programação para MQL. O RTI é uma ferramenta poderosa para identificar a tendência do gráfico de uma forma oscilante.

Aqui estão algumas notas do programador original:

Visão Geral
O Índice de Tendência Relativa (RTI) desenvolvido por Zeiierman é uma ferramenta inovadora de análise técnica projetada para medir a força e a direção da tendência do mercado. Ao contrário de alguns indicadores tradicionais, o RTI possui uma capacidade distinta de se adaptar e responder à volatilidade do mercado, ao mesmo tempo que minimiza os efeitos de flutuações menores e de curto prazo do mercado.

O Índice de Tendência Relativa combina características de seguimento de tendências e de reversão à média, juntamente com uma abordagem personalizável e intuitiva da força da tendência, e a sua sensibilidade à ação dos preços faz com que este indicador se destaque.

Benefícios da utilização deste RTI em vez do RSI
O Índice de Força Relativa (RSI) e o Índice de Tendência Relativa (RTI) são ambos indicadores técnicos poderosos, cada um com os seus próprios pontos fortes.
No entanto, existem diferenças fundamentais que tornam o RTI indiscutivelmente mais sofisticado e preciso, especialmente quando se trata de identificar tendências e áreas de sobrecompra/sobrevenda (OB/OS).
Produtos recomendados
The indicator is the advanced form of the MetaTrader 4 standard Fibonacci tool. It is unique and very reasonable for serious Fibonacci traders. Key Features Drawing of Fibonacci retracement and expansion levels in a few seconds by using hotkeys. Auto adjusting of retracement levels once the market makes new highs/lows. Ability to edit/remove any retracement & expansion levels on chart. Auto snap to exact high and low of bars while plotting on chart. Getting very clear charts even though many ret
Std Channels
Muhammed Emin Ugur
Std Channels The Std Channels Indicator is a technical indicator that uses standard deviation to create five channels around a price chart. The channels are used to identify support and resistance levels, as well as trends and reversals. The indicator is calculated by first calculating the standard deviation of the price data over a specified period of time. The channels are then created by adding and subtracting the standard deviation from the price data. The five channels are as follows: Upper
Esta ferramenta de software foi projetada para agilizar o processo de criação de linhas de tendência horizontais e retângulos em cinco cores personalizáveis à sua escolha. Desenhar linhas de tendência horizontais precisas no MT5 pode ser um desafio, mas com este indicador, você pode criá-las sem esforço nas cores que atendem às suas preferências. Além disso, nossa ferramenta fornece uma exibição clara dos níveis de preços associados às linhas horizontais que você desenha. Valorizamos seu
-   Real price is 70$   - 50% Discount ( It is 35$ now ) Contact me for instruction, any questions! Introduction The Elliott Wave in technical analysis describes price movements in the financial market that are related to changes in trader sentiment and psychology. The 5 W Pattern (Known as 3 Drives) is an Elliott Wave pattern that is formed by 5 consecutive symmetrical moves up or down. In its bullish form, the market is making 5 drives to a bottom before an uptrend forms. In a bearish 5-dri
1 of 10 for 69$ . Next Price is 89$ SMC Unmitigated Finding is a indicator for find unmitigated supply and demand in previous legs of price Settings Zigzag Settings ZZDepth - by Default is 12. ZZDeviation - by Default is 5. ZZBackStep - by Default is 3. Rectangle Settings SupportColor-  color for Support line.  ResistanceColor  -  color for Resistance line. Settings Num of Show -  Number of Support & Resistance Show.
Индикатор ищет подобную ценовую структуру, сравнивая с последней ценовой структурой. Размер паттерна (грубо говоря количество переломов зигзага) настраивается (всегда меньше на 1, чем введено - нулевой перелом не считается). Все найденные совпадения отмечаются прямоугольником. Так же к паттернам существует быстрая навигация с помощью кнопочек "Next patt" и "Prev patt". В индикатор вшиты два индикатора типа ЗигЗа г : стандартный зигзаг и пользовательский , моей разработки. Параметры настройки ста
-   Real price is 90$   - 50% Discount ( It is 45$ now ) Contact me for instruction, any questions! Introduction V Bottoms and Tops are popular   chart patterns   among traders due to their potential for identifying trend reversals. These patterns are characterized by sharp and sudden price movements, creating a V-shaped or inverted V-shaped formation on the   chart . By recognizing these patterns, traders can anticipate potential shifts in market direction and position themselves according
A top-quality implementation of the famous  Zig Zag  indicator, which needs no introduction. It is completely coming from original algorithm.  After you have this indicator, you will no need any more indicator for opposite direction of trend. Trading direction of TREND Very easy to understand and set  It implements a multi-timeframe dashboard Buy and Sell signals on same chart  Working M5-M15-M30-H1-H4 and D1  After the purchase, please contact me for to learn how to use it. 
The Sensitive Volume indicator is an indicator designed to generate trading signals. The purpose of this indicator is to generate signals from the highest probability of trading. Using a number of price movements and a set of indicator properties to generate these signals.  Easy to use, simple and understandable to the user. With alert features, user signals can be reached quickly.  Visually the user can easily recognize the signals. This indicator will not repaint. Parameters Trend_Period - p
Scanner and Dashboard for Money Flow Index for MT4 The Money Flow Index (MFI) is a technical oscillator that uses price and volume data for identifying overbought or oversold signals in an asset. It can also be used to spot divergences which warn of a trend change in price. The oscillator moves between 0 and 100. Advantages of the Scanner: - Full Alert Options. - Multi Timefrare  - Works for all instruments including Currencies, Indices, Commodities, Cryptocurrencies and Stocks. - Fully customis
Very special indicator of Joe Dinapoli which is a derivative from traditional MACD indicator. It shows the precise price, at which MACD will show line crossing and trend shifting. Also, this level is known one period ahead of time.You can constantly reassess your current position by looking at this studying a variety of timeframes. When you are in a trade, you have a feel for how much time you have for the trade to go your way by looking at the distance between the MACD Predictor line and the
The trend beads indicator is software that does not include trend indicators such as moving average, Bollinger bands. This indicator works entirely with price and bar movements. The purpose of the indicator is to calculate the most likely trends. To assist the user in determining trend trends. The user determines the trend direction with the colors on the screen. You can use this indicator alone as a trend indicator. Or with other indicators suitable for your strategy. Trade Rules Rising trend
The Fibonacci Target indicator is an indicator that uses the Low, High and Fibonacci levels. This indicator has the ability to predict the target. It tries to determine the target that the graph will go on average and draws a target region. The indicator also serves as an oscillator. It can be used as a trend oscillator after making the necessary settings. This indicator is helpful to your strategy. There is no signal generating capability. Parameters TargetPeriod - Target line period setting
MYEwo
Ahmet Metin Yilmaz
The MyEwo indicator is a tool that helps you to find the short maturity direction in your chart. Default input values are frequently used values in this indicator. You can find and use your own values according to your own trend detection and pairs you will trade. My advice is to use a moving average in order to understand the long maturity trend on your main graph (200 and higher may be appropriate). The M5 graphics will be simplify Scalping style Trade transactions that you will use . You can
Teknolojide ki yüksek gelişim, üretim, e ticaret, lojistik vb tüm sektörlerde kullanıma başlandığı gibi artık finansal piyasalarda da “ yapay zeka ve algoritma” kullanılmaya başlandı. Smart Algoritma indikatörü; kaynak kodu içinde yer alan algoritma ve yapay zekası ile hiçbir analize ihtiyaç duyulmadan gün içi bütün forex enstrümanları için size buy ve sell sinyalleri yanında hedef kanal (gün içi en yüksek ve en düşük seviyeler) verir. İndikatör texti aşağıda ki bölümlerden oluşur ve herkesin a
Introduction to Smart Renko The main characteristics of Renko Charting concern price movement. To give you some idea on its working principle, Renko chart is constructed by placing a brick over or below when the price make the movement beyond a predefined range, called brick height. Therefore, naturally one can see clear price movement with less noise than other charting type. Renko charting can provide much clearer trend direction and it helps to identify important support and resistance level
The Multi Channel Trend indicator was developed to help you determine the trend direction by drawing channels on the graphical screen. It draws all channels that can be trending autonomously. It helps you determine the direction of your trend. This indicator makes it easy for you to implement your strategies. The indicator has Down trend lines and Up trend lines. You can determine the price direction according to the multiplicity of the trend lines. For example , if the Down trend lines start to
Ticks To Levels
Mikhail Kontsevoy
This indicator counts ticks and graphically displays the price levels, on which the greatest number of them was detected. Thus, it sufficiently accurately determines the levels of support and resistance. The indicator will be useful for traders who trade breakout or scalping strategies. Features Technical analysis provides several ways for finding levels of support and resistance. Ticks to Levels provides another, fairly accurate, way of determining these levels empirically. The criterion for
Very special indicator of Joe Dinapoli which is a derivative  of a Detrended Oscillator. Through a set of parametric equations, a predicting oscillator is created that forecasts, one period ahead of time, overbought and oversold conditions. The resulting predictor values are expressed as bands on the bar chart, both above and below the market. It may be mistaken as a Bollinger Band but has no resemblance to it whatsoever. The Predictor bands may be used in a variety of ways to aid in entering an
The Stochastic Alerts indicator is an advanced model of the standard stochastic indicator. This indicator is different from the standard indicator 2 level warning feature has been added. For example, the user will be able to receive warnings at levels above 80 and below 20. It can change the levels you wish. For example 60 and 40 can do. This depends on the user's discretion. you can turn the alerts on or off as desired. Parameters Kperiod - Standard stochastic kperiod setting Dperiod - Stan
Flag Pattern indicator is an indicator designed to find flag patterns. Bullish and bear find flag patterns. It finds these patterns by its own algorithm. The display is easy to use and simple. Features Bullish and bear find flag patterns. Draw patterns on the graphic screen. invalid flag patterns. alert the user with the alert feature. Flag patterns have the ability to change colors. Parameters MinSplashHeight -  Min. height of splash setting MaxBarsDuration -  Max bars before crossing setting
The indicator is the advanced form of the MetaTrader 4 standard Fibonacci tool. It is unique and very reasonable for serious Fibonacci traders. Key Features Drawing of Fibonacci retracement and expansion levels in a few seconds by using hotkeys. Auto adjusting of retracement levels once the market makes new highs/lows. Ability to edit/remove any retracement & expansion levels on chart. Auto snap to exact high and low of bars while plotting on chart. Getting very clear charts even though man
FiboZag
Andriy Sydoruk
Indicator FiboZag - transfer the indicator to the chart and the Fibonacci levels will be built automatically on the last ZigZag turn. The main advantage lies in the correct construction of Fibonacci levels and markup of price levels. Simple, visual and effective use. The indicator is not redrawn and does not lag. Works on all currency pairs and on all timeframes.
Introduction to X3 Chart Pattern Scanner X3 Cherart Pattern Scanner is the non-repainting and non-lagging indicator detecting X3 chart patterns including Harmonic pattern, Elliott Wave pattern, X3 patterns, and Japanese Candlestick patterns. Historical patterns match with signal patterns. Hence, you can readily develop the solid trading strategy in your chart. More importantly, this superb pattern scanner can detect the optimal pattern of its kind. In addition, you can switch on and off individu
Auto Levels
Yaroslav Varankin
Auto Level this tool is able to determine the levels of support and resistance. search and display when the price has broken through the level and when it pushed off from it. the indicator can be useful if you use resistance support levels in your trading. or the highs and lows of the price, then it will greatly simplify your work and help you more quickly and more accurately determine the rebound or breakdown of the current trend or tendencies level. blue line bottom uptrend red line on top dow
LinearRegressionDecomposition ( LRD ) Linear Regression Decomposition has been calculated using a very complex method. Basically, by examining the retractions of the price movements of the instruments on the Metatrader platform, it is aimed to decompose these movements linearly. The indicator is shown on the graph with two separate lines. The red line is our main indicator and handles the price divergence. The blue line filters the red signal. For example, for a buy signal to occur: the red
ICT Core Content Concepts turned into indicator plus all previous tools known from the  Position Smart Indicator . This makes it the Full PSI Private Version ( read more ) restricted up to now but available only after the Mentorship Core Content was made public on   YouTube. You will find many price action study tools like: Central Bank Dealing Range - CBDR Asian Range FLOUT Profiles and SD targets on the CBRD, Asian Range and Flout both on the   wicks   and on the   bodies Seek & Destroy Profil
Introducing our advanced MQL4 Indicator, a groundbreaking tool for identifying support and resistance zones with unmatched precision. Elevate your trading strategy with a host of features, including a dual-color upper and lower box system that allows for easy visual recognition of market trends. Key Features: Dual-Color Box for the Support and Resistance Zones Customize your analysis with dual-color box. The upper and lower boxes offer distinct colors, providing a clear visual representation o
Scanner and Dashboard for Cycle Sniper ATR Fibo Channels Indicator As users know indicator draws Fibonacci Channels and arrows according to the user's settings. With CS ATR Fibo Channels Scanner, you will have the ability to watch the market. - Multi Timeframe - Multi Instrument Enter your parameters to watch (as explained in Cycle Sniper ATR Fibo Channels Indicator )  - If you cho0se "Arrows by ATR Levels" , you will receive the potential reversal arrrows. - If you choose "Arrows by M
Upgraded version 1.5 , Arrow added on to indicate Buy and Sell Signal,  The indicator is an ossicaltor that targets  the highest buying and lowest selling levels , the signal indicated by the two lines crossing  above and below zero line 0 HOW IT WORKS? Buying : you want to place your buy Entry when the yellow line is above the blue line ; stop loss just a few pips below the swing low , take profit when the lines cross again  - A Buy arrow will also appear when the crossing appears Selling:   yo
Os compradores deste produto também adquirem
Gann Made Easy
Oleg Rodin
4.88 (98)
Gann Made Easy é um sistema de negociação Forex profissional e fácil de usar, baseado nos melhores princípios de negociação usando a teoria do sr. W. D. Gann. O indicador fornece sinais precisos de COMPRA e VENDA, incluindo níveis de Stop Loss e Take Profit. Você pode negociar mesmo em movimento usando notificações PUSH. Entre em contato comigo após a compra! Vou compartilhar minhas dicas de negociação com você e ótimos indicadores de bônus de graça! Provavelmente você já ouviu muitas vezes sobr
Gold Stuff
Vasiliy Strukov
4.9 (269)
Gold Stuff-um indicador de tendência projetado especificamente para o ouro, também pode ser usado em qualquer instrumento financeiro. O indicador não é redesenhado ou atrasado. O timeframe recomendado é H1. O EA Gold Stuff Expert Advisor está escrito neste indicador, você pode encontrá-lo no meu perfil. Importante! Entre em contato comigo imediatamente após a compra para obter instruções e bônus!  Você pode obter uma cópia gratuita do nosso indicador Strong Support e Trend Scanner, envie um
Atomic Analyst
Issam Kassas
5 (3)
Primeiramente, vale ressaltar que este Indicador de Negociação não repinta, não redesenha e não apresenta atrasos, tornando-o ideal tanto para negociação manual quanto automatizada. Manual do utilizador: configurações, entradas e estratégia. O Analista Atômico é um Indicador de Ação de Preço PA que utiliza a força e o momentum do preço para encontrar uma vantagem melhor no mercado. Equipado com filtros avançados que ajudam a remover ruídos e sinais falsos, e aumentam o potencial de negociação.
Trend Pulse
Mohamed Hassan
5 (4)
Please contact me after purchase to immediately get your PDF strategy + documentation for Trend Pulse !  Official release price of $89  ( 3 /50 copies left). Next price is $199 . Introducing Trend Pulse , a unique and robust indicator capable of detecting bullish, bearish, and even ranging trends! Trend Pulse uses a special algorithm to filter out market noise with real precision. If the current symbol is moving sideways, Trend Pulse will send you a ranging signal, letting you know that it
Scalper Inside PRO
Alexey Minkov
4.75 (60)
An exclusive indicator that utilizes an innovative algorithm to swiftly and accurately determine the market trend. The indicator automatically calculates opening, closing, and profit levels, providing detailed trading statistics. With these features, you can choose the most appropriate trading instrument for the current market conditions. Additionally, you can easily integrate your own arrow indicators into Scalper Inside Pro to quickly evaluate their statistics and profitability. Scalper Inside
Trend Punch
Mohamed Hassan
4.91 (22)
This indicator is unstoppable when combined with our other indicator called  Support & Resistance . After purchase, send us a message and you will get it   for  FREE as a BONUS! Introducing Trend Punch , the revolutionary forex trend indicator that will transform the way you trade! Trend Punch is uniquely designed to provide precise buy and sell arrows during strong market trends, making your trading decisions clearer and more confident. Whether you're trading major currency pairs or exotic sym
ACTUALMENTE COM 26% DE DESCONTO A melhor solução para qualquer novato ou comerciante especializado! Este Indicador é uma ferramenta comercial única, de alta qualidade e acessível, porque incorporámos uma série de características proprietárias e uma nova fórmula. Com apenas UM gráfico, pode ler a força da moeda para 28 pares de Forex! Imagine como a sua negociação irá melhorar porque é capaz de apontar o ponto exacto do gatilho de uma nova tendência ou oportunidade de escalada? Manual do u
ACTUALMENTE 31% DE DESCONTO!! A melhor solução para qualquer novato ou comerciante especializado! Este indicador é uma ferramenta comercial única, de alta qualidade e acessível, porque incorporámos uma série de características proprietárias e uma fórmula secreta. Com apenas UM gráfico, dá alertas para todos os 28 pares de moedas. Imagine como a sua negociação irá melhorar porque é capaz de identificar o ponto exacto de desencadeamento de uma nova tendência ou oportunidade de escalada! Con
PZ Day Trading
PZ TRADING SLU
3.67 (3)
Este indicador detecta reversões de preços em zigue-zague, usando apenas análise de ação de preços e um canal donchiano. Ele foi projetado especificamente para negociações de curto prazo, sem repintar ou retroceder. É uma ferramenta fantástica para traders astutos, com o objetivo de aumentar o tempo de suas operações. [ Guia de instalação | Guia de atualização | Solução de problemas | FAQ | Todos os produtos ] Surpreendentemente fácil de negociar Fornece valor em cada período de tempo Imple
Currency Strength Wizard é um indicador muito poderoso que fornece uma solução completa para uma negociação bem-sucedida. O indicador calcula o poder deste ou daquele par forex usando os dados de todas as moedas em vários intervalos de tempo. Esses dados são representados em uma forma de índice de moeda fácil de usar e linhas de energia de moeda que você pode usar para ver o poder desta ou daquela moeda. Tudo o que você precisa é anexar o indicador ao gráfico que deseja negociar e o indicador mo
Enigmera
Ivan Stefanov
5 (4)
ENIGMERA: O núcleo do mercado https://www.enigmera.com Introdução Este indicador e sistema de negociação é uma abordagem notável aos mercados financeiros. ENIGMERA utiliza os ciclos fractais para calcular com precisão os níveis de suporte e resistência. Mostra a autêntica fase de acumulação e dá direcções e objectivos.  Um sistema que funciona quer estejamos numa tendência ou numa correção.  Como é que funciona? O ENIGMERA é composto por três linhas: a linha de suporte/resistência, a linha
Actualmente 20% OFF ! A melhor solução para qualquer novato ou comerciante especializado! Este software de painel de instrumentos está a funcionar em 28 pares de moedas. É baseado em 2 dos nossos principais indicadores (Advanced Currency Strength 28 e Advanced Currency Impulse). Dá uma grande visão geral de todo o mercado Forex. Mostra valores avançados de força da moeda, velocidade de movimento da moeda e sinais para 28 pares de divisas em todos os (9) períodos de tempo. Imagine como a sua
Gold Channel   é um indicador baseado na volatilidade, desenvolvido com um algoritmo de tempo especifico para o par XAUUSD que consiste em encontrar possíveis correções no mercado. Este indicador mostra duas linhas exteriores, uma interior (linha de retração) e um sinal de seta, onde a teoria do canal consiste em ajudar a identificar condições de sobrecompra e sobrevenda no mercado. O preço do mercado cairá geralmente entre os limites do canal. Se os preços tocarem ou se moverem para fora do can
Order Block Hunter
Noha Mohamed Fathy Younes Badr
5 (1)
Order block hunter indicator is the best indicator for  hunt the order blocks that area where there has been a large concentration of limit orders waiting to be executed Order blocks are identified on a chart by observing previous price action and looking for areas where the price experienced significant movement or sudden changes in direction .This indicator does that for you by using very complicated codes and helps you to take the best areas To buy and sell because it make marks at the best a
FX Power MT4 NG
Daniel Stein
5 (12)
Receba a sua atualização diária do mercado com detalhes e screenshots através do nosso Morning Briefing aqui no mql5 e no Telegram ! O FX Power MT4 NG é a próxima geração do nosso medidor de força de moeda muito popular de longa data, o FX Power. E o que é que este medidor de força da próxima geração oferece? Tudo o que adorou no FX Power original MAIS Análise de força GOLD/XAU Resultados de cálculo ainda mais precisos Períodos de análise configuráveis individualmente Limite de cálculo personal
Scalper Vault
Oleg Rodin
5 (29)
Scalper Vault é um sistema profissional de escalpelamento que fornece tudo o que você precisa para um escalpelamento bem-sucedido. Este indicador é um sistema de negociação completo que pode ser usado por comerciantes de forex e opções binárias. O período de tempo recomendado é M5. O sistema fornece sinais de seta precisos na direção da tendência. Ele também fornece sinais superiores e inferiores e níveis de mercado Gann. Os indicadores fornecem todos os tipos de alertas, incluindo notificações
Antes de tudo, vale ressaltar que esta Ferramenta de Negociação é um Indicador Não Repintante, Não Redesenhante e Não Atrasado, o que a torna ideal para negociação profissional. Curso online, manual do utilizador e demonstração. O Indicador de Conceitos de Ação de Preço Inteligente é uma ferramenta muito poderosa tanto para traders novos quanto experientes. Ele combina mais de 20 indicadores úteis em um único, combinando ideias avançadas de negociação como Análise do Trader do Círculo Interno e
Advanced Supply Demand
Bernhard Schweigert
4.9 (314)
Atualmente com 33% de desconto! A melhor solução para qualquer Trader Novato ou especialista! Este indicador é uma ferramenta de negociação exclusiva, de alta qualidade e acessível porque incorporamos uma série de recursos proprietários e uma nova fórmula. Com esta atualização, você poderá mostrar fusos horários duplos. Você não só será capaz de mostrar um TF mais alto, mas também mostrar ambos, o TF do gráfico, MAIS o TF mais alto: MOSTRANDO ZONAS ANINHADAS. Todos os traders de Oferta e Demanda
- Real price is 80$ - 40% Discount ( It is 49$ now ) Contact me for instruction, any questions! Introduction The breakout and retest strategy is traded support and resistance levels. it involves price breaking through a previous level.  The break and retest strategy is designed to help traders do two main things, the first is to avoid false breakouts. Many false breakouts start with a candlestick that breaks out of a level but ends with an immediate candlestick that brings the price back into t
LEIA AS INFORMAÇÕES ABAIXO ANTES DE COMPRAR O PRODUTO! Apollo Pips PLUS SP é um produto único! É PARA QUEM QUER ADQUIRIR MEU NOVO INDICADOR "APOLLO PIPS" MAIS BÔNUS "SUPER PACK" COM ACESSO A TODOS OS MEUS INDICADORES DE NEGOCIAÇÃO! Ao adquirir o produto Apollo Pips PLUS SP você está na verdade adquirindo uma versão absolutamente nova do meu indicador Apollo Pips. Esta versão do indicador possui um algoritmo aprimorado e um parâmetro fácil de usar que lhe dá a oportunidade de usar o indicador em
RelicusRoad Pro
Relicus LLC
4.73 (141)
Agora US $ 147 (aumentando para US $ 499 após algumas atualizações) - Contas ilimitadas (PCs ou Macs) Manual do usuário do RelicusRoad + vídeos de treinamento + acesso ao grupo de discórdia privado + status VIP UMA NOVA FORMA DE OLHAR PARA O MERCADO O RelicusRoad é o indicador de negociação mais poderoso do mundo para forex, futuros, criptomoedas, ações e índices, oferecendo aos traders todas as informações e ferramentas necessárias para se manterem rentáveis. Fornecemos análises técnica
Descubra o segredo da negociação forex bem -sucedida com nosso indicador MT4 personalizado! Você já se perguntou como obter sucesso no mercado de Forex, obtendo lucros consistentemente e minimizando o risco? Aqui está a resposta que você está procurando! Permita -nos apresentar nosso indicador proprietário do MT4 que revolucionará sua abordagem à negociação. Versatilidade única Nosso indicador foi projetado especialmente para usuários que preferem as formações de vela Renko e Rangebar. En
Automated Trendlines
Georgios Kalomoiropoulos
5 (17)
As linhas de tendência são a ferramenta mais essencial de análise técnica na negociação forex. Infelizmente, a maioria dos traders não os desenha corretamente. O indicador Automated Trendlines é uma ferramenta profissional para traders sérios que o ajudam a visualizar o movimento de tendências dos mercados. Existem dois tipos de Trendlines Bullish Trendlines e Bearish Trendlines. Na tendência de alta, a linha de tendência Forex é desenhada através dos pontos de oscilação mais baixos do m
M1 Arrow
Oleg Rodin
4.73 (15)
Uma estratégia intradiária baseada em dois princípios fundamentais do mercado. O algoritmo é baseado na análise de volumes e ondas de preços usando filtros adicionais. O algoritmo inteligente do indicador dá um sinal apenas quando dois fatores de mercado se combinam em um. O indicador calcula ondas de um determinado intervalo no gráfico M1 usando os dados do período de tempo mais alto. E para confirmar a onda, o indicador utiliza a análise por volume. Este indicador é um sistema de negociação pr
IX Power MT4
Daniel Stein
5 (6)
O IX Power traz finalmente a precisão imbatível do FX Power para símbolos não-Forex. Determina com exatidão a intensidade das tendências a curto, médio e longo prazo nos seus índices, acções, mercadorias, ETFs e até criptomoedas favoritos. Pode analisar tudo o que o seu terminal tem para oferecer. Experimente e veja como o seu timing melhora significativamente quando negoceia. Características principais do IX Power Resultados de cálculo 100% precisos e sem repintura - para todos os símb
Italo Trend Indicator
Italo Santana Gomes
4.79 (38)
BUY INDICATOR AND GET EA FOR FREE AS A BONUS + SOME OTHER GIFTS! ITALO TREND INDICATOR  is the best trend indicator on the market, the Indicator works on all time-frames and assets, indicator built after 7 years of experience on forex and many other markets. You know many trend indicators around the internet are not complete, does not help, and it's difficult to trade, but the Italo Trend Indicator is different , the Italo Trend Indicator shows the signal to buy or sell, to confirm the signal t
Break and Retest
Mohamed Hassan
4.12 (17)
This Indicator only places quality trades when the market is really in your favor with a clear break and retest. Patience is key with this price action strategy! If you want more alert signals per day, you increase the number next to the parameter called: Support & Resistance Sensitivity.  After many months of hard work and dedication, we are extremely proud to present you our  Break and Retest price action indicator created from scratch. One of the most complex indicators that we made with ove
Trend Screener
STE S.S.COMPANY
4.82 (93)
Indicador de tendência, solução única inovadora para negociação e filtragem de tendências com todos os recursos de tendências importantes construídos dentro de uma ferramenta! É um indicador multi-timeframe e multi-moedas 100% sem repintura que pode ser usado em todos os símbolos/instrumentos: forex, commodities, criptomoedas, índices e ações. O Trend Screener é um indicador eficiente que segue a tendência do indicador que fornece sinais de tendência de seta com pontos no gráfico. Os recursos qu
ALERTA DE COMPRA E VENDA MULTICURRENCY e MULTITIMEFRAME. PARADA DE TRAILING AUTOMÁTICO E RECOMPENSA DE RISCO TAKEPROFIT! O INDICADOR VARREDURA E ANALIZA O MERCADO PARA VOCÊ NÃO TER NADA PARA FAZER! NEGOCIE TODAS AS SUAS MOEDAS EM 1 TABELA!   Após a compra deixe um comentário entre em contato comigo e eu lhe enviarei o assistente comercial EA. O indicador usa vários osciladores e filtros anexados para encontrar os melhores pontos de entrada CONFIRMADOS, então você não precisa se preocupar
TPSpro RFI Levels
Roman Podpora
4.83 (24)
Reversal First Impulse levels (RFI)    INSTRUCTIONS        RUS       -       ENG              R ecommended to use with an indicator   -   TPSpro  TREND PRO -  Version MT5 A key element in trading is zones or levels from which decisions to buy or sell a trading instrument are made. Despite attempts by major players to conceal their presence in the market, they inevitably leave traces. Our task was to learn how to identify these traces and interpret them correctly. Main functions: Displaying activ
Mais do autor
Market Steps MT4
Mahdi Ebrahimzadeh
5 (1)
O Indicador Market Steps foi projetado e construído baseado nas correlações de Preço/Tempo de Gann, e otimizado por regras específicas de Price Action do Mercado Forex. Ele usa o conceito de fluxo de ordens de mercado para prever as zonas de preços potenciais que terão um alto volume de ordens. Os níveis apresentados pelo Indicador podem ser usados para negociação, e/ou também para filtro de sinais de outras estratégias ou indicadores. Todo Trader precisa desta poderosa ferramenta para ter ao
Indicador convertido de outra plataforma que foi codificada por LuxAlgo. Adicionei o tipo diferente de média móvel e também a variedade de dados de origem. Na versão original, a média móvel é SMA e a fonte de dados do mercado é recolhida apenas a partir do fecho das velas.  Nesta versão pode selecionar muitos tipos de médias móveis e também dados de origem como alto/baixo/HL2/HLC/HLC2/... . aqui estão alguns detalhes do desenvolvedor original: O indicador Range Detetor tem como objetivo
Indicator is converted from another programming language code by programmer " sbtnc ". MQL version is simplified to be more useful by less settings complexity.  There is some clues from programmer about indicator: The indicator tracks and reports the percentage of occurrence of daily tops and bottoms by the time of the day.  At certain times during the trading day, the market reverses and marks the high or low of the day. Tops and bottoms are vital when entering a trade, as they will decide if y
FREE
Este código foi originalmente publicado pela LuxAlgo a partir de outra linguagem de programação.  Tem capacidades aceitáveis de previsão de tendências que podem ser usadas para muitos fins comerciais: Este indicador baseia-se nas suavizacoes de Nadaraya-Watson postadas anteriormente. Aqui criamos um indicador de envelope baseado no Kernel Smoothing com alertas integrados de cruzamentos entre o preço e as extremidades do envelope. Ao contrário do estimador Nadaraya-Watson, este indicador seg
MACD Bands
Mahdi Ebrahimzadeh
O produto é convertido de outra plataforma e originalmente criado por TradeMaster Lite. O indicador usa basicamente o conceito MACD, mas reforça suas habilidades por diferentes tipos de técnicas de média. É poderoso para identificar tendências e reversões.  Aqui estão alguns detalhes do proprietário original: Apresentamos um indicador MACD personalizavel, com as seguintes caracteristicas: Multi-timeframe Bandas de desvio para detetar volatilidade invulgar 9 tipos de médias móveis Coloração
Market Steps MT5
Mahdi Ebrahimzadeh
O Indicador Market Steps foi projetado e construído baseado nas correlações de Preço/Tempo de Gann, e otimizado por regras específicas de Price Action do Mercado Forex. Ele usa o conceito de fluxo de ordens de mercado para prever as zonas de preços potenciais que terão um alto volume de ordens. Os níveis apresentados pelo Indicador podem ser usados para negociação, e/ou também para filtro de sinais de outras estratégias ou indicadores. Todo Trader precisa desta poderosa ferramenta para ter ao
Filtro:
Sem comentários
Responder ao comentário