Black horse indicator MT5
- Indicadores
- Shengzu Zhong
- Versão: 1.22
- Atualizado: 2 junho 2024
- Ativações: 10
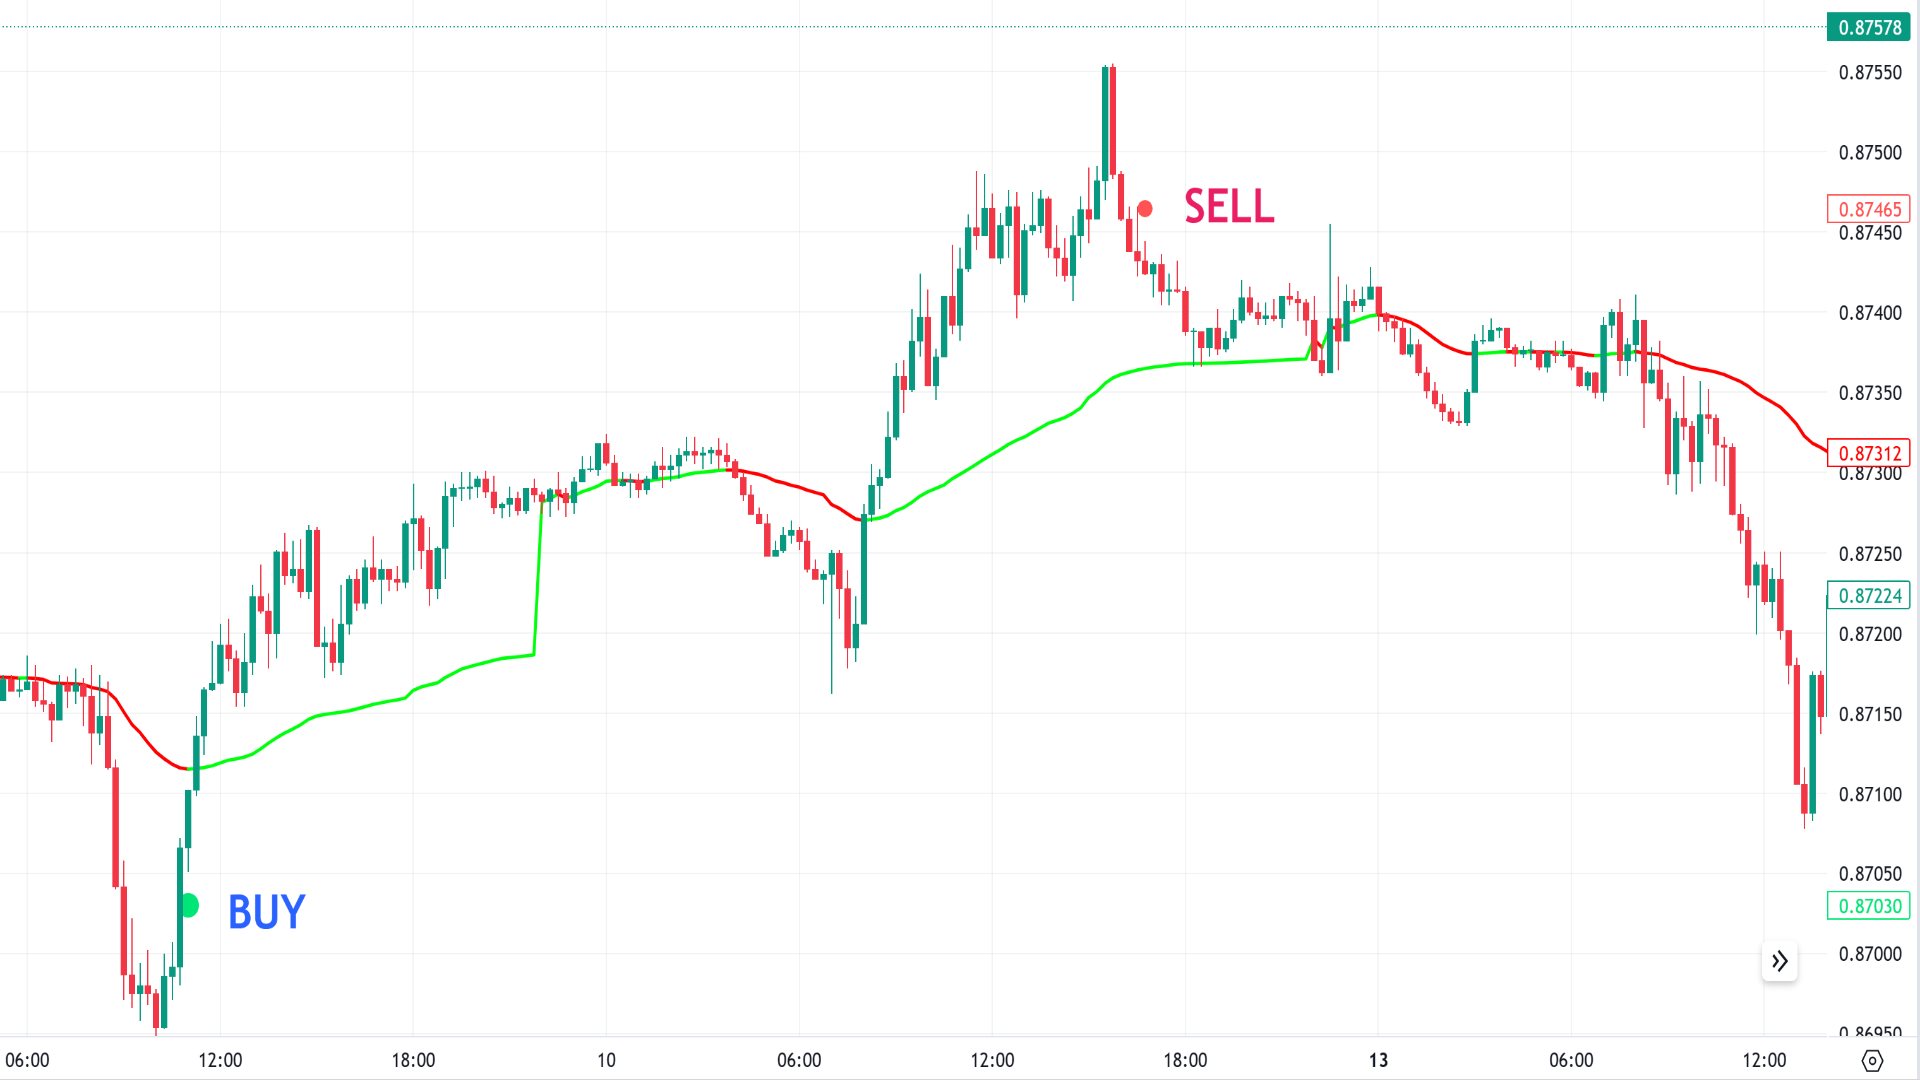
O objetivo do indicador "Black Horse" é identificar divergências entre a ação do preço e o indicador VWAP. Ele utiliza filtros para filtrar possíveis divergências falsas e sinalizar alertas precisos e de alta qualidade.
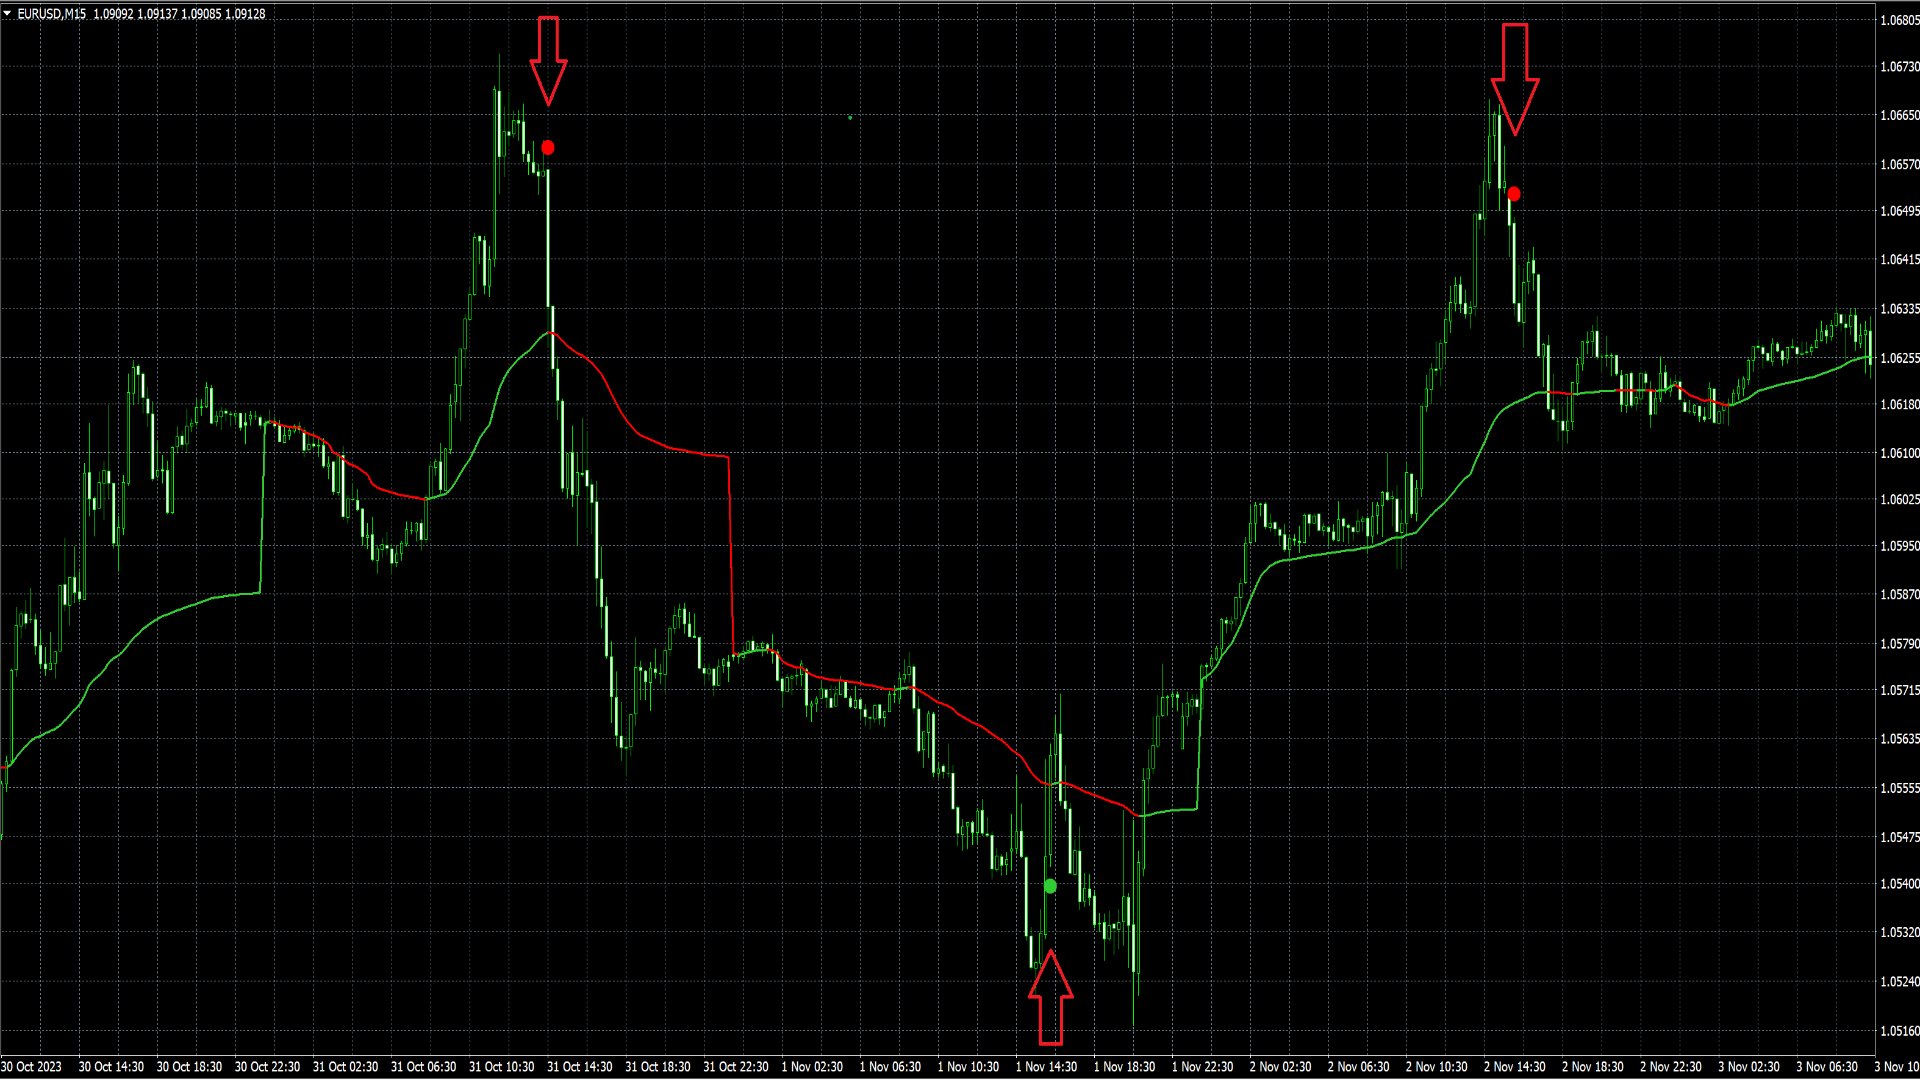
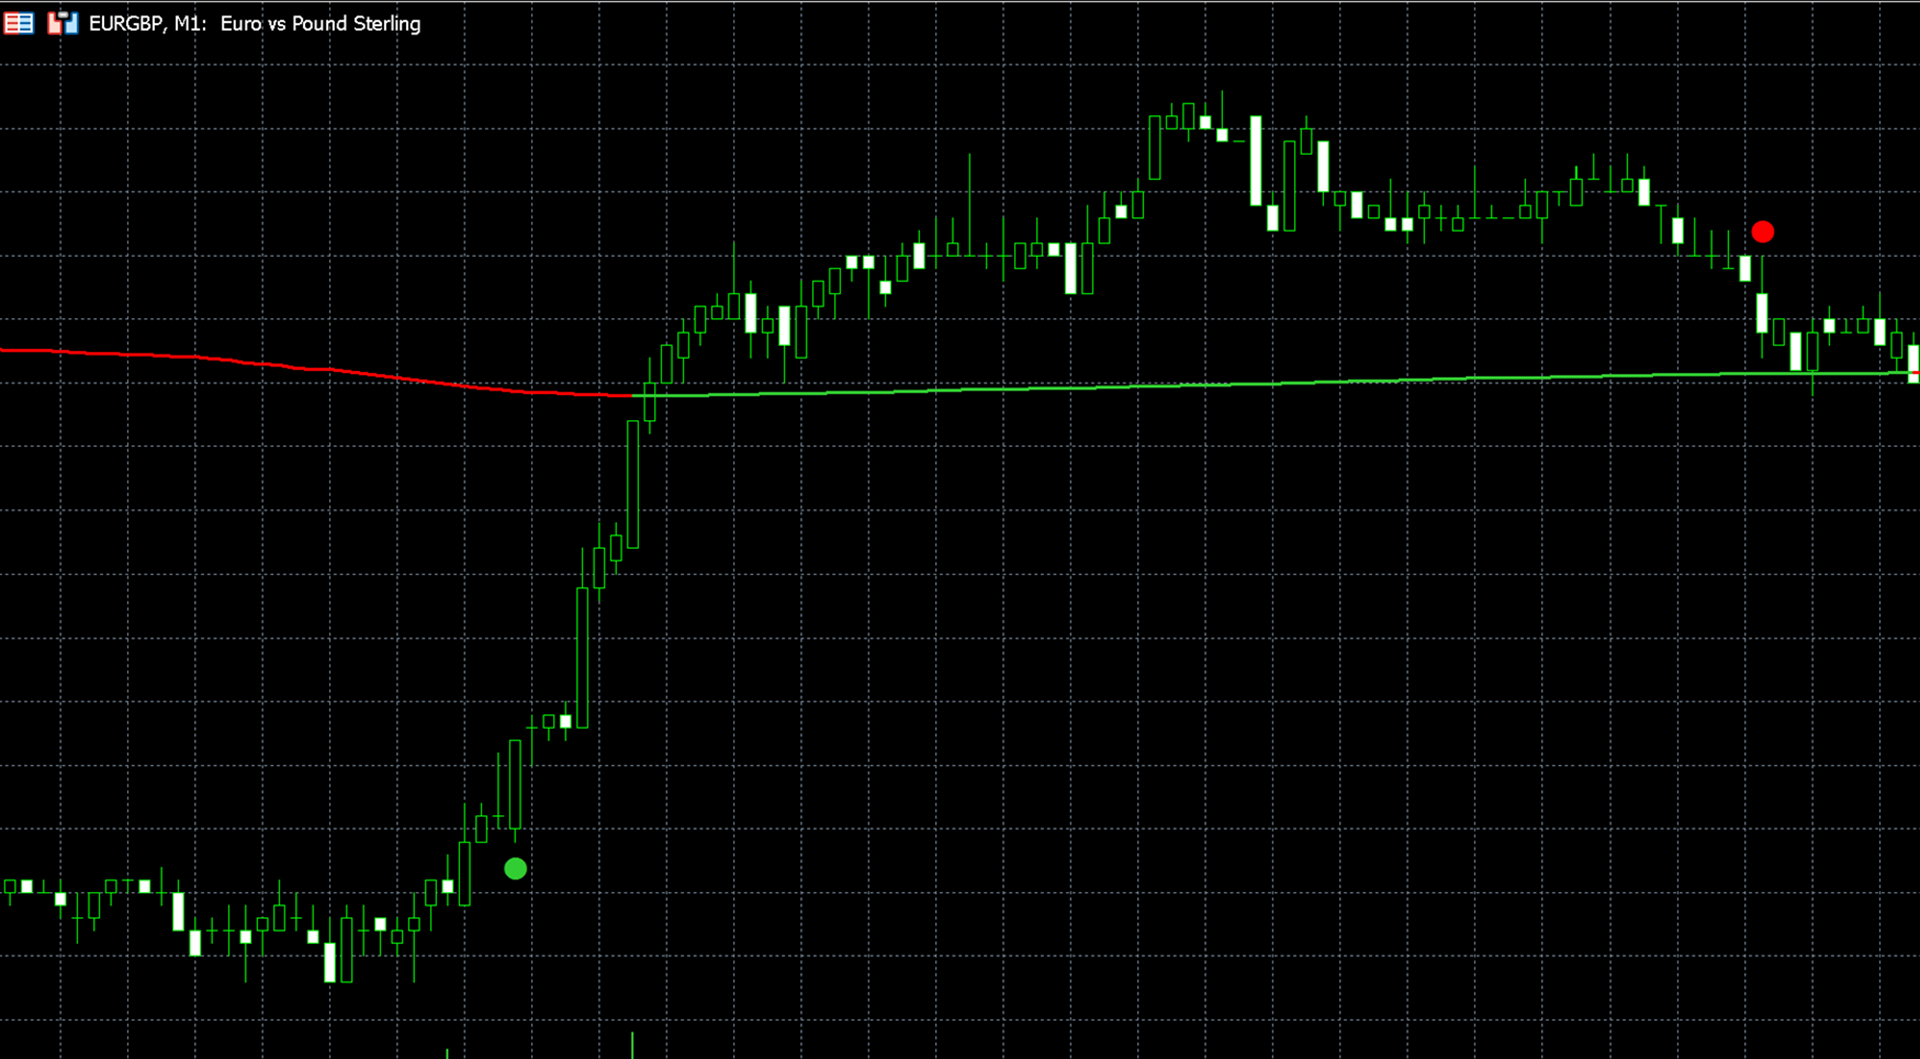
As divergências de baixa são indicadas por pontos vermelhos acima da vela, enquanto as divergências de alta são representadas por pontos verdes abaixo da vela.
O principal filtro de divergências gira em torno do ATR (Intervalo Verdadeiro Médio) e do movimento do preço nas velas anteriores dentro do período de revisão. Divergências são identificadas quando o movimento do preço durante o período de revisão é suficientemente acentuado, ultrapassando o multiplicador ATR multiplicado pelo ATR.
Devido às características do cálculo, é aconselhável definir valores mais baixos para o multiplicador ATR e o período de revisão ao lidar com prazos mais longos. Em prazos mais longos, onde os movimentos de preço tendem a ser mais suavizados, como no gráfico de 15 minutos, as flutuações acentuadas de preço ocorrem com menos frequência e geralmente são contidas em menos velas em comparação com prazos mais curtos. Ações com menor volatilidade, como HSBC, também devem utilizar multiplicadores ATR mais baixos e períodos de revisão mais curtos.
Na seção de "Configurações Visuais", você tem a opção de modificar a cor da linha VWAP, exibir cores alternadas para o VWAP, ajustar o tamanho dos sinais de divergência e mostrar ou ocultar a linha VWAP.