Big Signals
- Indicadores
- Michael Musin
- Versão: 1.0
- Ativações: 10
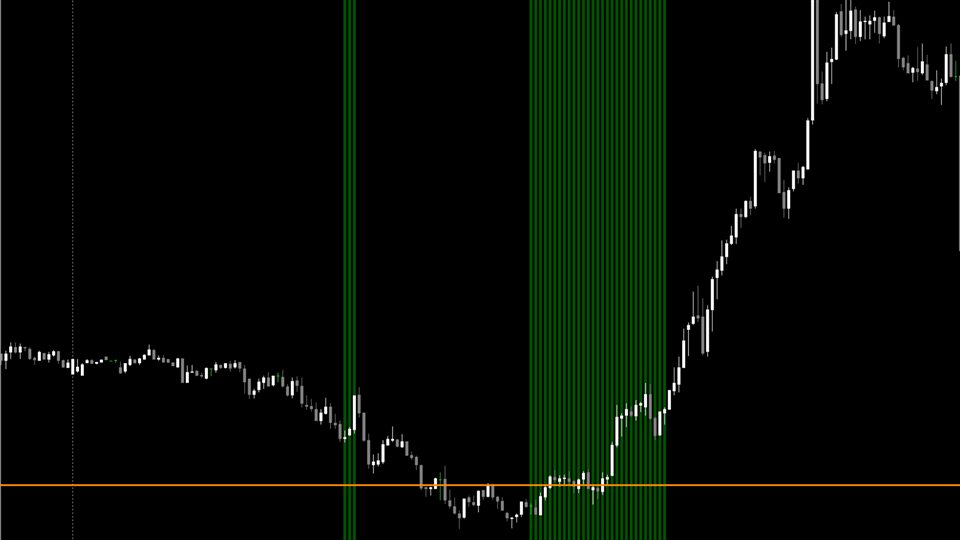
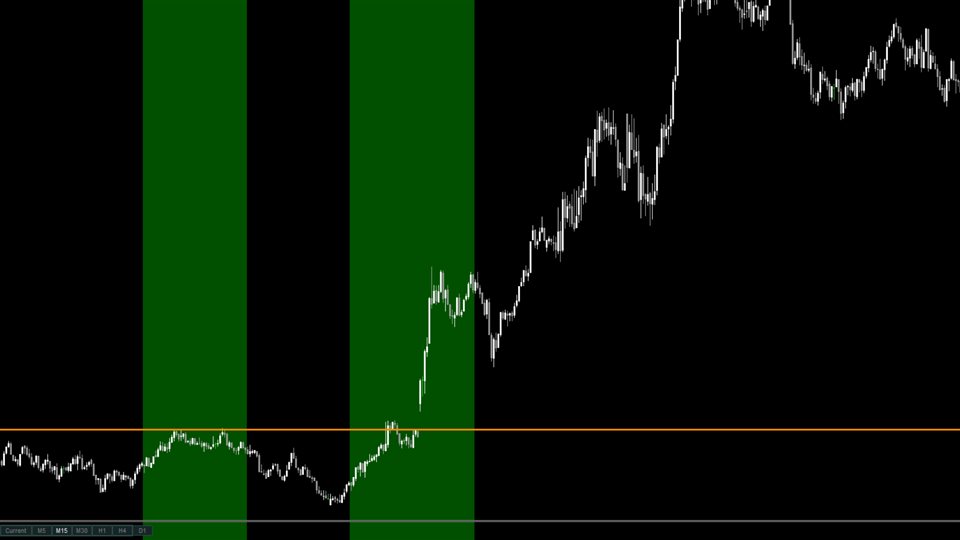
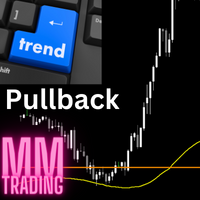
This is a multi-timeframe indicator that collects data from multiple time frames. It tries to identify the trend and predict a pullback.
You have to understand that trends emerge suddenly and with that the pullback turns into a new trend.
This is not a holy grail, always remember your stoploss.
Use this indicator as a complement to your existing strategy.
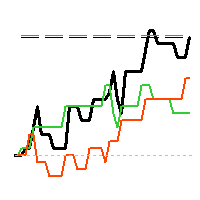
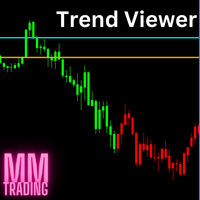
The lines that are displayed on the chart can be changed so that they are only displayed in the indicator window and are therefore not distracting. Logically, red lines are intended for short and green lines for long orientation.
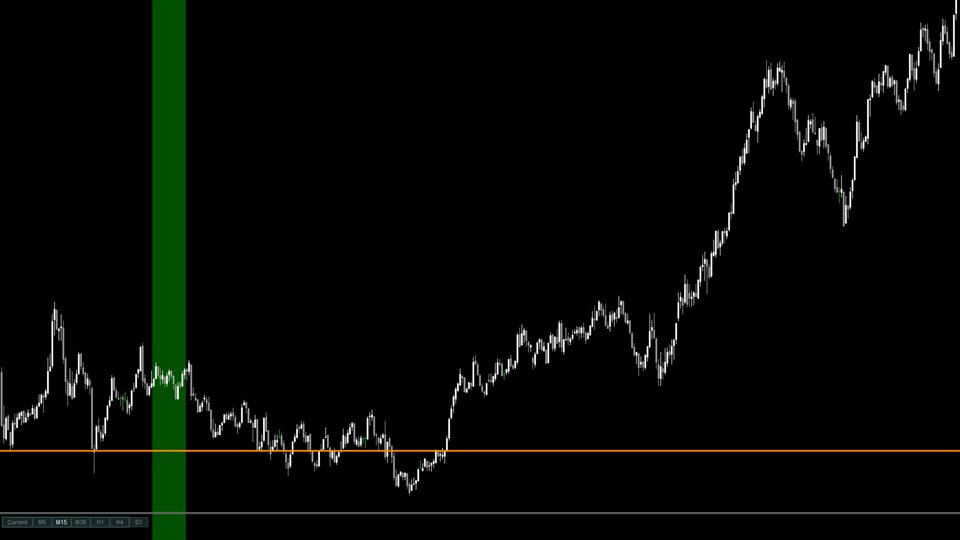
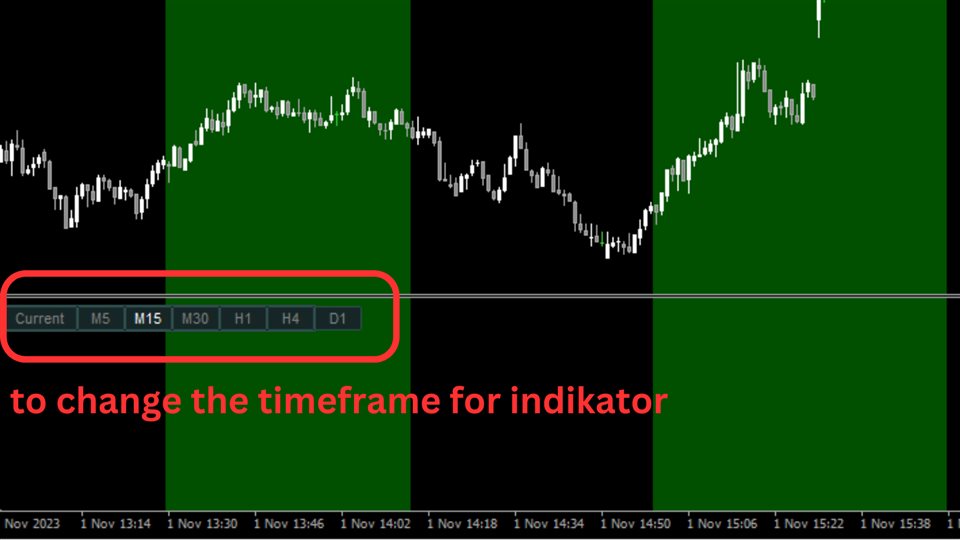
You can use a timeframe in the chart and get the indicator from a higher timeframe. You can do this by switching the buttons below. I recommend going at least 3 timeframes higher than the chart. Test it out and find the best setting for you. Use additional indicators to increase the hit rate.
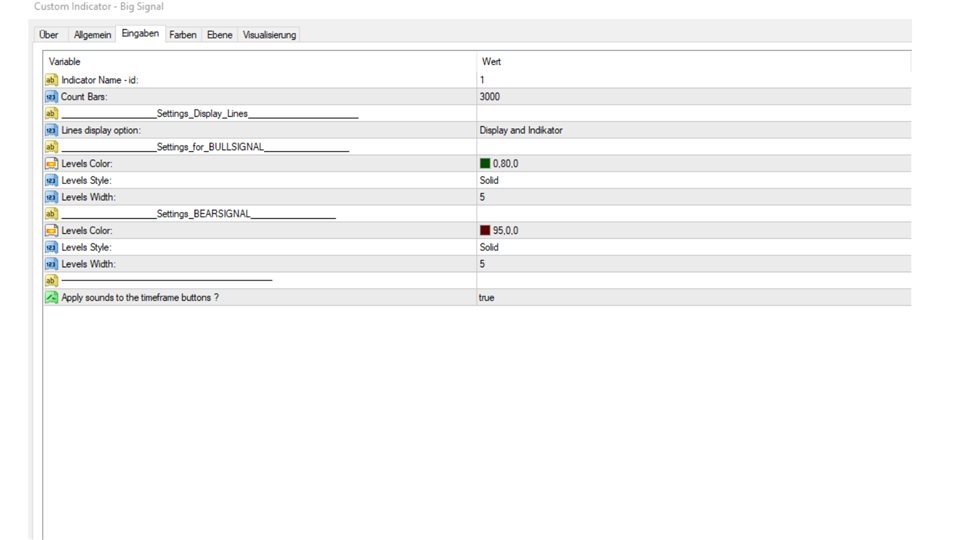
In Settings you can:
- Determine the number of candles to load (less is better for performance)
- Toggle the displayed lines, between chart and indicator window or both
- set the color, style and width
