Quarterly Cycles mt4
- Indicadores
- Barend Paul Stander
- Versão: 1.2
- Atualizado: 27 novembro 2023
- Ativações: 5
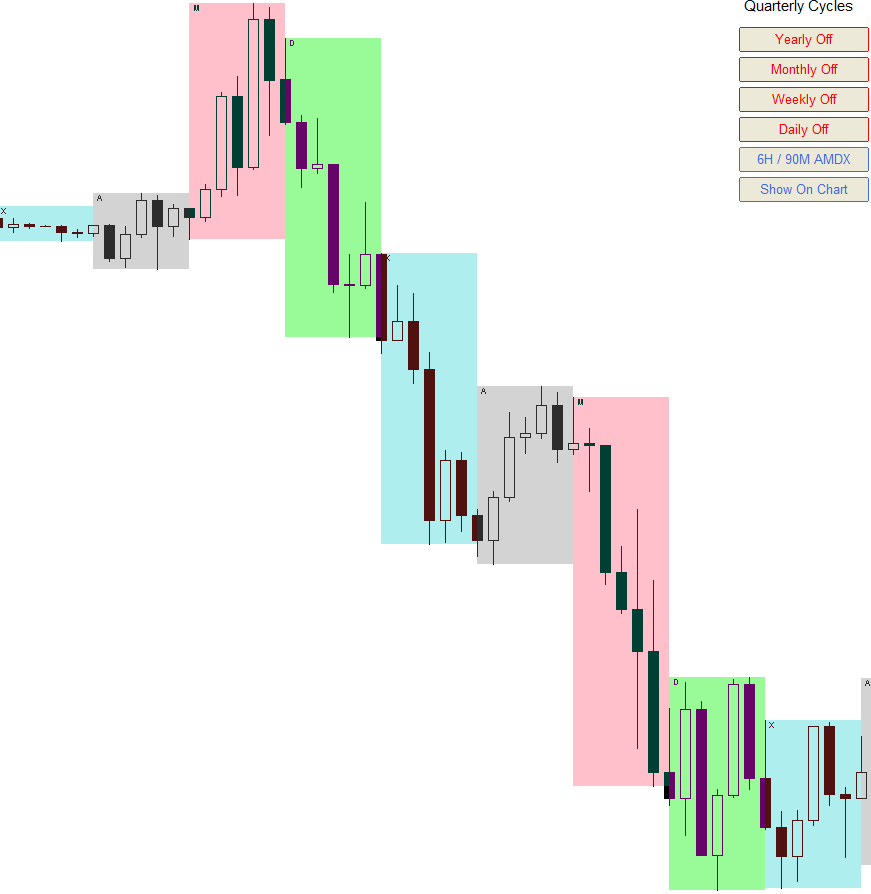
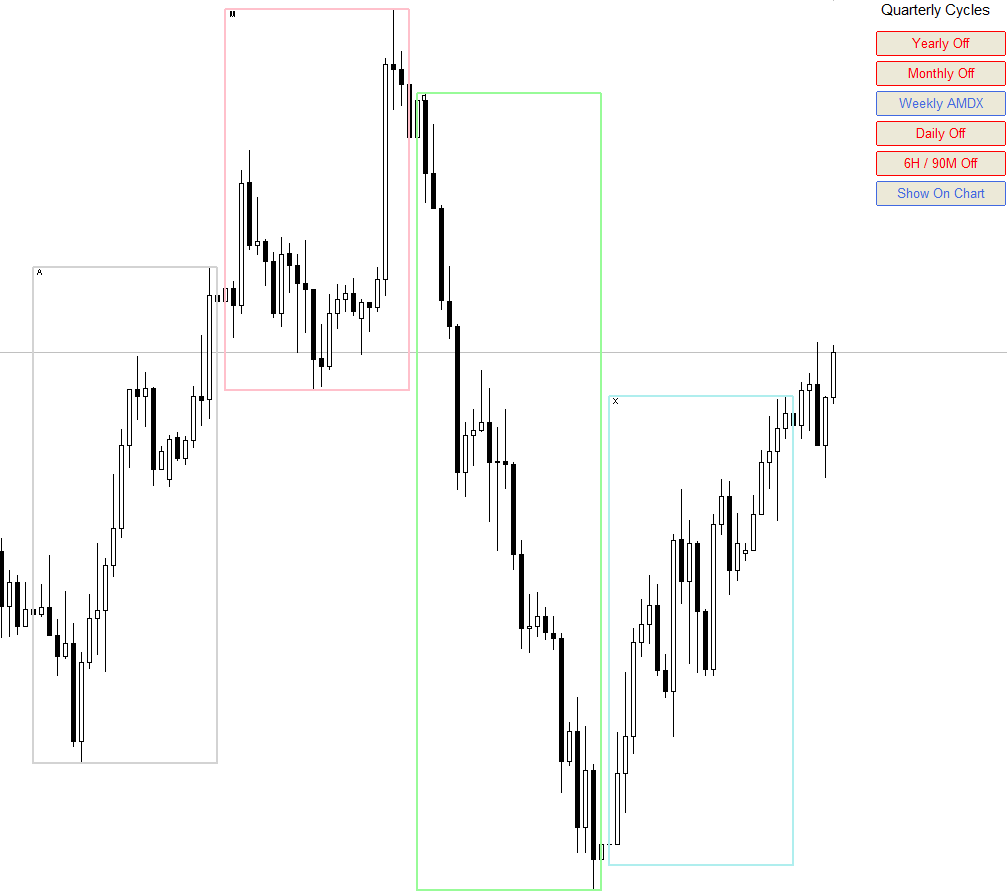
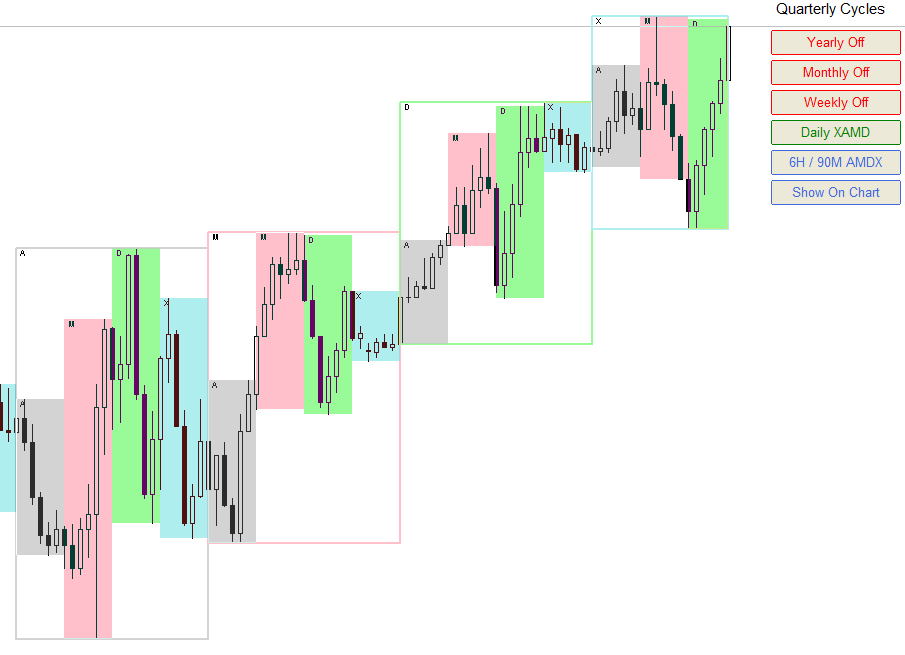
Quarterly Cycles
Quarterly Cycles is based on the Quarterly Theory developed by Daye ( traderdaye on X )
This is an aid to the user to find Cycles and it is NOT automatic detected, user can select AMDX or XAMD in each Cycle and it will be visually draw on the chart.
Quarterly Cycles: Yearly, Monthly, Weekly, Daily, 6 Hour (90 minutes)
Yearly Cycle:
The year is divided in four sections of three months each
- Q1 - January, February, March
- Q2 - April, May, June
- Q3 - July, August, September
- Q4 - October, November, December
Monthly Cycle:
The month is divided in four sections of 1 week each. the cycle starts on the first month’s Monday
- Q1 - Week 1, start at first Monday of the month
- Q2 - Week 2, second Monday of the month
- Q3 - Week 3, third Monday of the month
- Q4 - Week 4, fourth Monday of the month
Weekly Cycle:
The week is divided in four sections of 1 day each. (ignore Friday, and / or he small portion of Sunday)
- Q1 - Monday
- Q2 - Tuesday
- Q3 - Wednesday
- Q4 - Thursday
Daily Cycle:
The day is divided in four sections of 6 Hours each.
- Q1 - 18:00 - 00:00, Asian Session
- Q2 - 00:00 - 06:00, London Session
- Q3 - 06:00 - 12:00, NY Session
- Q4 - 12:00 - 18:00, PM Session
6H Cycle ( 90 Minute Cycle ) :
The 6 Hour sessions is divided in four sections of 90 minute each.
Very informative and intelligent