EA Bollinger Bands
- Experts
- Zafar Iqbal Sheraslam
- Versão: 1.0
- Ativações: 10
The EA (Expert Advisor) Distance of Bollinger Bands is a trading strategy or algorithm used in financial markets, particularly in Forex trading. Bollinger Bands are a technical analysis tool that consists of a middle band (usually a simple moving average) and two outer bands (standard deviations of the middle band). The EA Distance of Bollinger Bands strategy focuses on measuring the distance between the price and the Bollinger Bands to make trading decisions.
Here's how the EA Distance of Bollinger Bands strategy typically works:
-
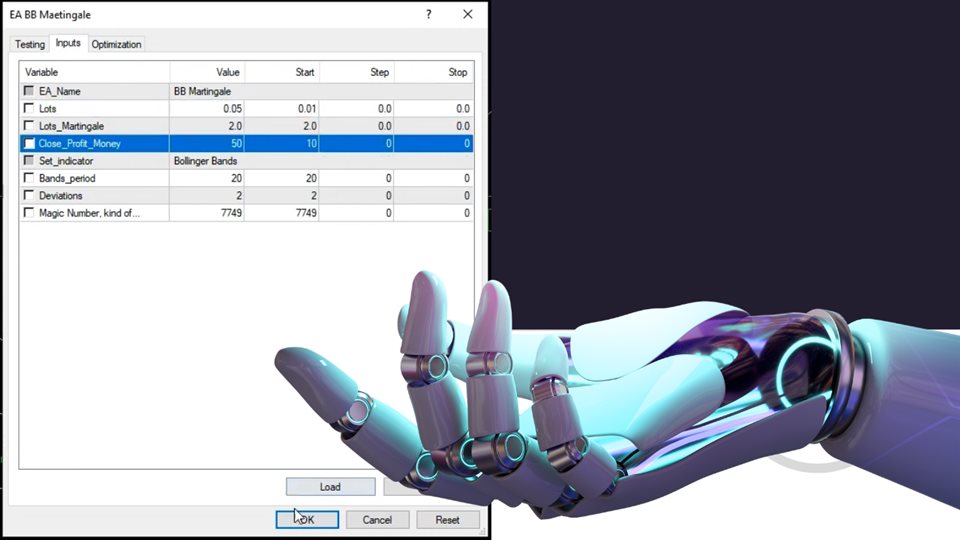
Calculation of Bollinger Bands: The first step involves calculating the Bollinger Bands for a specific time period (e.g., 20 periods). This includes calculating the middle band (usually a 20-period simple moving average) and the upper and lower bands (usually set to two standard deviations above and below the middle band).
-
Measuring Distance: The EA then measures the distance between the current market price and the upper or lower Bollinger Band. This distance is typically expressed as a percentage or a multiple of the standard deviation.
-
Entry Signals: Traders using this strategy may enter a trade when the price reaches a certain distance from the Bollinger Bands. For example, they might buy when the price touches or crosses the lower Bollinger Band if they believe the market is oversold. Conversely, they might sell when the price touches or crosses the upper Bollinger Band if they think the market is overbought.
-
Exit Signals: Traders may also use the distance from the Bollinger Bands as an exit signal. For instance, they might exit a long trade when the price reaches a certain distance above the middle band, indicating overbought conditions, or they might exit a short trade when the price reaches a certain distance below the middle band, indicating oversold conditions.
-
Risk Management: Risk management is essential in any trading strategy. Traders using the EA Distance of Bollinger Bands should define stop-loss and take-profit levels to manage their risk.
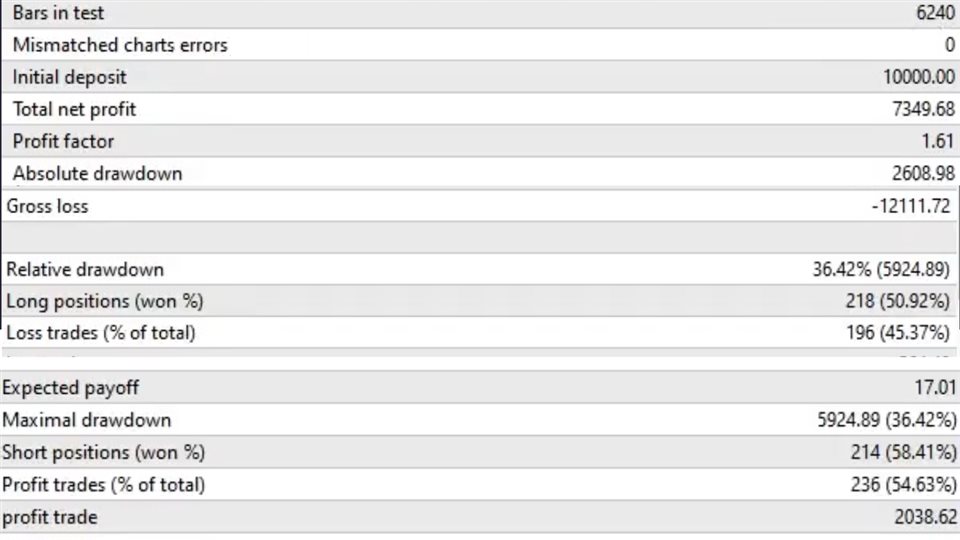
It's important to note that the effectiveness of this strategy depends on various factors, including market conditions, the choice of time frame, and the specific parameters used for Bollinger Bands (e.g., the number of periods and the number of standard deviations). Traders often backtest and optimize the strategy to find the parameters that work best for their trading style and the assets they are trading. Additionally, like all trading strategies, it carries risks, and traders should exercise caution and implement proper risk management techniques.


