Binary Options Premium V8
- Indicadores
- Md Meraz Mahmud
- Versão: 1.0
- Ativações: 7
Hello My Dear Friend,
im introduce about Binary Option Premium V8
it work, all currency pair
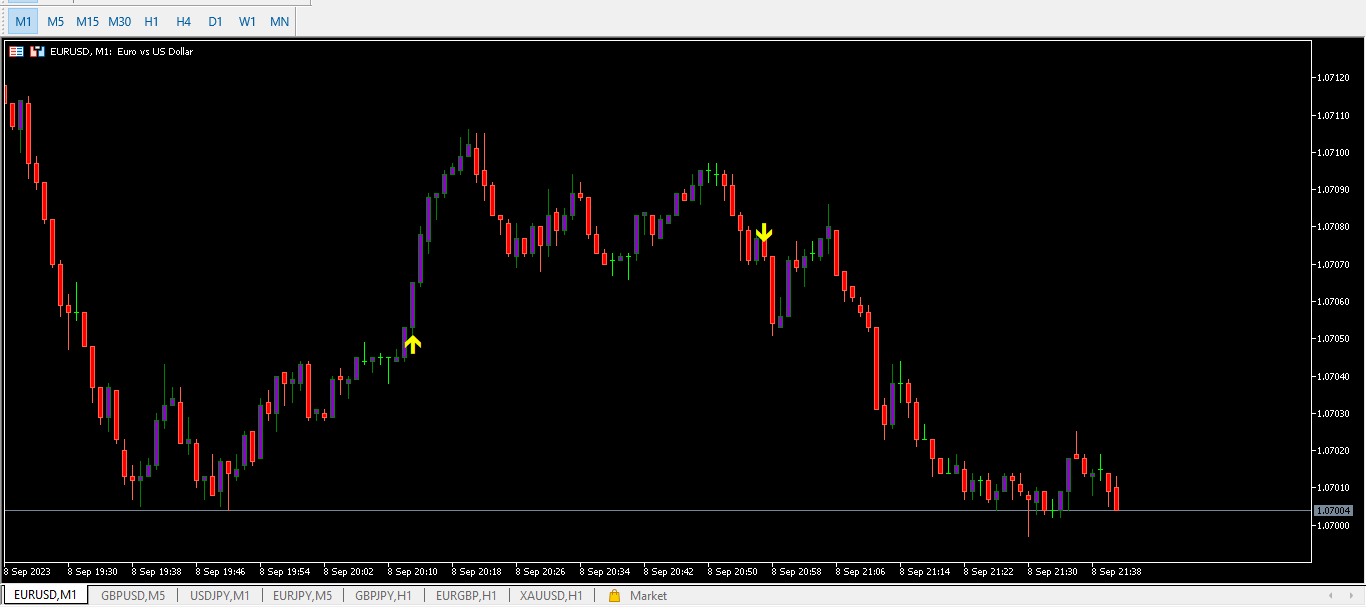
1 minute time frame,
1-5 minute expire
100% non repaint,
no delay signal
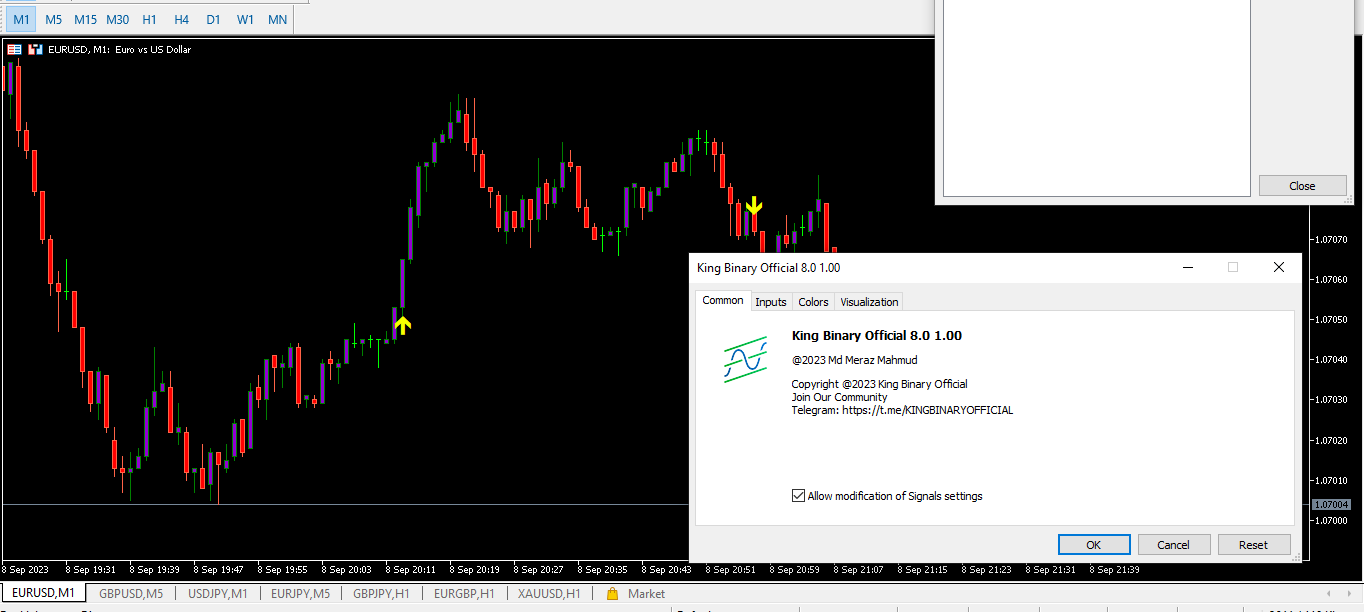
Alright. This indicator works on MT5 and is very easy to use. When you receive a signal from it, you wait for that candle with the signal to close and you enter your trade at the beginning of the next new candle. A red arrow means sell and a green arrow means buy. for easy identification of trade signal. Are you okay with that?
We release new updates of the indicator every month and the updates are for free once you bought the indicator first time. This indicator was designed from pure price action strategy that I have been using for the past 4 years and it is 80 to 85 % accurate
im introduce about Binary Option Premium V8
it work, all currency pair
1 minute time frame,
1-5 minute expire
100% non repaint,
no delay signal
Alright. This indicator works on MT5 and is very easy to use. When you receive a signal from it, you wait for that candle with the signal to close and you enter your trade at the beginning of the next new candle. A red arrow means sell and a green arrow means buy. for easy identification of trade signal. Are you okay with that?
We release new updates of the indicator every month and the updates are for free once you bought the indicator first time. This indicator was designed from pure price action strategy that I have been using for the past 4 years and it is 80 to 85 % accurate