• Visão global
  • Comentários
  • Discussão (1)
  • O que há de novo

Easy Trend System MT4

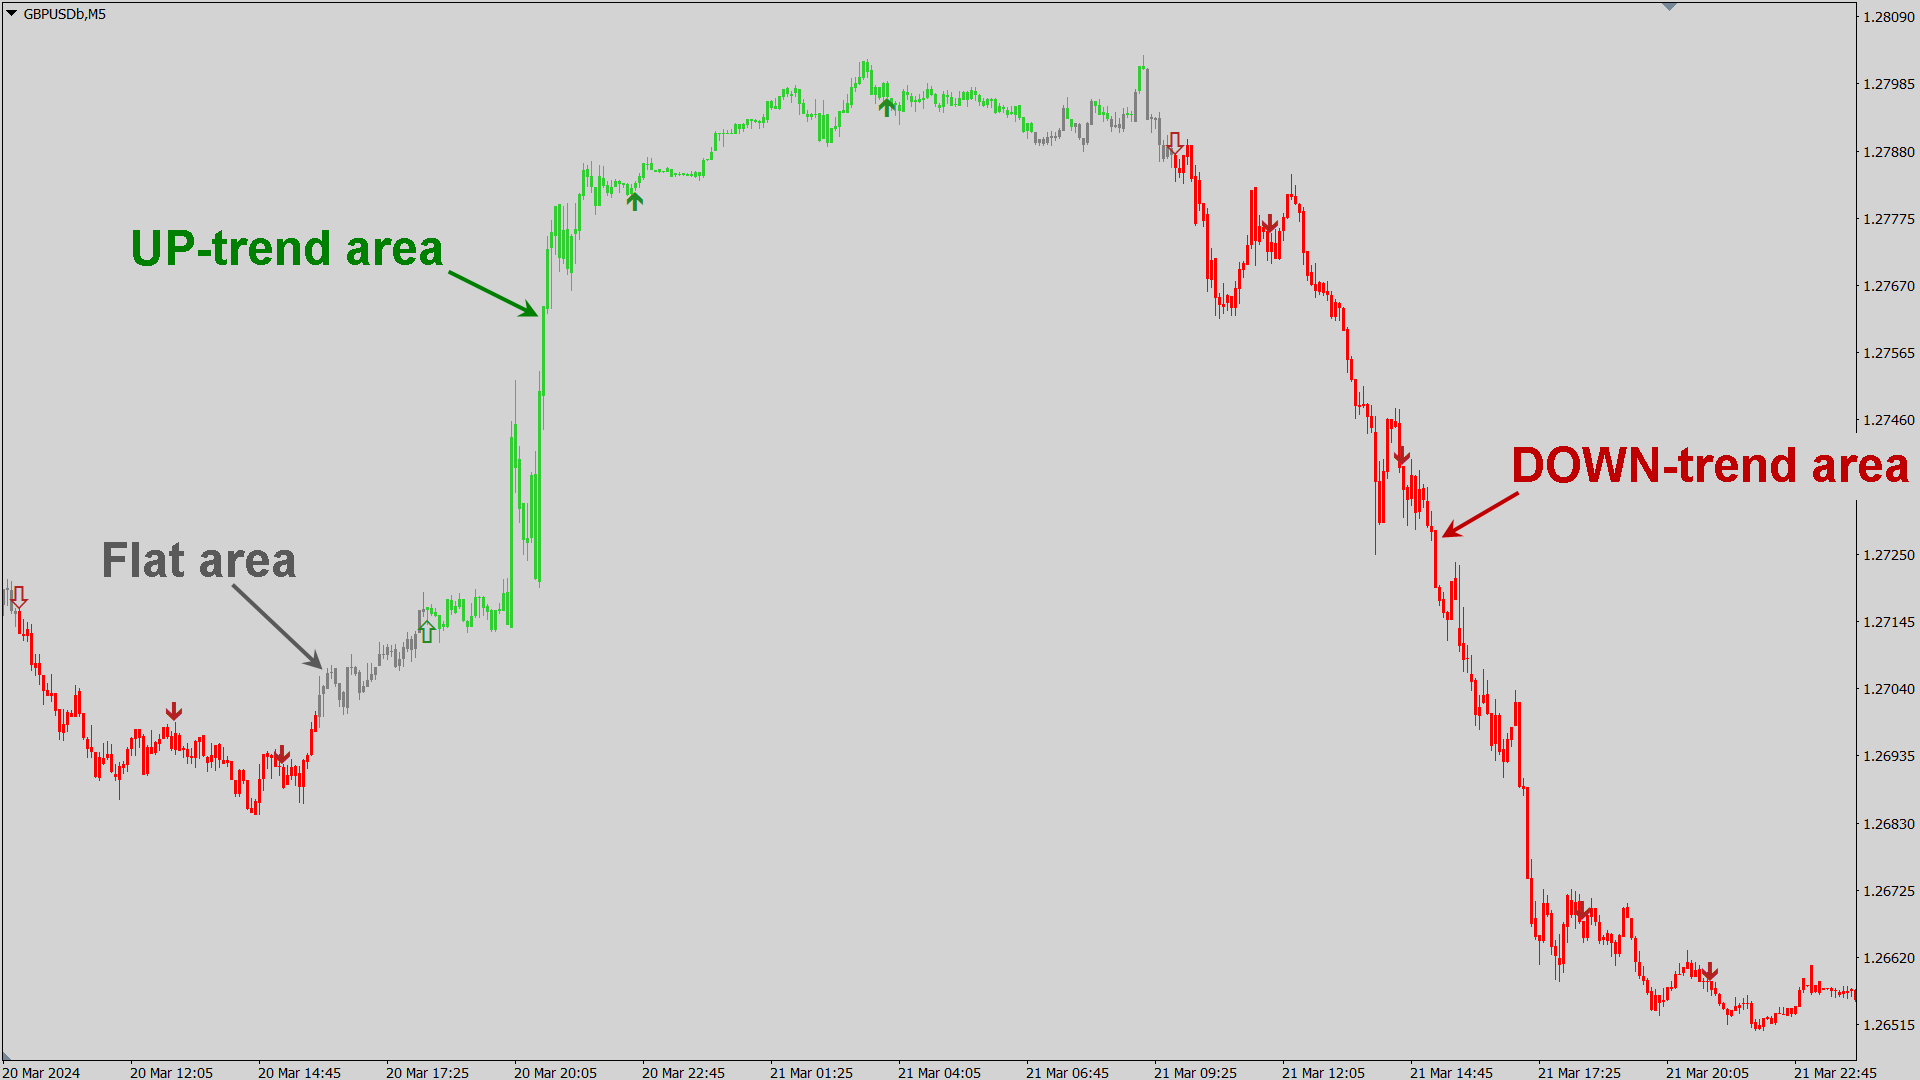
The indicator determines the state of the market (trend or flat) using the upgraded Bollinger Bands of higher timeframes and colors the bars in trend/flat colors.

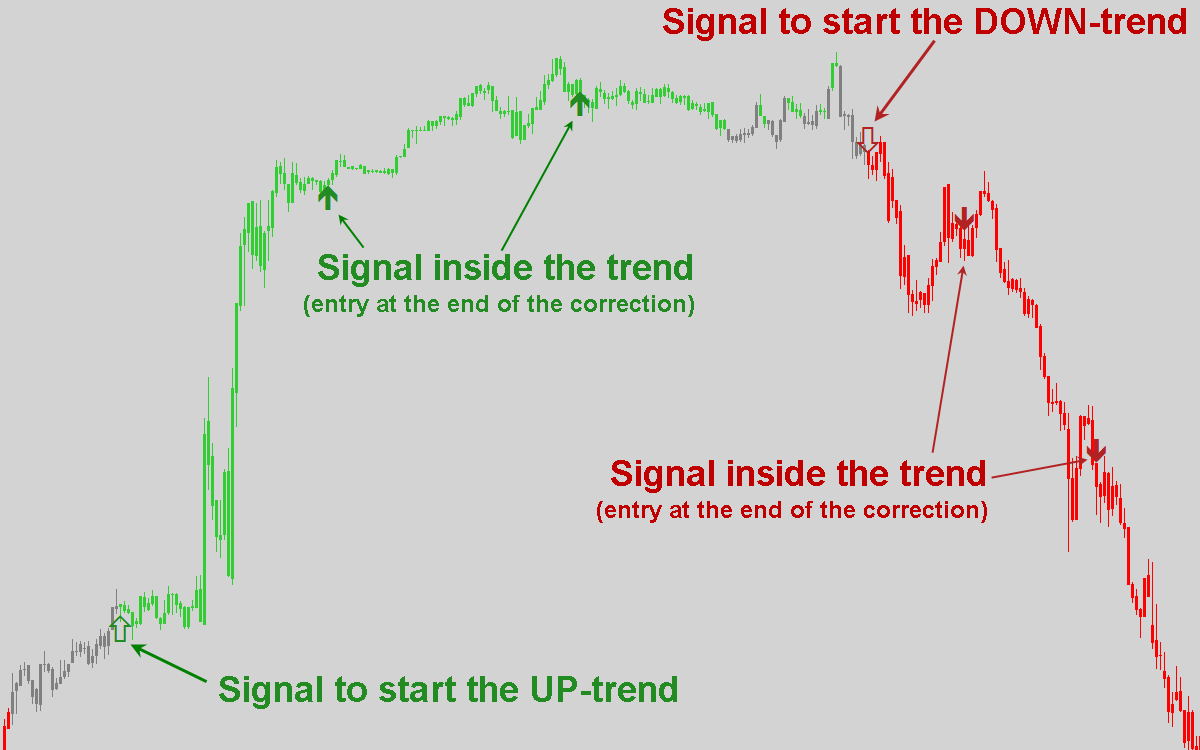
The indicator also gives signals (arrow on the chart + Sound and notification to Mail, Push):

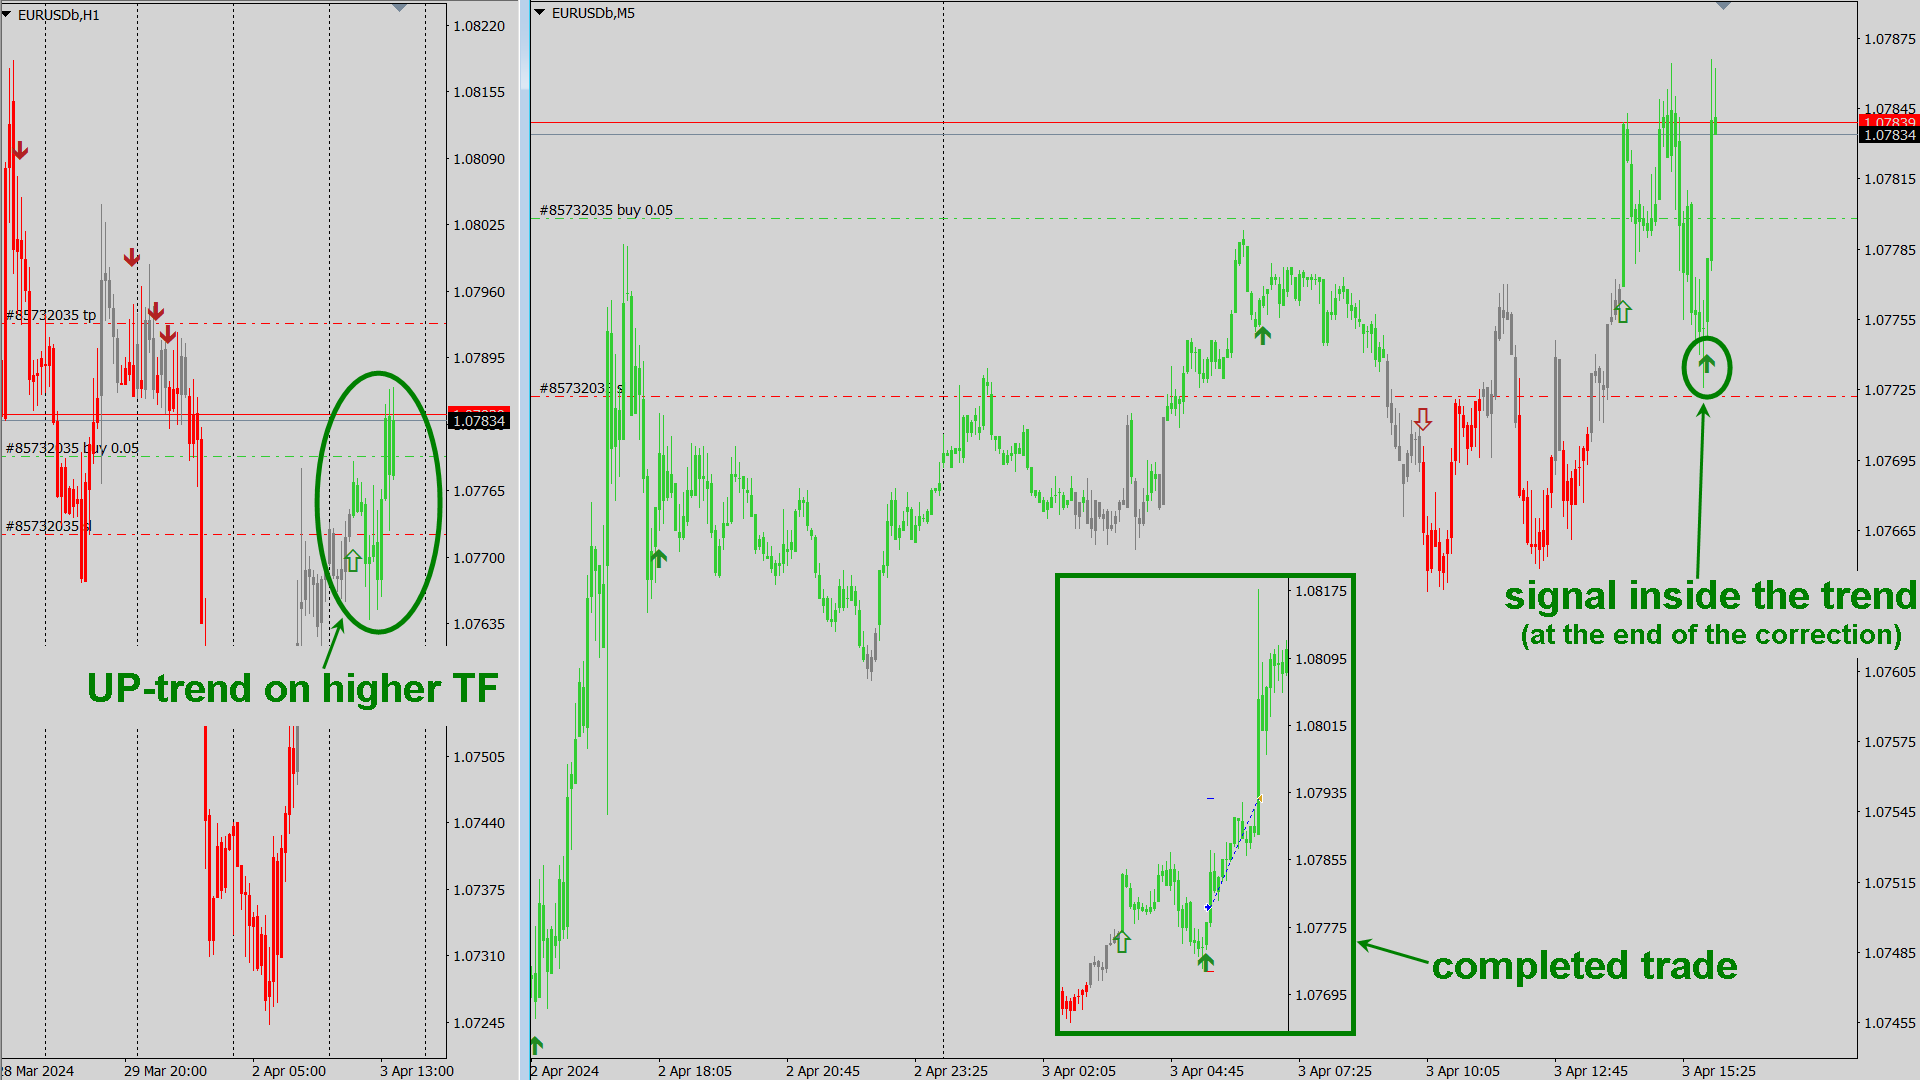
  • signal at the beginning of every new trend;
  • signal inside the trend (entry at the end of the correction)

Signals are never redrawn!


How to use the indicator?

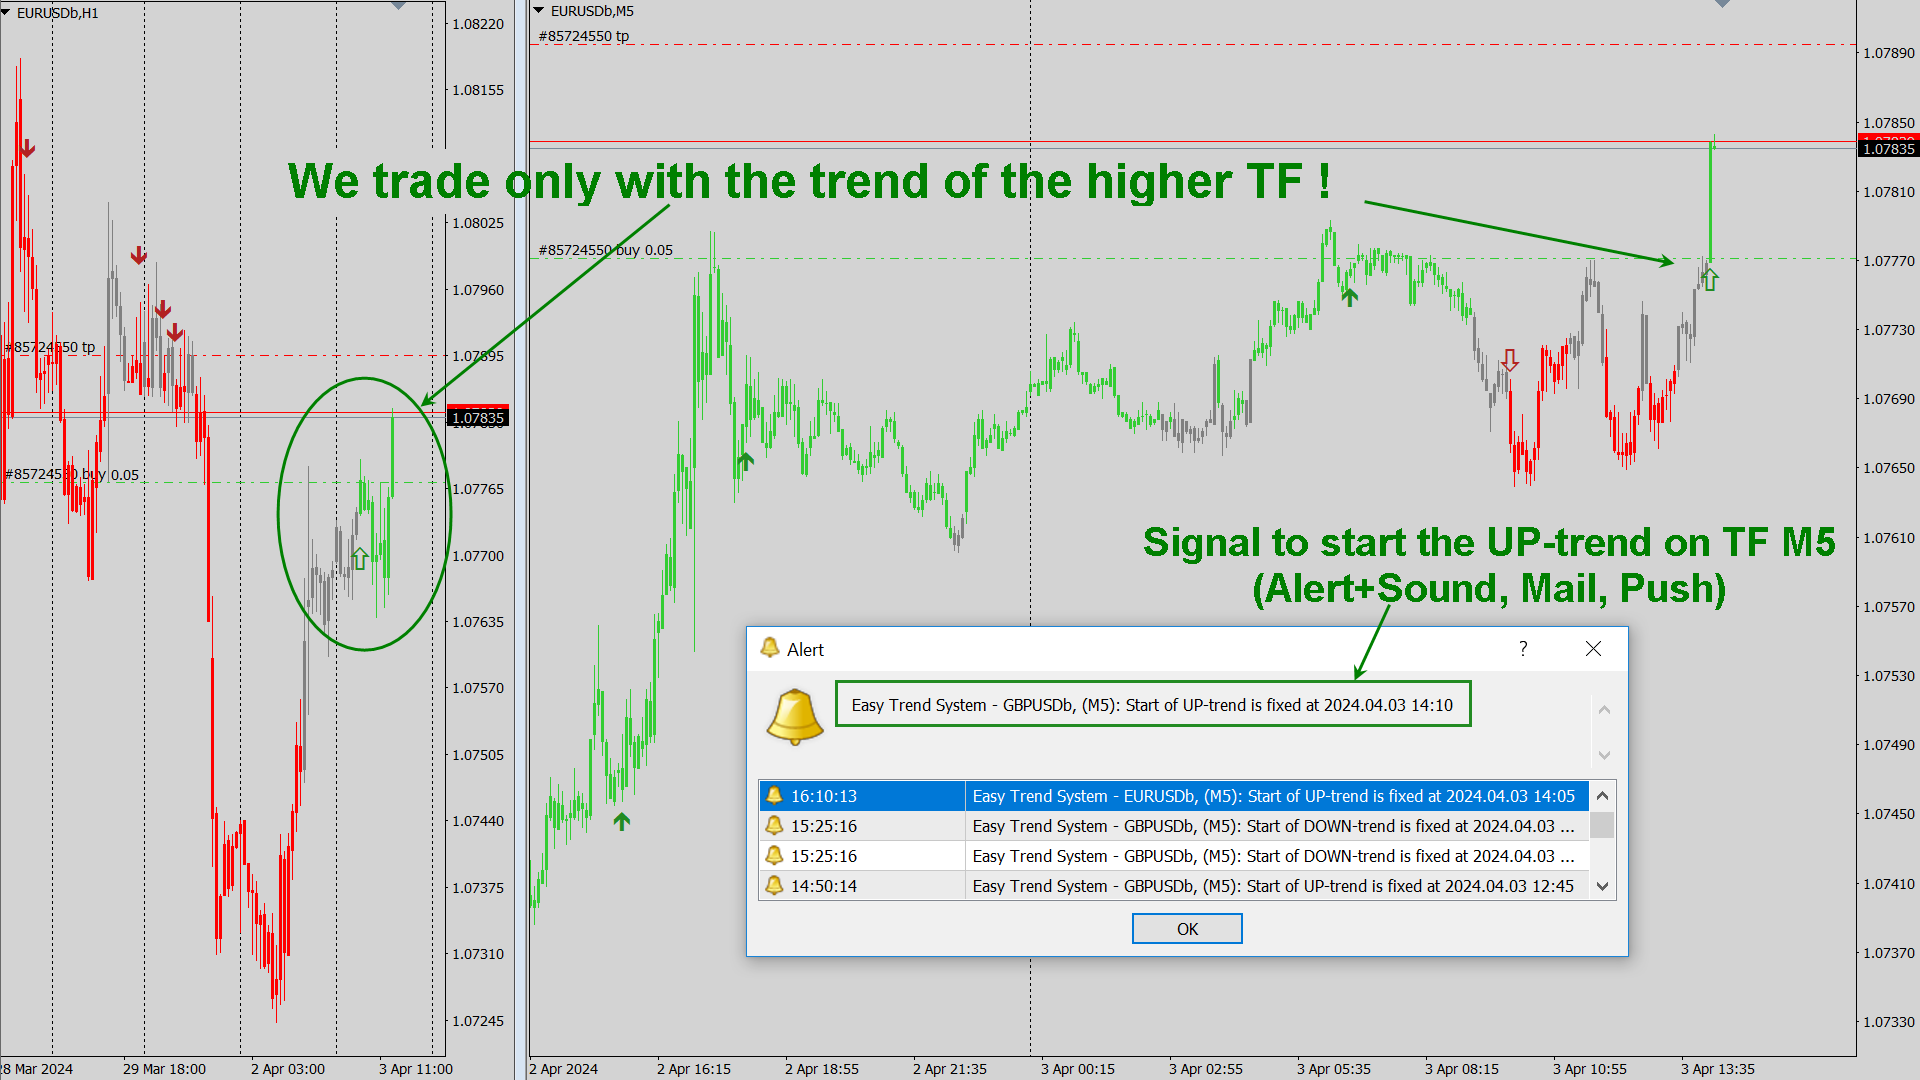
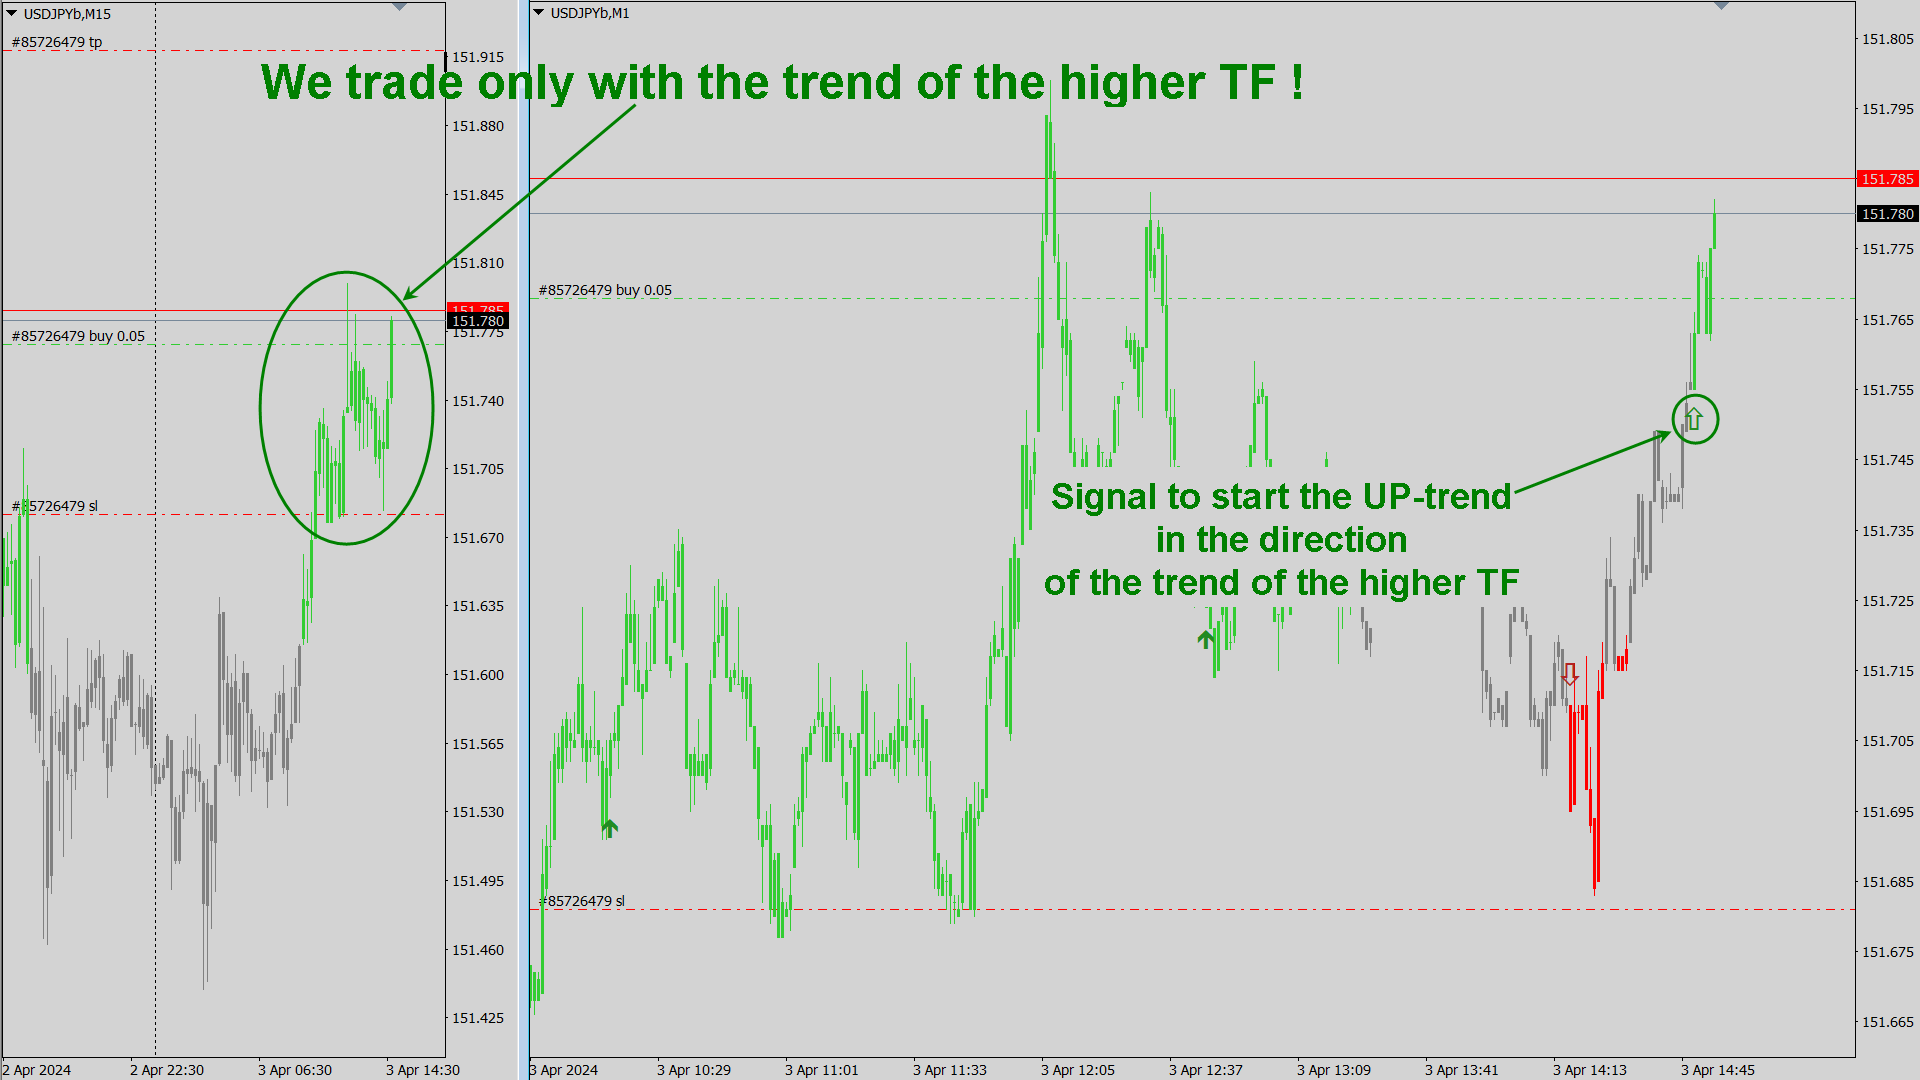
The indicator works very well intraday. When using the indicator for intraday (TF M1-M15) trading, it is strongly recommended to open trades only in the direction of the trend on the higher TF.

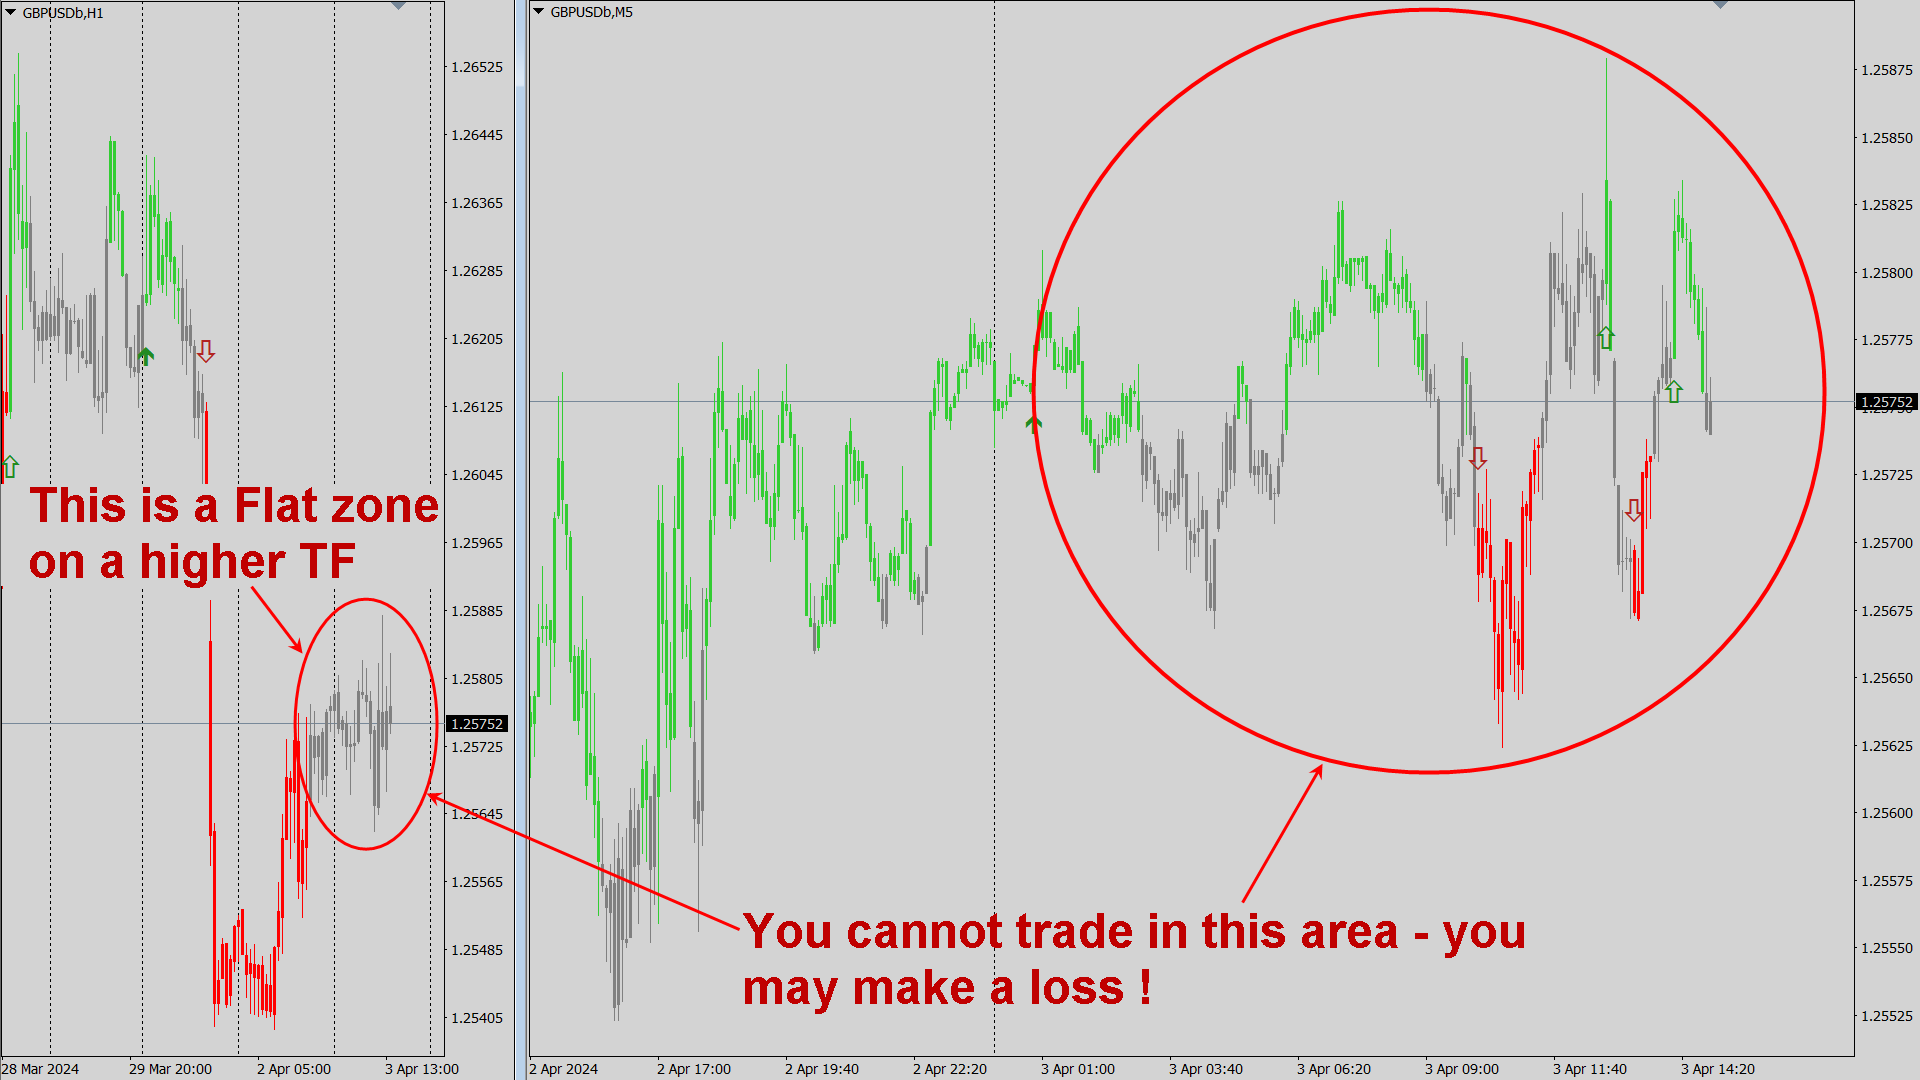
If you trade intraday, do not open trades against the trend of the higher TF or if the indicator on the higher TF shows a flat!

The recommended ratio of higher and working timeframes:

Working TF Higher TF
M1
M15
M5
H1
 M15 H4
 M30-MN1 Higher TF not used


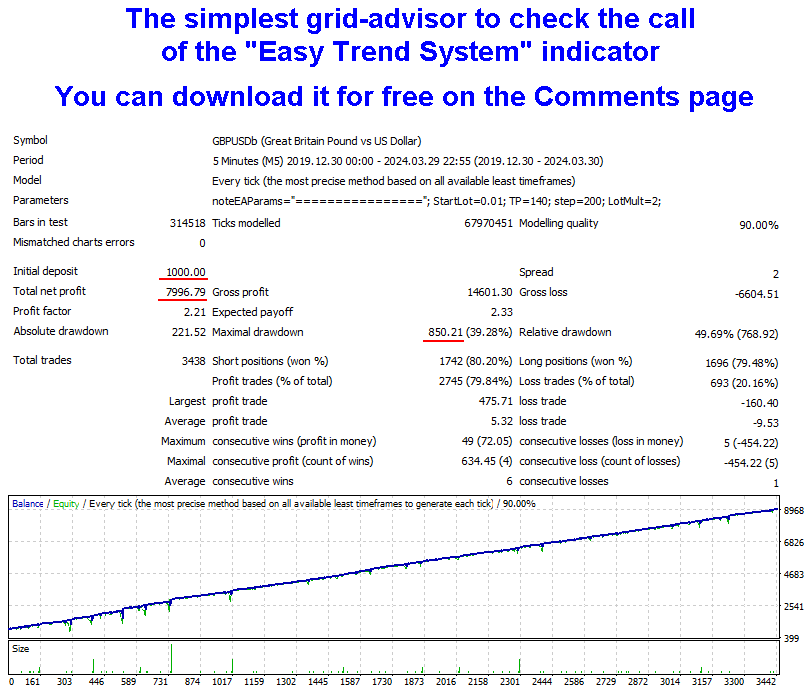
The indicator is optimized for use in advisors and can provide excellent entry points for your robot (you can download a simple grid advisor with an example of using the indicator on the Comments page).


Indicator parameters

  • Number of bars to calculate (=0 -all bars) – number of bars to calculate the indicator (=0 - all chart bars will be calculated)
  • Allow signal on the 0th (unclosed) bar - enable a signal on the current (unclosed) bar. This signal may be canceled until the bar is closed!

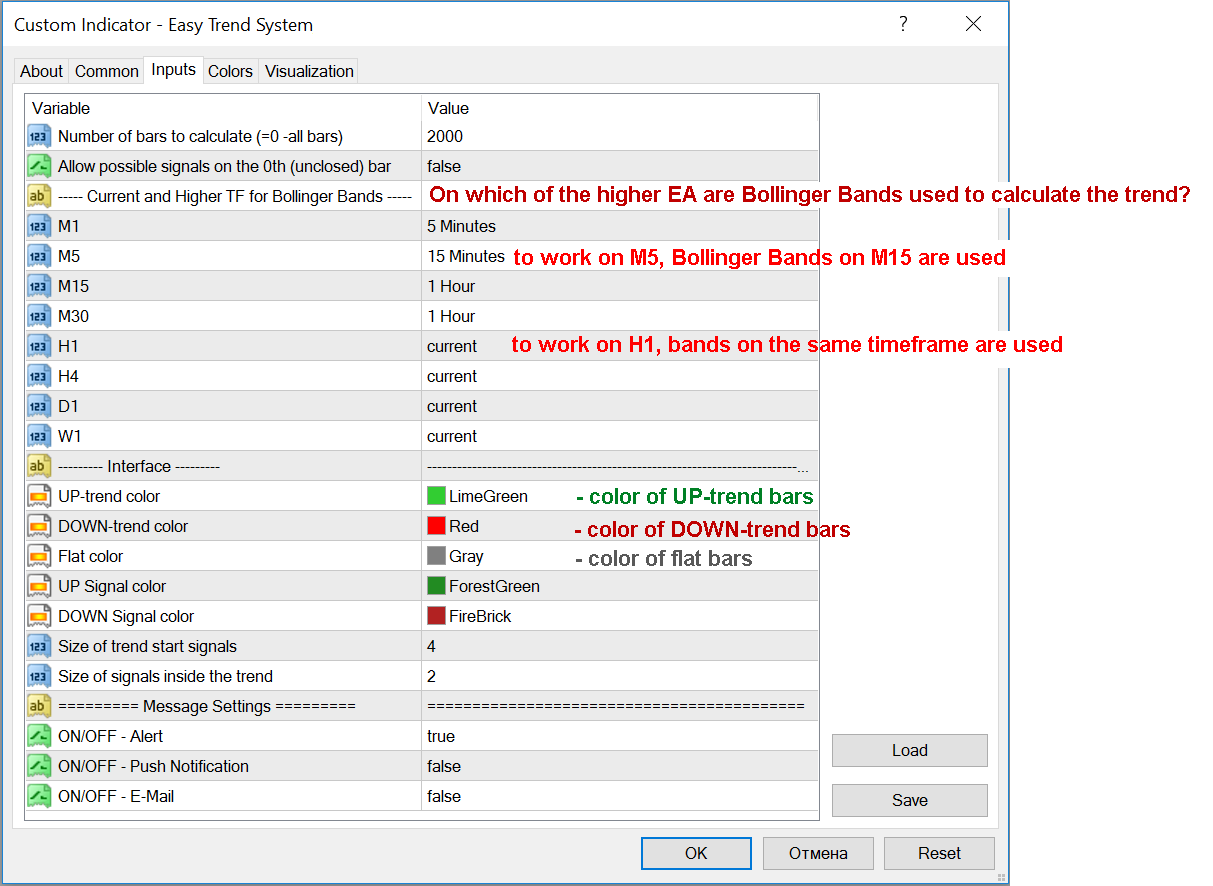
The "Current and Higher timeframes" block - determines from which of the higher timeframes Bollinger Bands will be used to calculate the trend/flat,
For example:
to work on M5, Bollinger Bands on M15 are used
to work on H1, Bollinger bands of the current TF (i.e. H1) are used

  • UP-trend color – color of UP-trend bars
  • DOWN-trend color - color of DOWN-trend bars
  • Flat color - color of Flat bars
  • UP-trend Signal color - color of Buy-signal arrows
  • DOWN-trend Signal color - color of Sell-signal arrows
  • Size of trend start signals - size of arrows of the trend start
  • Size of signals inside the trend - size of arrows inside the trend (after correction)

Block of notifications:

  • ON/OFF - Alert – enable/disable sound messages in the terminal when signals occur
  • ON/OFF - E-Mail - enable/disable sending messages by email
  • ON/OFF - Push Notification - enable/disable sending push messages to mobile devices
Produtos recomendados
TIbors Timer
Tibor Hartmut Sturm
Indikator zur klaren Anzeige im Metatrader Dieser Indikator wurde von mir Entwickelt damit die Anzeige der relevanten Parameter klar und deutlich im Chart auf einen Blick zu sehen ist.  Er dient zur Information und ist ohne Gewähr.  Folgende Parameter werden angezeigt: -   Der  Aktuelle Kurs - Das Aktuelle Handelspaar - Die Restzeit zur nächsten Kerzenbildung / Zum Abschluss der Aktuellen Kerze - Die Kontonummer des Handelskontos - Die Frei Verfügbare Margin - Die Margin auf 1 Lot - Der Akt
FREE
Special Trend Oscillator is an indicator designed to detect trend change points and measure the power of the current trend. This indicator is a different model of the MACD indicator. The indicator has two channels. The blue channel is the upper line of the upward trend. The red channel line is the underscore of the downward trend. Buy when the trend line reaches the red line. Sell when the trend line reaches the blue line. Our Popular Products Super Oscillator HC Cross Signal Super Cross Trend S
Wise Men Indicator demo
Bohdan Kasyanenko
3 (2)
The indicator displays signals according to the strategy of Bill Williams on the chart. Demo version of the indicator has the same features as the paid, except that it can work only on a demo account . Signal "First Wise Man" is formed when there is a divergent bar with angulation.  Bullish divergent bar - with lower minimum and closing price in the upper half. Bearish divergent bar - higher maximum and the closing price at the bottom half. Angulation is formed when all three lines of Alligat
FREE
This classic "old school" MAGIC MACD indicator gives you the cross of the parameters you set. Standart setting is (12,26,9) . The arrows give you a possible change of trend. Be careful and do not use this indicator as a single signal source. FREE version  Please feel free to check out our other REX indicator series. We do have other free indicators.     "OLD BUT GOLD"
FREE
User friendly indicator.  This indicator will help you catch the trend an fast as possible. Indicator developed based on moving averages. User can select which type of moving averages they want to use. Indicator draws an arrow when the moving average crosses. The moving average cross over arrow can be filtered with RSI, OsMA, and Parabolic Sar. There are options for selecting specific criteria for the filters.  Such as period of Rsi and Rsi levels. OsMA and Parabolic Sar criteria can also be sel
"Scalping and dethatching" é um indicador forex de sinal para scalping, que mostra visualmente a direção da tendência atual no gráfico. Este indicador permite determinar a direção da tendência atual com uma precisão de até 90% em 3 segundos após ser adicionado ao gráfico. A universalidade do indicador reside no fato de que ele funciona em todos os pares de moedas. Todos os pares de moedas estão sujeitos às mesmas leis fundamentais do mercado, portanto, o indicador "Scalping and dethatching" fun
The Crossing
Anton Iudakov
5 (2)
+ 2 bonus strategies! Alerts! I recommend watching my advisor -   Night Zen EA The indicator combines the most popular moving average strategies: Simple moving average crossover. Moving average crossover relative to the position of the slower moving average. 2 bonus strategies : The crossing of the fast moving average with the calculation of the opening prices of the slow moving average with the calculation of the closing prices taking into account the slower moving average. (The settings for th
FREE
Power Trend Free
Yurij Kozhevnikov
5 (2)
Power Trend Free - the indicator shows the trend strength in the selected period. Input Parameters The indicator has three input parameters: Period - a positive number greater than one, it shows the number of candlesticks used for calculations. If you enter one or zero, there will be no error, but the indicator will not be drawn. Applied Price - the standard "Apply to:" set meaning data used for the indicator calculation: Close - Close prices; Open - Open prices; High - High prices; Low - Low
FREE
Gorilla Channel VZ é um indicador de canal, finalizado com base em muitos anos de observações. O indicador de negociação de Sinais pode ser usado como um indicador que exibe um canal de tendência e como uma das fontes de sinais de entrada, sujeito a filtragem adicional. Com a abordagem adequada, pelo menos 80% de transações bem-sucedidas. Principais características do Gorilla Channel VZ:  Funções analíticas Pode ser usado em qualquer par de moedas e timeframe; O indicador não é redesenhad
FREE
Geo Fractals
Georgij Komarov
5 (1)
This is professional fractals indicator able to work "on several screens" while on a single chart. The product has been developed for scalpers and those relying on "accurate" entries. The indicator shows fractals from six timeframes and displays the distance between the price and a new emerging fractal on lower timeframes showing the price behavior more clearly and making its analysis more accurate on reversal points. The indicator displays fractals from the D1, H4, H1, M15, M5 and M1 timeframes
This indicator is based on Guppy's GMMA Strategy. And shows arrows when GMMA lines cross up or down. To have this indicator and get alerts for Multiple Timeframes and multiple Pairs you can check out the demo of this GMMA Trend Scanner indicator: https://www.mql5.com/en/market/product/38747 About GMMA In Brief: GMMA attempts to identify trends by combining two groups of moving averages with differing time periods: The long-term EMAs (30, 35, 40, 45, 50, and 60) the behaviors of investors that
FREE
MTF Heiken Ashi MA is a multiple timeframe Heiken Ashi & Moving Average indicator. Fully customizable for advanced & unique Heiken Ashi & Moving Average calculations. Key Features Modified appearance and appeal from the traditional using only H eiken Ashi MA bodies. MTF Higher or lower timeframes available making this it great for trends and scalping. There are many settings that can be non-repaint for signals at a new bar and at bar 0. Inputs Timeframe  = PERIOD_CURRENT - timeframe of Movin
FREE
Color Macd Tf
Syarif Nur Arief
MACD is well known indicator that still can be use for prediction where price will go next few minutes, hours or even weekly  With colored bar of Macd, your eyes can easily catch when color is changed based what market price movement to find any early trend on market. here is the parameter of the indicator: TF_MACD , default is 1 Hour , this mean you can see clearly MACD of 1 Hour TimeFrame on Lower TimeFrame. InpPrice , default is Price Close , this is original MACD parameter from Metaquotes st
FREE
Extremum by trend
Anton Iudakov
5 (1)
Looking for entry points along the local trend without repaint! Arrows indicate entry points. Based on classic indicators. The indicator is easy to use. Settings Наименование Описание Frequency factor Signal frequency. The less, the more often. This affects the quality. Recommendations Recommended for use on major currency pairs. Timeframe from m5, m15, m30 Subscribe to my telegram channel, where we discuss intraday trading, ideas, indicators, etc., a link in my profile contacts.
FREE
Tipu Heikin Ashi Panel
Kaleem Haider
4.56 (18)
Tipu Heikin-Ashi Panel is the modified version of the original Heiken Ashi indicator published by MetaQuotes here . A professional version of this indicator is available here . Features An easy to use Panel that shows the Heiken Ashi trend of selected timeframe. Customizable Buy/Sell alerts, push alerts, email alerts, or visual on-screen alerts. Customizable Panel. The panel can be moved to any place on the chart or minimized to allow more space. Heikin means "the average", and Ashi means "foo
FREE
Download the free USDJPY version   here. MACD Indicator The Moving Average Convergence and Divergence (MACD) is a trend following momentum indicator which shows the relationship between two moving averages that we chose and configure them on the indicator. The MACD is calculated by subtracting the 26-period exponential moving average and the 12 period D.A.M. These are the default parameters when you put the MACD indicator on the charts, and the period is usually 9 which means the last 9 candle
FREE
FREE FOR A LIMITED TIME ONLY!!! The Ultimate Indicator For Trading Trend This indicator clearly shows you the strength of the market in one direction or the other, which means that you can trade knowing you are either with or against the market. When used in conjunction with the +3R principles you are sure to have some serious results. The +3R Principles Routine - This is when you trade and how often  Rules - This is the rule you follow  Risk:Reward - This is the percentage amount of your accoun
FREE
GS spread
Aleksander Gladkov
The indicator calculates the current spread for each tick using the formula Spread=(ASK-BID)/Point. Schedule of changes in the boundaries spread over the timeframe displayed in a separate window from the date of accession of the indicator. Two lines corresponding to the minimum and maximum spread values are displayed. The indicator window is self-adjusted according to the minimum and maximum values from the moment of launch. The minimum and maximum values for the entire period of the indicator o
FREE
Adapter
Yvan Musatov
Индикатор Adapter определяет господствующую тенденцию, помогает анализировать рынок на выбранном временном интервале. Прост в настройке и работает на всех парах и всех временных интервалах. Индикаторы тренда дают возможность классифицировать направление ценового движения, определив его силу. Решение этой проблемы помогает инвесторам вовремя войти в рынок и получить хорошую отдачу. Для любого трейдера крайне важно правильно определить направление и силу трендового движения. К сожалению, единст
Индикатор использует сложный алгоритм, который позволяет ему обнаруживать потенциальные развороты тренда. На основе его кода, индикатор сравнивает движение цены со средним диапазоном свечей. Так же индикатор показывает места флета где появляется разворот и приостанова движения цены Работает на любой валютной паре, с любым таймфреймом Дополнительно можно встроить передачу сигналов в телеграм, Выбор цветов позволяет пользователю настроить свою цветовую гамму.
TrendPlus
Sivakumar Subbaiya
4.08 (12)
Trend Plus   Trendplus  Indicator   Time Frame: Suitable for any time frame.  Purpose: Trend Prediction. Blue and red candle indicate the buy and sell call respectively. Buy: When the blue candle is formed buy call is initiated. close the buy trades when the next red candle will formed.   Sell: When the Red candle is formed Sell call is initiated. close the Sell trades when the next blue candle will formed.   Happy trade!!
FREE
A estratégia de negociação Moving Average Convergence Divergence (MACD) é uma ferramenta popular de análise técnica usada para identificar mudanças no impulso e direção da tendência. O MACD é calculado subtraindo a média móvel exponencial (EMA) de 26 períodos da EMA de 12 períodos. Uma EMA de 9 períodos, chamada "linha de sinal", é então plotada em cima do MACD para atuar como um gatilho para sinais de compra e venda. O MACD é considerado em território de alta quando a linha MACD está acima da l
FREE
OsMA Arrow MTF
Pavel Shutovskiy
4.25 (8)
The indicator displays crossing zero level by Moving Average of Oscillator (OsMA) in the form of arrows. The this is a multi-timeframe indicator, and it displays signals from other timeframes. The indicator notifies about a signal by means of a pop-up Alert window, or sending notification to e-mail. Parameters Time-frame - select timeframe to show indicator signals. Fast EMA Period - fast EMA. This is an exponential moving average from a price with a short period. Slow EMA Period - slow EMA. T
FREE
Heiken Ashi Button
Lee Teik Hong
4.75 (4)
Heiken Ashi Button Heiken-Ashi , often spelled Heikin-Ashi, is a Japanese word that means "Average Bar." The Heiken-Ashi approach can be used in conjunction with candlestick charts to spot market trends and forecast future prices. It's useful for making candlestick charts easier to read and analysing patterns. Traders can use Heiken-Ashi charts to determine when to stay in trades while the trend continues and close trades when the trend reverses. The majority of earnings are made when markets a
FREE
ZigZag Trend Channels indicator is designed to find channel trends. This indicator uses the zigzag indicator, some channel lines and some algorithms. This indicator also sends signal warnings for processing entry points. Up trend, down trend and triangle trend formations. Easy to use and understandable. Channel lines appear on the screen and trend forms are written. Suggestions and Features This indicator has 3 trend features. They are up trend, down trend and triangle trend formations. This i
The BB Arrows MTF indicator is based on the Bollinger Bands indicator. Represents input signals in the form of arrows. All signals are generated on the current bar. In 2 modes, Signals are not redrawn (Exception of very sharp jumps)! All signals in MTF mode correspond to signals of the period specified in MTF. It is maximally simplified to use both for trading with only one indicator and for using the indicator as part of your trading systems. A feature of the indicator is that the indicator ti
FREE
TCCI with Alert
Wen Huang
4.6 (5)
Esta é UMA média de índice semelhante com base num algoritmo definido pelo utilizador. De acordo com a banda, o uplink e o downlink podem ser identificados por Cor. A caixa de pop-up Pode ser ligada ou desligada para indicar que a ordem de compra Ou Venda actual deve ser colocada. Descrição Da lista de parâmetros: Preço exterior = 0; // preço médio inicial do indicador Comprimento exterior = 20; // o indicador calcula o período médio, que é equivalente Ao período médio de Ma.
FREE
Scalping Binary Option Pro is an arrow indicator that is completely free from repainting . Although it may work incorrectly in strategy testers, its signals remain relevant for real trading. Signals: A red arrow pointing down indicates a selling opportunity, while a green arrow pointing up indicates a buying opportunity. Settings: All you need to adjust are the colors of the signal arrows and the sound alert for signal notifications. Usage Recommendations: It is best to use the indicator on hig
MACD Double
Dorian Baranes
5 (3)
This indicator calculates buy and sell signals by using MACD indicator on two timeframes. MACD is a trend-following showing the relationship between two moving averages of the closing price. The MACD is calculated by subtracting the 26-period Exponential Moving Average (EMA) from the 12-period EMA.The result of that calculation is the MACD line. A nine-day EMA of the MACD called the "signal line". This indicator has 2 modes to calculate the buy/sell signals: - MACD crosses 0 line - MACD cro
FREE
Are you tired of drawing trendlines every time you're analyzing charts? Or perhaps you would like more consistency in your technical analysis. Then this is for you. This indicator will draw trend lines automatically when dropped on a chart. How it works Works similar to standard deviation channel found on mt4 and mt5. It has 2 parameters: 1. Starting Bar 2. Number of bars for calculation The   starting bar   is the bar which drawing of the trend lines will begin, while the   number of bars for c
FREE
Os compradores deste produto também adquirem
Gann Made Easy
Oleg Rodin
4.86 (83)
Gann Made Easy é um sistema de negociação Forex profissional e fácil de usar, baseado nos melhores princípios de negociação usando a teoria do sr. W. D. Gann. O indicador fornece sinais precisos de COMPRA e VENDA, incluindo níveis de Stop Loss e Take Profit. Você pode negociar mesmo em movimento usando notificações PUSH. Entre em contato comigo após a compra! Vou compartilhar minhas dicas de negociação com você e ótimos indicadores de bônus de graça! Provavelmente você já ouviu muitas vezes sobr
- Real price is 80$ - 40% Discount ( It is 49$ now ) Contact me for instruction, add group and any questions! Related Products:  Bitcoin Expert , Gold Expert Introduction The breakout and retest strategy is traded support and resistance levels. it involves price breaking through a previous level.  The break and retest strategy is designed to help traders do two main things, the first is to avoid false breakouts. Many false breakouts start with a candlestick that breaks out of a level but ends w
FX Volume
Daniel Stein
4.58 (33)
Receba a sua atualização diária do mercado com detalhes e screenshots através do nosso Morning Briefing aqui no mql5 e no Telegram ! O Volume FX é o PRIMEIRO e ÚNICO indicador de volume que fornece uma visão REAL do sentimento do mercado do ponto de vista de um corretor. Ele fornece uma visão incrível de como os participantes do mercado institucional, como corretores, estão posicionados no mercado Forex, muito mais rápido do que os relatórios COT. Ver essas informações diretamente no seu gráfi
Enigmera
Ivan Stefanov
5 (3)
ENIGMERA: O núcleo do mercado https://www.enigmera.com Introdução Este indicador e sistema de negociação é uma abordagem notável aos mercados financeiros. ENIGMERA utiliza os ciclos fractais para calcular com precisão os níveis de suporte e resistência. Mostra a autêntica fase de acumulação e dá direcções e objectivos.  Um sistema que funciona quer estejamos numa tendência ou numa correção.  Como é que funciona? O ENIGMERA é composto por três linhas: a linha de suporte/resistência, a linha
Gold Stuff
Vasiliy Strukov
4.89 (241)
Gold Stuff-um indicador de tendência projetado especificamente para o ouro, também pode ser usado em qualquer instrumento financeiro. O indicador não é redesenhado ou atrasado. O timeframe recomendado é H1. O EA Gold Stuff Expert Advisor está escrito neste indicador, você pode encontrá-lo no meu perfil. Importante! Entre em contato comigo imediatamente após a compra para obter instruções e bônus!  Você pode obter uma cópia gratuita do nosso indicador Strong Support e Trend Scanner, envie um
Atomic Analyst
Issam Kassas
5 (2)
Primeiramente, vale ressaltar que este Indicador de Negociação não repinta, não redesenha e não apresenta atrasos, tornando-o ideal tanto para negociação manual quanto automatizada. Manual do utilizador: configurações, entradas e estratégia. O Analista Atômico é um Indicador de Ação de Preço PA que utiliza a força e o momentum do preço para encontrar uma vantagem melhor no mercado. Equipado com filtros avançados que ajudam a remover ruídos e sinais falsos, e aumentam o potencial de negociação.
FX Power MT4 NG
Daniel Stein
5 (13)
Receba a sua atualização diária do mercado com detalhes e screenshots através do nosso Morning Briefing aqui no mql5 e no Telegram ! O FX Power MT4 NG é a próxima geração do nosso medidor de força de moeda muito popular de longa data, o FX Power. E o que é que este medidor de força da próxima geração oferece? Tudo o que adorou no FX Power original MAIS Análise de força GOLD/XAU Resultados de cálculo ainda mais precisos Períodos de análise configuráveis individualmente Limite de cálculo personal
Trend Punch
Mohamed Hassan
4.95 (19)
This indicator is unstoppable when combined with our other indicator called  Support & Resistance . After purchase, send us a message and you will get it   for  FREE as a BONUS! Introducing Trend Punch , the revolutionary forex trend indicator that will transform the way you trade! Trend Punch is uniquely designed to provide precise buy and sell arrows during strong market trends, making your trading decisions clearer and more confident. Whether you're trading major currency pairs or exotic sym
Gann Swing Structure
Kirill Borovskii
5 (1)
This indicator is based on the mathematics of the great trader W.D. Ganna. With its help, you can easily find strong levels by analyzing swings to find the optimal entry point. The indicator works on all instruments and all timeframes. The indicator is fully manual and has control buttons. All you need to do is press the NEW button, a segment will appear, which you can place on any movement, swing or even 1 candle that you want to analyze. By placing the segment, press the OK button. A grid (th
Scalper Inside PRO
Alexey Minkov
4.73 (56)
An exclusive indicator that utilizes an innovative algorithm to swiftly and accurately determine the market trend. The indicator automatically calculates opening, closing, and profit levels, providing detailed trading statistics. With these features, you can choose the most appropriate trading instrument for the current market conditions. Additionally, you can easily integrate your own arrow indicators into Scalper Inside Pro to quickly evaluate their statistics and profitability. Scalper Inside
Dynamic Forex28 Navigator
Bernhard Schweigert
5 (1)
Dynamic Forex28 Navigator - A ferramenta de negociação Forex de última geração. ATUALMENTE 49% DE DESCONTO. Dynamic Forex28 Navigator é a evolução dos nossos indicadores populares de longa data, combinando o poder de três em um: Indicador Advanced Currency Strength28 (695 avaliações) + Advanced Currency IMPULSE com ALERTA (520 avaliações) + Sinais CS28 Combo (Bônus). Detalhes sobre o indicador https://www.mql5.com/en/blogs/post/758844 O que o Next-Generation Strength Indicator oferece?  T
Actualmente 20% OFF ! A melhor solução para qualquer novato ou comerciante especializado! Este software de painel de instrumentos está a funcionar em 28 pares de moedas. É baseado em 2 dos nossos principais indicadores (Advanced Currency Strength 28 e Advanced Currency Impulse). Dá uma grande visão geral de todo o mercado Forex. Mostra valores avançados de força da moeda, velocidade de movimento da moeda e sinais para 28 pares de divisas em todos os (9) períodos de tempo. Imagine como a sua
Trend Screener
STE S.S.COMPANY
4.81 (88)
Indicador de tendência, solução única inovadora para negociação e filtragem de tendências com todos os recursos de tendências importantes construídos dentro de uma ferramenta! É um indicador multi-timeframe e multi-moedas 100% sem repintura que pode ser usado em todos os símbolos/instrumentos: forex, commodities, criptomoedas, índices e ações. OFERTA POR TEMPO LIMITADO: O indicador Support and Resistance Screener está disponível por apenas US$ 50e vitalício. (Preço original US$ 250) (oferta este
TPSproTREND PrO
Roman Podpora
4.79 (19)
TPSpro TREND PRO   é um indicador de tendência que analisa automaticamente o mercado e fornece informações sobre a tendência e cada uma de suas mudanças, além de dar sinais para entrar em negociações sem redesenhar! O indicador utiliza cada vela, analisando-as separadamente. referindo-se a diferentes impulsos - impulso para cima ou para baixo. Pontos de entrada exatos em transações de moedas, criptomoedas, metais, ações, índices! Versão MT5                   DESCRIÇÃO COMPLETA DO INDICADOR    
Apresentamos o ON Trade Waves Patterns Harmonic Elliot Wolfe, um indicador avançado projetado para detectar diversos tipos de padrões no mercado, usando métodos manuais e automáticos. Aqui está como ele funciona: Padrões Harmônicos: Este indicador pode identificar padrões harmônicos que aparecem em seu gráfico. Esses padrões são essenciais para traders que praticam a teoria de negociação harmônica, conforme popularizada no livro de Scott Carney "Harmonic Trading vol 1 e 2". Seja desenhando-os m
Scalper Vault
Oleg Rodin
5 (27)
Scalper Vault é um sistema profissional de escalpelamento que fornece tudo o que você precisa para um escalpelamento bem-sucedido. Este indicador é um sistema de negociação completo que pode ser usado por comerciantes de forex e opções binárias. O período de tempo recomendado é M5. O sistema fornece sinais de seta precisos na direção da tendência. Ele também fornece sinais superiores e inferiores e níveis de mercado Gann. Os indicadores fornecem todos os tipos de alertas, incluindo notificações
TPA True Price Action indicator reveals the true price action of the market makers through 100% non-repainting signals (except early signals mode) strictly at the close of a candle! TPA shows entries and re-entries, every time the bulls are definitely stronger than the bears and vice versa. Not to confuse with red/green candles. The shift of power gets confirmed at the earliest stage and is ONE exit strategy of several. There are available now two free parts of the TPA User Guide for our custo
Stratos Pali
Michela Russo
5 (1)
Stratos Pali Indicator   is a revolutionary tool designed to enhance your trading strategy by accurately identifying market trends. This sophisticated indicator uses a unique algorithm to generate a complete histogram, which records when the trend is Long or Short. When a trend reversal occurs, an arrow appears, indicating the new direction of the trend. Important Information Revealed Leave a review and contact me via mql5 message to receive My Top 5 set files for Stratos Pali at no cost! D
Currency Strength Wizard é um indicador muito poderoso que fornece uma solução completa para uma negociação bem-sucedida. O indicador calcula o poder deste ou daquele par forex usando os dados de todas as moedas em vários intervalos de tempo. Esses dados são representados em uma forma de índice de moeda fácil de usar e linhas de energia de moeda que você pode usar para ver o poder desta ou daquela moeda. Tudo o que você precisa é anexar o indicador ao gráfico que deseja negociar e o indicador mo
O sistema PRO Renko é um sistema de negociação altamente preciso especialmente concebido para a negociação de gráficos RENKO. Trata-se de um sistema universal que pode ser aplicado a vários instrumentos de negociação. O sistema neutraliza eficazmente o chamado ruído de mercado, dando-lhe acesso a sinais de inversão precisos. O indicador é muito fácil de usar e tem apenas um parâmetro responsável pela geração de sinal. Você pode facilmente adaptar a ferramenta a qualquer instrumento de negoc
TPSpro RFI Levels
Roman Podpora
4.82 (22)
INSTRUÇÕES         Russo   -        ENG       R   ecomendado para uso com um indicador       -       TPSpro   TREND PRO -   Versão MT4         Um elemento-chave na negociação são as zonas ou níveis a partir dos quais as decisões de comprar ou vender um instrumento de negociação são tomadas. Apesar das tentativas dos principais participantes de esconder sua presença no mercado, eles inevitavelmente deixam rastros. Nossa tarefa era aprender como identificar esses rastros e interpretá-los corretame
Currency Strength Exotics
Bernhard Schweigert
4.87 (30)
ACTUALMENTE 20% DE DESCONTO ! A melhor solução para qualquer novato ou comerciante especializado! Este Indicador é especializado para mostrar a força da moeda para quaisquer símbolos como Pares Exóticos de Commodities, Índices ou Futuros. É o primeiro do seu género, qualquer símbolo pode ser adicionado à 9ª linha para mostrar a verdadeira força da moeda de Ouro, Prata, Petróleo, DAX, US30, MXN, TRY, CNH etc. Esta é uma ferramenta de negociação única, de alta qualidade e acessível, porque in
Trend Pulse
Mohamed Hassan
5 (4)
Please contact me after purchase to immediately get your PDF strategy + documentation for Trend Pulse !  Introducing Trend Pulse , a unique and robust indicator capable of detecting bullish, bearish, and even ranging trends! Trend Pulse uses a special algorithm to filter out market noise with real precision. If the current symbol is moving sideways, Trend Pulse will send you a ranging signal, letting you know that it's not a good time to enter a trade. This excellent system makes Trend Pulse
Antes de tudo, vale ressaltar que esta Ferramenta de Negociação é um Indicador Não Repintante, Não Redesenhante e Não Atrasado, o que a torna ideal para negociação profissional. Curso online, manual do utilizador e demonstração. O Indicador de Conceitos de Ação de Preço Inteligente é uma ferramenta muito poderosa tanto para traders novos quanto experientes. Ele combina mais de 20 indicadores úteis em um único, combinando ideias avançadas de negociação como Análise do Trader do Círculo Interno e
MetaBands M4
Vahidreza Heidar Gholami
5 (2)
MetaBands utiliza algoritmos poderosos e únicos para desenhar canais e detectar tendências, a fim de fornecer aos traders pontos potenciais para entrar e sair de negociações. É um indicador de canal mais um indicador de tendência poderoso. Inclui diferentes tipos de canais que podem ser mesclados para criar novos canais simplesmente usando os parâmetros de entrada. O MetaBands usa todos os tipos de alertas para notificar os usuários sobre eventos de mercado. Recursos Suporta a maioria dos algori
ICT, SMC, SMART MONEY CONCEPTS, SMART MONEY, Smart Money Concept, Support and Resistance, Trend Analysis, Price Action, Market Structure, Order Blocks, BOS/CHoCH,   Breaker Blocks ,  Momentum Shift,   Supply&Demand Zone/Order Blocks , Strong Imbalance, HH/LL/HL/LH,    Fair Value Gap, FVG,  Premium  &   Discount   Zones, Fibonacci Retracement, OTE, Buy Side Liquidity, Sell Side Liquidity, BSL/SSL Taken, Equal Highs & Lows, MTF Dashboard, Multiple Time Frame, BigBar, HTF OB, HTF Market Structure, 
Gold Channel   é um indicador baseado na volatilidade, desenvolvido com um algoritmo de tempo especifico para o par XAUUSD que consiste em encontrar possíveis correções no mercado. Este indicador mostra duas linhas exteriores, uma interior (linha de retração) e um sinal de seta, onde a teoria do canal consiste em ajudar a identificar condições de sobrecompra e sobrevenda no mercado. O preço do mercado cairá geralmente entre os limites do canal. Se os preços tocarem ou se moverem para fora do can
Torne-se um Negociador Breaker e lucre com as mudanças na estrutura do mercado à medida que o preço reverte. O indicador de quebra de bloco de pedidos identifica quando uma tendência ou movimento de preço está chegando à exaustão e pronto para reverter. Ele o alerta sobre mudanças na estrutura do mercado, que normalmente ocorrem quando uma reversão ou uma grande retração está prestes a ocorrer. O indicador usa um cálculo proprietário que identifica rupturas e momento do preço. Toda vez que
Automated Trendlines
Georgios Kalomoiropoulos
5 (16)
As linhas de tendência são a ferramenta mais essencial de análise técnica na negociação forex. Infelizmente, a maioria dos traders não os desenha corretamente. O indicador Automated Trendlines é uma ferramenta profissional para traders sérios que o ajudam a visualizar o movimento de tendências dos mercados. Existem dois tipos de Trendlines Bullish Trendlines e Bearish Trendlines. Na tendência de alta, a linha de tendência Forex é desenhada através dos pontos de oscilação mais baixos do m
Reversal Sniper is designed to find the extreme reversals of the price. Indicator collects data of Cycle Sniper Indicator. NOTE: REVERSAL SNIPER Indicator is made for Cycle Sniper Users as an additional tool.  However, it can be used by the traders who look for finding out strong reversal levels. Indicator works on all timeframes and all instruments. Reversal  Sniper  Checks: Harmonic Patterns RSI Zig Zag and Harmonic Swings Cycle Sniper Indicator's Buy / Sell Signals The complex algo i
Mais do autor
Legacy of Gann
Pavel Zamoshnikov
4.83 (12)
The indicator very accurately determines the levels of the possible end of the trend and profit fixing. The method of determining levels is based on the ideas of W.D.Gann, using an algorithm developed by his follower Kirill Borovsky. Extremely high reliability of reaching levels (according to K. Borovsky  - 80-90%) Indispensable for any trading strategy – every trader needs to determine the exit point from the market! Precisely determines targets on any timeframes and any instruments (forex, met
Legacy of Gann for MT5
Pavel Zamoshnikov
5 (5)
The indicator very accurately determines the levels of the possible end of the trend and profit fixing. The method of determining levels is based on the ideas of W.D.Gann, using an algorithm developed by his follower Kirill Borovsky. Extremely high reliability of reaching levels (according to K. Borovsky  - 80-90%) Indispensable for any trading strategy – every trader needs to determine the exit point from the market! Precisely determines targets on any timeframes and any instruments (forex, met
Pattern 1 2 3
Pavel Zamoshnikov
4.5 (24)
The indicator automatically identifies the 1-2-3 pattern on the chart. The indicator is able to monitor the formation of pattern in real time. It informs the trader when the pattern is completely formed (when the price breaks the line in point 2) and displays the completed patterns in history. The patterns are never redrawn. The indicator can identify patterns on any instruments (currency pairs, stock market, gold, etc.) without the need to adjust to each instrument. Simple and clear visualizati
Pattern 1 2 3 MT5
Pavel Zamoshnikov
4.38 (8)
The indicator automatically identifies the 1-2-3 pattern on the chart. The indicator is able to monitor the formation of pattern in real time. It informs the trader when the pattern is completely formed (when the price breaks the line in point 2) and displays the completed patterns in history. The patterns are never redrawn. The indicator can identify patterns on any instruments (currency pairs, stock market, gold, etc.) without the need to adjust to each instrument. Simple and clear visualizati
HMA Color with Alerts MT5
Pavel Zamoshnikov
4.73 (48)
Hull Moving Average (HMA) is well-deservedly popular among traders because of the effective averaging of market noise and a relatively small delay. The current MetaTrader 5 version changes its color when the movement direction changes. Sound and text signals are available. It also supports sending email and push messages. It is possible to trigger a signal on the current incomplete bar, although such a signal may be canceled before completion if conditions are no longer appropriate. One of the p
FREE
HMA Trend
Pavel Zamoshnikov
4.6 (68)
A trend indicator based on the Hull Moving Average (HMA) with two periods. The Hull Moving Average is an improved variant of the moving average, which shows the moment of trend reversal quite accurately. It is often used as a signal filter. Combination of two types of Hull Moving Averages makes a better use of these advantages: HMA with a slow period identifies the trend, while HMA with a fast period determines the short-term movements and signals in the trend direction. Features The movement
FREE
HMA Trend Professional MT5
Pavel Zamoshnikov
4.25 (4)
Improved version of the free HMA Trend indicator (for MetaTrader 4) with statistical analysis. HMA Trend is a trend indicator based on the Hull Moving Average (HMA) with two periods. HMA with a slow period identifies the trend, while HMA with a fast period determines the short-term movements and signals in the trend direction. The main differences from the free version: Ability to predict the probability of a trend reversal using analysis of history data. Plotting statistical charts for analyz
Double HMA MTF for MT5
Pavel Zamoshnikov
4 (4)
This is an advanced multi-timeframe version of the popular Hull Moving Average (HMA) Features Two lines of the Hull indicator of different timeframes on the same chart. The HMA line of the higher timeframe defines the trend, and the HMA line of the current timeframe defines the short-term price movements. A graphical panel with HMA indicator data from all timeframes at the same time . If the HMA switched its direction on any timeframe, the panel displays a question or exclamation mark with a tex
Trend Monitor
Pavel Zamoshnikov
4 (4)
The indicator generates early signals basing on ADX reading data combined with elements of price patterns. Works on all symbols and timeframes. The indicator does not redraw its signals. You see the same things on history and in real time. For better visual perception signals are displayed as arrows (in order not to overload the chart). Features Easy to use. Filter configuration only requires selection of sensitivity in the " Sensitivity of the indicator " input. Signals can be filtered usin
Candle Pattern Finder MT5
Pavel Zamoshnikov
4.2 (5)
This indicator searches for candlestick patterns. Its operation principle is based on Candlestick Charting Explained: Timeless Techniques for Trading Stocks and Futures by Gregory L. Morris. If a pattern is detected, the indicator displays a message at a bar closure. If you trade using the MetaTrader 4 terminal, then you can download the full analogue of the " Candle Pattern Finder for MT4 " indicator It recognizes the following patterns: Bullish/Bearish (possible settings in brackets) : Hamme
This is advanced Multi-Symbol and Multi-Timeframe version of the "Candle Pattern Finder" indicator (search for candlestick patterns based on the book by Gregory L. Morris "Candlesticks charting explained. Timeless techniques for trading stocks and futures" ). The indicator searches for candlestick patterns for ALL symbols of the "Market Watch" window and for ALL standard timeframes from M1 to MN1. When patterns appear on any symbol / timeframe, the indicator gives a signal (text, sound, sending
HMA Trend Professional MT4
Pavel Zamoshnikov
4.57 (7)
Improved version of the free HMA Trend indicator (for MetaTrader 4) with statistical analysis. HMA Trend is a trend indicator based on the Hull Moving Average (HMA) with two periods. HMA with a slow period identifies the trend, while HMA with a fast period determines the short-term movements and signals in the trend direction. The main differences from the free version: Ability to predict the probability of a trend reversal using analysis of history data. Plotting statistical charts for analyz
Three Stochastics
Pavel Zamoshnikov
3.89 (9)
This indicator signals about crossing of the main and the signal lines of stochastic (lower stochastic) in the trend direction which is determined by two stochastics of higher time frames (higher stochastics). It is not a secret that stochastic generates accurate signals in a flat market and a lot of false signals in a protracted trend. A combination of two stochastics of higher time frames performs a good filtration of false signals and shows the main tendency. The indicator is recommended for
FREE
Alarm Clock MT4
Pavel Zamoshnikov
3.67 (3)
Alarm Clock generates sound signal at the prescribed time. Time is set by a vertical line on the chart. Just shift this line on the chart to the future. After you set the line at the desired time, you can do whatever you want with the chart, like change a timeframe and a symbol - the alarm clock will generate a signal at the prescribed time anyway. If you accidentally remove the line, the indicator will restore it at the prescribed time. You can attach the indicator to different charts and set d
FREE
The indicator automatically builds Support/Resistance levels (Zones) from different timeframes on one chart. Support-resistance levels are horizontal lines. As a rule, the market does not respond to a specific price level, but to a price range around the level, because demand and supply of market participants are not formed clearly on the line, but are “spread out” at a certain distance from the level. This indicator determines and draws precisely such a price range within which strong pos
Double HMA MTF for MT4
Pavel Zamoshnikov
4.2 (5)
This is an advanced multi-timeframe version of the popular Hull Moving Average (HMA). Features Graphical panel with HMA indicator data from all timeframes at the same time . If the HMA has switched its direction on any timeframe, a question mark or exclamation mark is displayed on the panel, accompanied by a text and audio message. The messages can be configured separately for each timeframe using the corresponding checkboxes. The indicator is located in a separate window, so as not to overloa
Candle Pattern Finder
Pavel Zamoshnikov
5 (10)
The indicator finds candlestick patterns based on Gregory L.' Morris "Candlestick Charting Explained: Timeless Techniques for Trading Stocks and Futures". If a pattern is detected, the indicator displays a message at a bar closure. If you trade using the MetaTrader 5 terminal, then you can download the full analogue of the " Candle Pattern Finder for MT5 " indicator It recognizes the following patterns: Bullish/Bearish (possible settings in brackets) : Hammer / Shooting Star (with or without con
CSV2Chart
Pavel Zamoshnikov
5 (3)
The script visually displays deals from CSV format reports on MT4 terminal charts. It automatically recognizes popular formats: MQL5.com Trading Signals for MT4 / MT5 platforms MyFXBook service Copy the report file to the <Data Folder>\MQL4\Files folder and run the script on any chart. The script analyzes the CSV file, automatically creates new charts for all instruments that are found in the report, and draws the deals of each instrument on a separate chart. The script additionally calculates
FREE
Information Panel
Pavel Zamoshnikov
5 (4)
The information panel displays important trading information on the chart. Visual display of the information will help you to make a prompt and precise trading decision. Screenshots depict information which I use in my trading system. But you can add any other desired information.  To do this contact me via MQL5 web-site. Displayed information: Time till the end of the current candle and formation of a new one. Time set format: hh:mm, if there is at least one full hour, or mm:ss, if you have les
FREE
Download Quotes
Pavel Zamoshnikov
5 (2)
The script automatically downloads historical data for all instruments from the "Market Watch" window, on all timeframes from M1 to MN1. It is recommended to use the script before launching multi-symbol and multi-timeframe indicators that work simultaneously with many instruments. Features: To download quotes, the script uses the MQL API only. This is a necessary requirement for publishing programs on the MQL-Market. This method is fast enough, but effective in not all cases. A more reliable (bu
FREE
Stochastic Ichimoku
Pavel Zamoshnikov
4.43 (7)
This indicator signals about Stochastic crossing in the trend direction which is determined by the position of the price relative to the Ichimoku cloud. Features: Flexible settings: filtering signals by bullish/bearish bars ( parameter "BUY - the bullish bar only; SELL - the bear bar only" ); setting levels of Stochastic crossing ( parameters "BUY-signal if Stochastic below this level" and "BUY-signal if Stochastic below this level" ) ability to use the Ichimoku cloud of higher timeframes ( pa
MACDivergence MTF
Pavel Zamoshnikov
4.29 (7)
Advanced ideas of the popular MACD indicator: It detects and displays classic and reverse divergences (three methods of detecting divergences). It uses different color to highlight an uptrend and a downtrend. Two methods of determining a trend: а) MACD crosses the 0 level (classic signal); б) MACD crosses its own average (early signal). This is a multi-timeframe indicator: it can display MACD data from other timeframes. Two methods of drawing: classic histogram and line. It generates sound and v
Trend Power
Pavel Zamoshnikov
4.43 (7)
A very powerful tool that analyzes the direction and the strength of the 8 major currencies: EUR, GBP, AUD, NZD, CAD, CHF, JPY, USD – both in real time, and on historical data. The indicator generates a sound signal and a message when a trend changes. Never repaints signal. The strength of the signal is calculated for all pairs which include these currencies (28 pairs total), can have value from 0 to 6 on a bullish trend, and from 0 to -6 on a bearish trend. Thus, you will never miss a good move
Parabolic SAR is one of the most popular indicators allowing you to determine in a timely manner the trend reversal, get an early entry point and accurately define the place of profit taking. Parabolic SAR is very efficient in case of a trendy market but often gives false signals during a flat. In order to sort such signals out, it is possible to use the same indicator on higher timeframes. This eliminates the main drawback of the indicator during a flat, while retaining its advantage of early e
Market Calculator is a powerful tool that allows you to easily and quickly calculate the main parameters of a trade: Lot size, StopLoss and TakeProfit, as well as estimate the amount of funds (required Margin) to open a position. The program has a very convenient and intuitive control, because implemented in OS Windows style. There are many interesting and handy features - just watch the video: youtu.be/FG2qqTJTIhE All program data are sorted into sections in the form of tabs: " Lot Calculator "
This is advanced Multi-Symbol and Multi-Timeframe version of the " Candle Pattern Finder " program (search for candlestick patterns based on the book by Gregory L. Morris "Candlesticks charting explained. Timeless techniques for trading stocks and futures" ). This version is implemented as an Expert Advisor-assistant to reduce the load on the terminal. The EA does not trade on its own. The program searches for candlestick patterns for ALL symbols of the "Market Watch" window and for ALL standar
The "Spread Monitor" indicator allows you to analyze the spread change during the day, control the expansion of the spread by your broker and has a number of interesting additional features Choosing a broker with a minimum spread value is very important for the work of night advisors, scalping and intraday trading. However, the MT4 terminal does not store spread data, so the multifunctional "Spread Monitor" indicator will be useful for any intraday trader. Features: The indicator shows the cu
Trend Monitor MT5
Pavel Zamoshnikov
4.5 (2)
The indicator generates early signals basing on ADX reading data combined with elements of price patterns. Works on all symbols and timeframes. The indicator does not redraw its signals. You see the same things on history and in real time. For better visual perception signals are displayed as arrows (in order not to overload the chart). Features The best results are obtained when the indicator works on two timeframes. For example: M30 – the indicator shows the main trend; M5 – the indicator ge
MACDivergence MTF MT5
Pavel Zamoshnikov
4 (5)
Advanced ideas of the popular MACD indicator: It detects and displays classic and reverse divergences (two methods of detecting divergences). It uses different color to highlight an uptrend and a downtrend. Two methods of determining a trend: а) MACD crosses the 0 level (classic signal); б) MACD crosses its own average (early signal). This is a multi-timeframe indicator: it can display MACD data from other timeframes. Two methods of drawing: classic histogram and line. It generates sound and vis
Filtro:
Sem comentários
Responder ao comentário
Versão 2.12 2024.06.28
At the request of traders, a notification about a change in trend to flat has been added. The "Notification when the trend changes to flat" parameter enables or disables this notification.