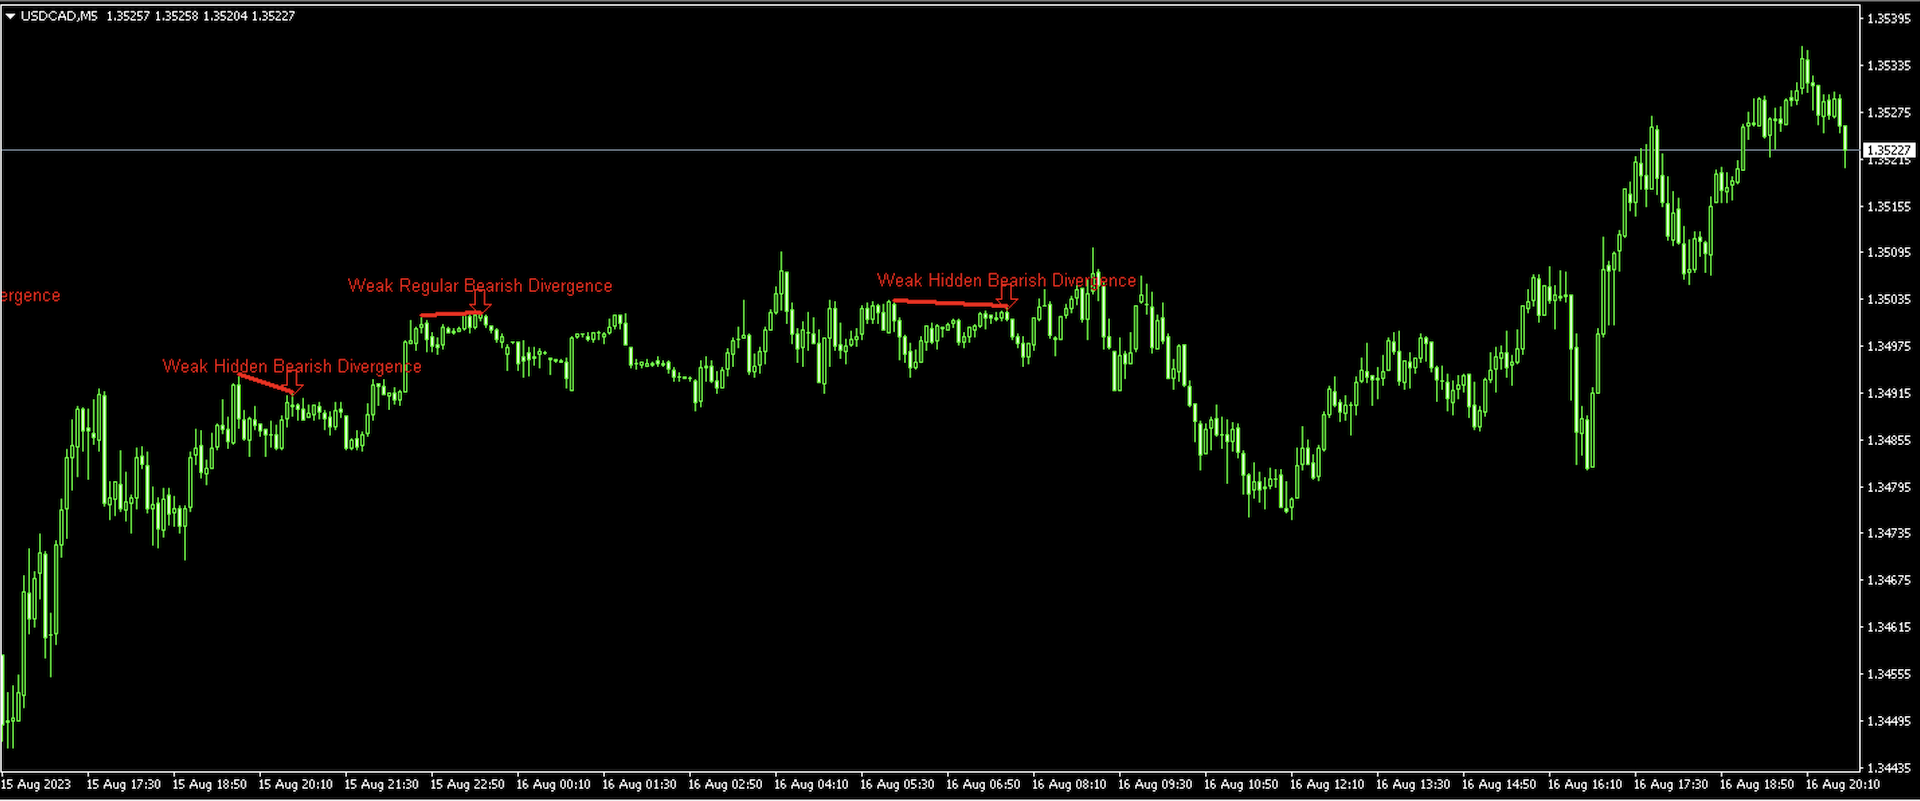
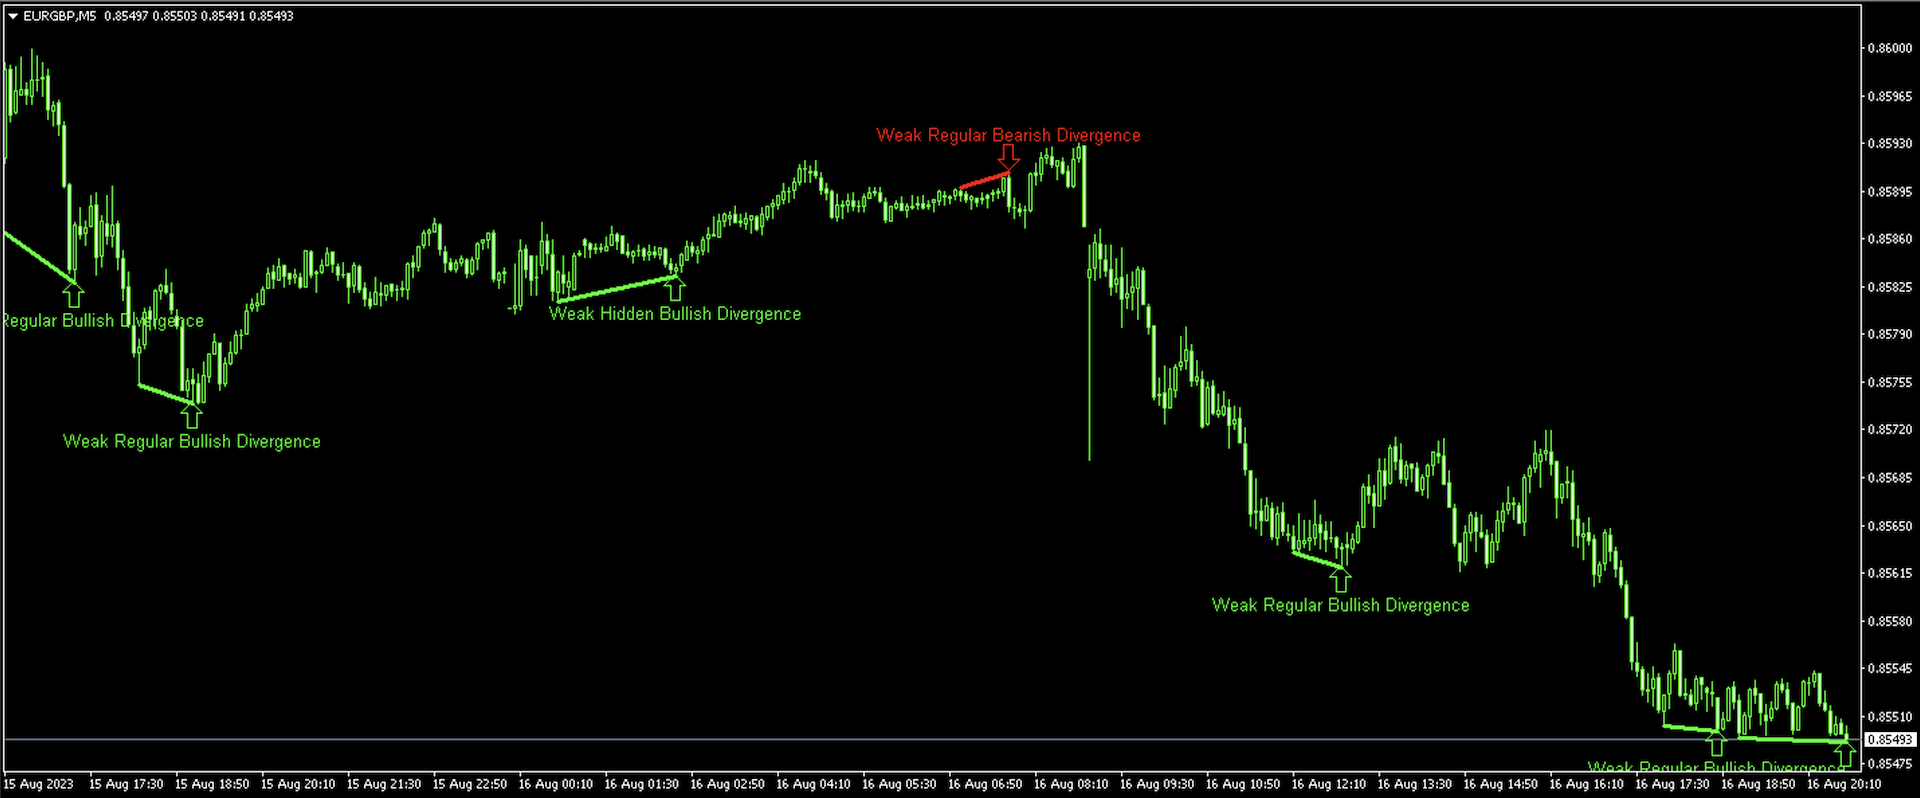
Investment Castle RSI Divergence
O Indicador de Divergência RSI é uma ferramenta poderosa projetada para identificar possíveis reversões no mercado ao detectar discrepâncias entre o Índice de Força Relativa (RSI) e o movimento de preços. As divergências podem ser um sinal significativo de uma mudança de tendência iminente, seja de alta para baixa ou vice-versa. Este indicador foi criado para tornar a tarefa de identificar oportunidades de negociação potenciais mais simples e eficiente.
Características:
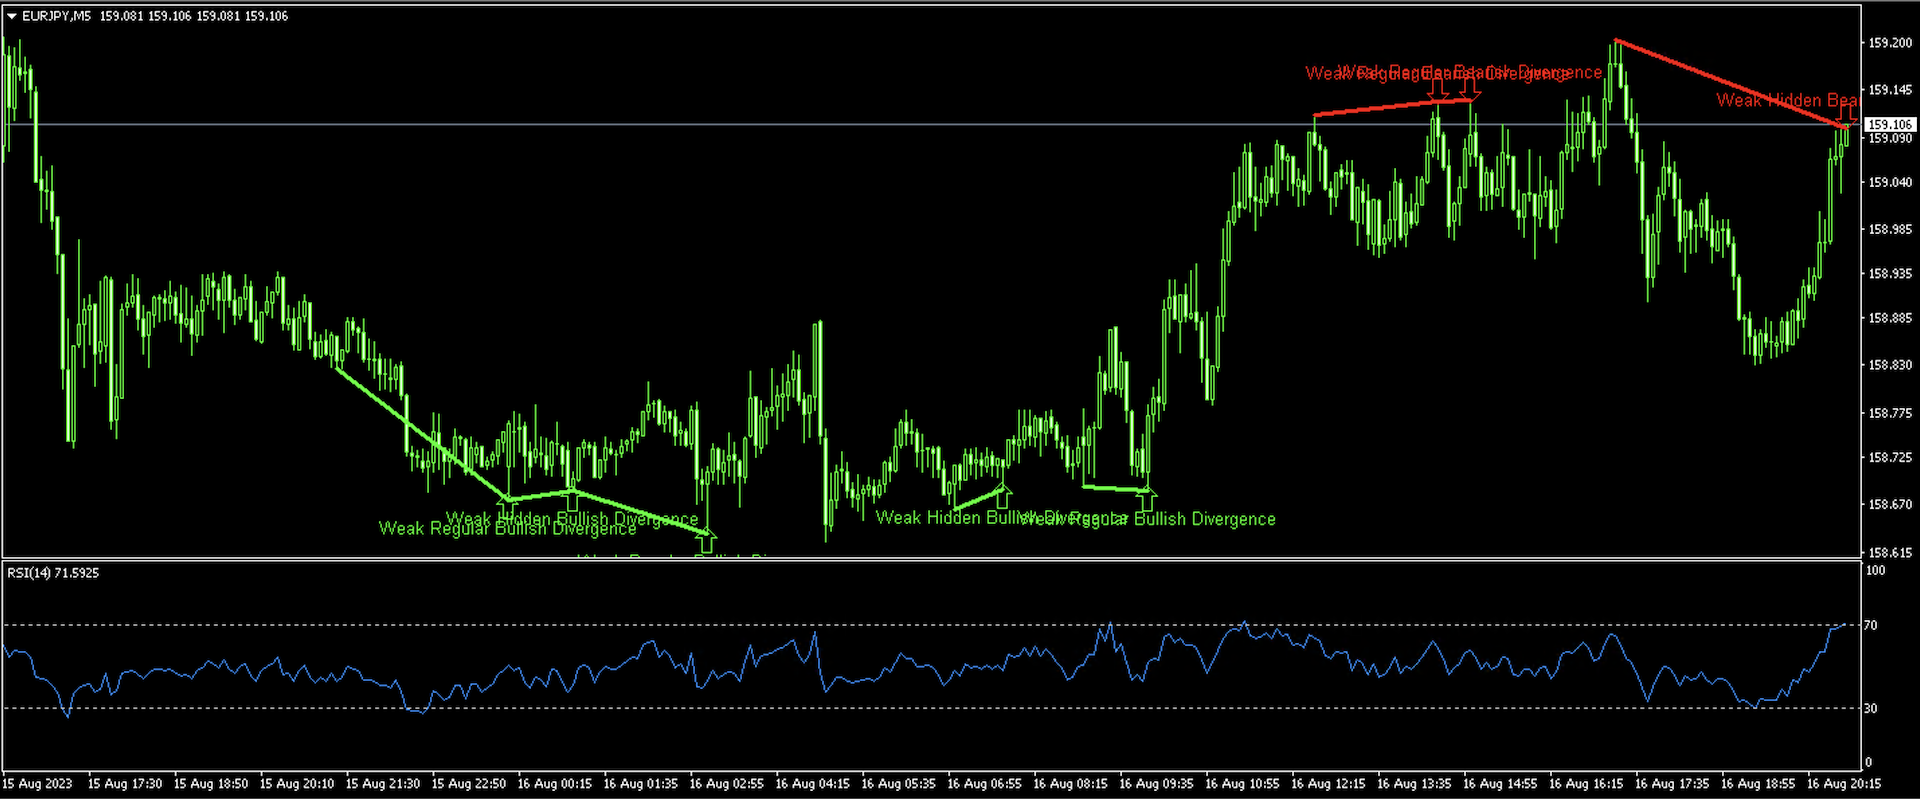
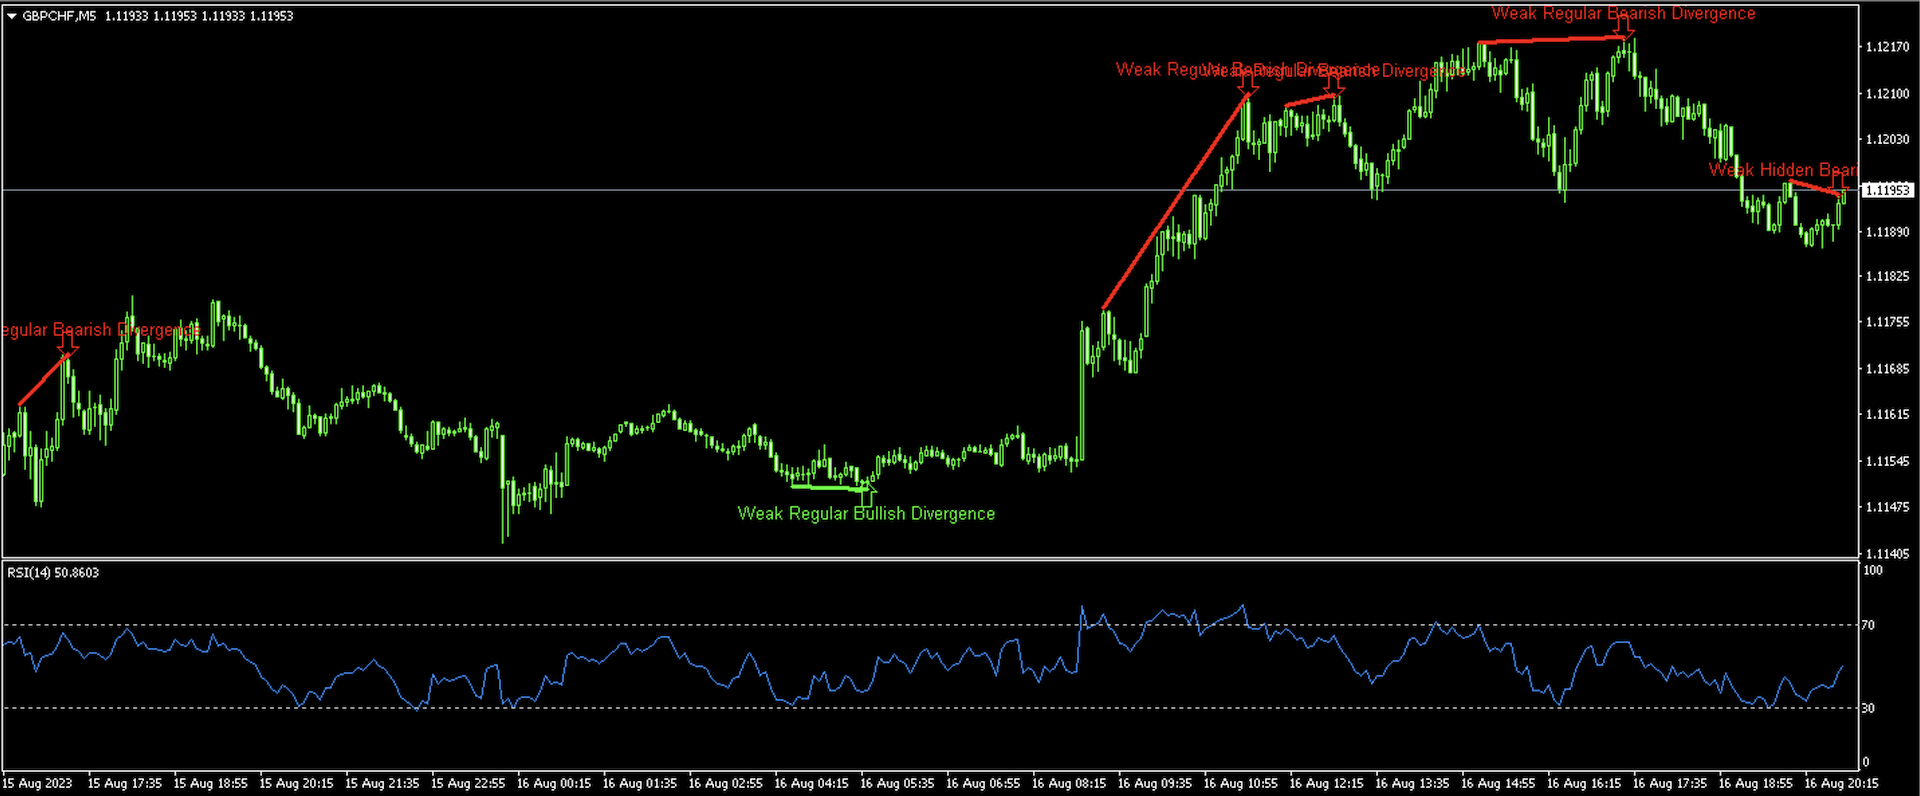
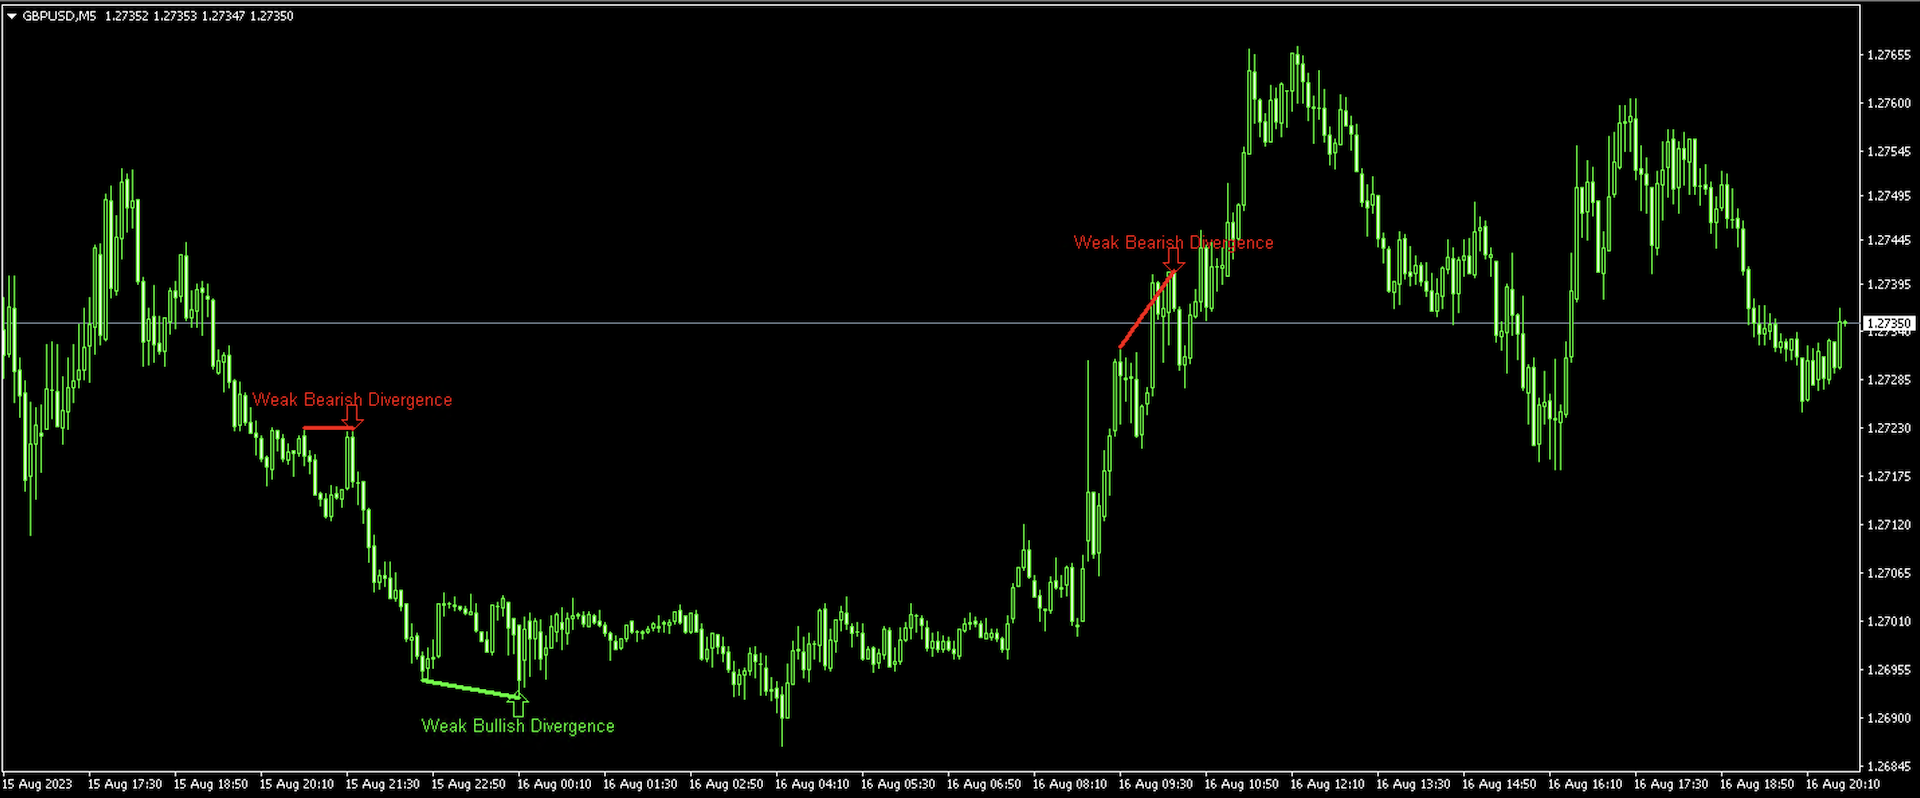
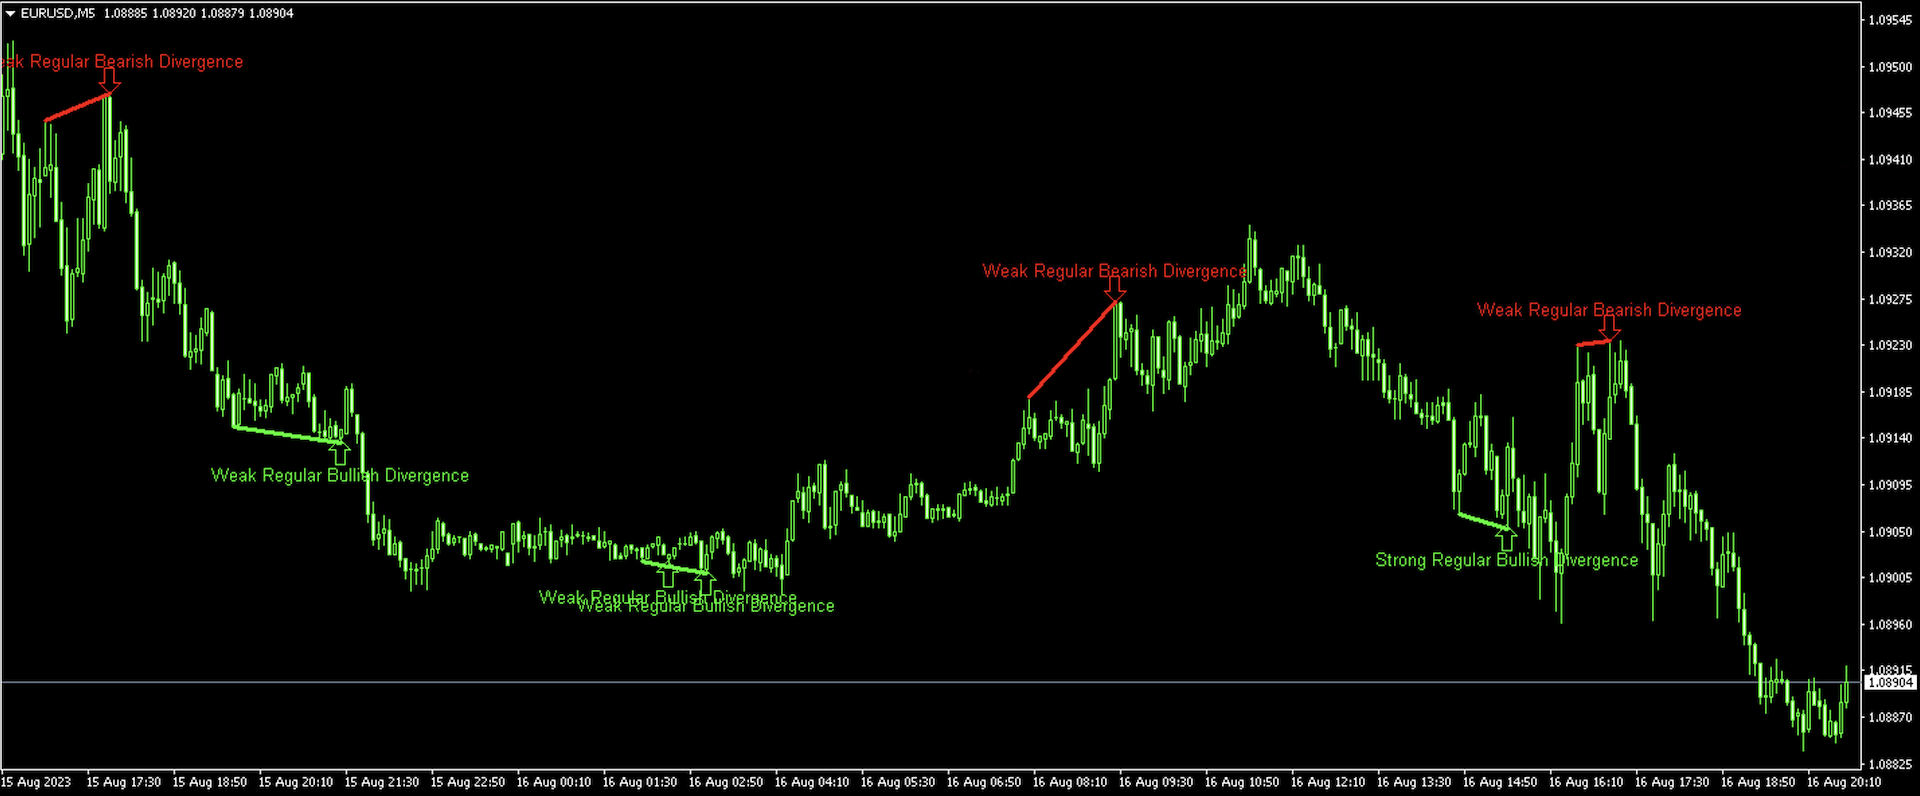
Detecção Automática: O indicador examina o gráfico em busca de divergências do RSI e traça automaticamente setas para sinalizar possíveis oportunidades de negociação. Sinais de Compra e Venda: Seta Verde para Cima: Sugere uma potencial oportunidade de compra com base na divergência altista do RSI. Seta Vermelha para Baixo: Sugere uma potencial oportunidade de venda com base na divergência baixista do RSI. Identificação da Força da Divergência: O indicador diferencia entre divergências fracas e fortes, proporcionando aos traders uma visão mais aprofundada. Divergência Forte: Representada por uma seta em negrito. Divergência Fraca: Representada por uma seta mais suave. Notificações Móveis: Uma funcionalidade integrada de notificação móvel garante que você nunca perca um sinal de negociação potencial, mesmo em movimento. Quando uma divergência é detectada, o indicador envia uma notificação push para o seu dispositivo móvel. Configurações Personalizáveis: Os usuários podem ajustar o período do RSI, níveis de sobrecompra e sobrevenda, e outras configurações para adaptar o indicador ao seu estilo e preferências de negociação.
Como Funciona:
Divergência Altista (Sinal de Compra): Ocorre quando o preço forma um novo mínimo mais baixo, mas o RSI forma um mínimo mais alto. Esta discrepância pode indicar uma potencial reversão para cima. Divergência Baixista (Sinal de Venda): Ocorre quando o preço forma um novo pico mais alto, mas o RSI forma um pico mais baixo. Esta discrepância pode indicar uma potencial reversão para baixo. Força da Divergência: A distinção entre divergências fracas e fortes baseia-se na diferença entre os picos/vales do preço e do RSI. Uma maior discrepância indica uma divergência forte, enquanto uma menor indica uma divergência fraca.
Casos de Uso:
Identificação de Tendência: Os traders podem usar as divergências do RSI para identificar inícios ou fins potenciais de tendências. Gestão de Riscos: Ao reconhecer possíveis reversões, os traders podem ajustar os níveis de stop-loss e take-profit de acordo. Integração de Estratégia: O Indicador de Divergência RSI pode ser integrado a outras estratégias de negociação para fornecer camadas adicionais de confirmação.
Nota:
Negociar com base apenas em divergências pode ser arriscado. É crucial usar outras ferramentas e métodos de análise técnica para confirmação.