Reverse Candle MT4
- Utilitários
- Mahsa Farjami
- Versão: 1.0
- Ativações: 5
Uso Geral:
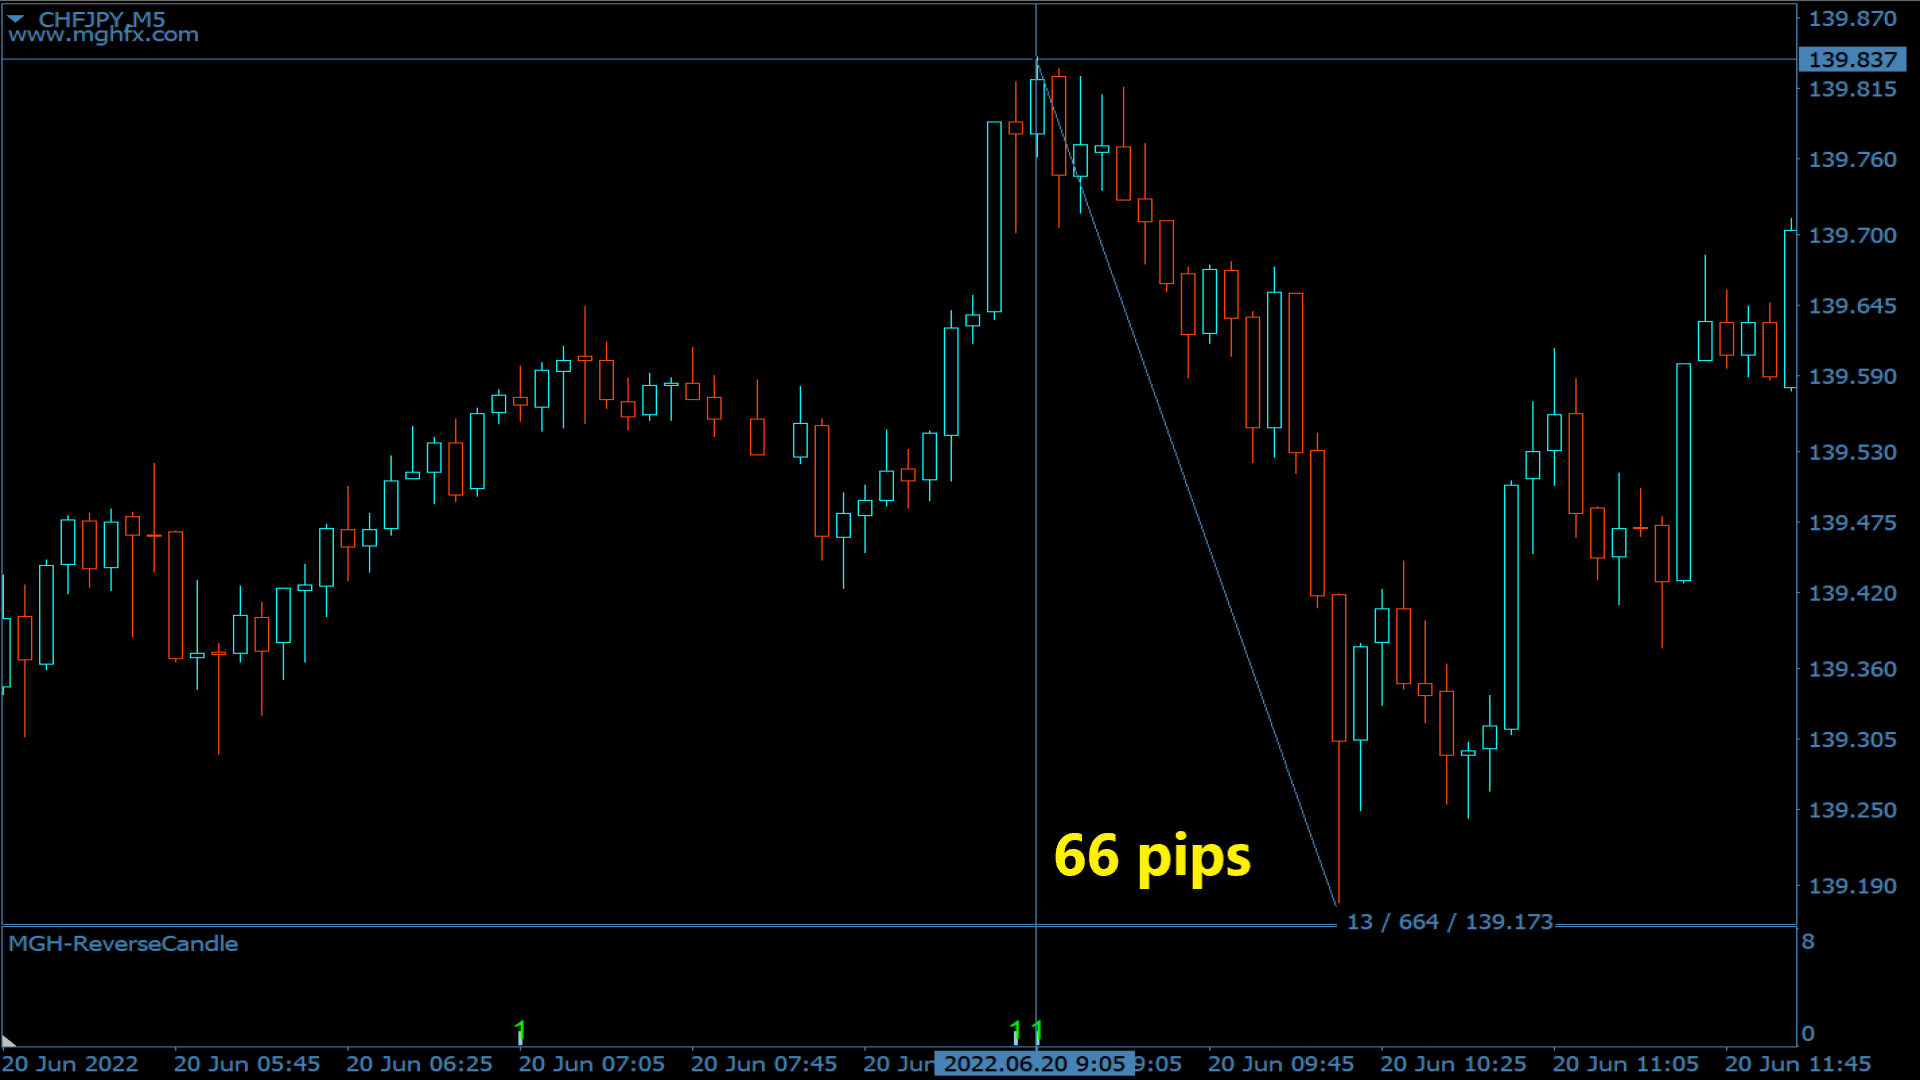
Você pode usar este indicador como uma confirmação confiável para sistemas de reversão e também como um poderoso sistema de negociação independente. Ele permite que você analise a probabilidade de uma reversão quando o preço encontra cada ponto de pivô ou nível de suporte/resistência. Ele desempenha um papel semelhante à divergência ou freios de continuação de tendência. A relação risco-recompensa desta ferramenta é de pelo menos 1 para 2 e, no melhor cenário, com trailing adequado, pode chegar a 1 para 10.
Versão MT5
Benefícios:
• Aumenta a taxa de sucesso.
• Um excelente complemento para uma abordagem de negociação ou uma estratégia auto-suficiente.
• Sinais para qualquer direção (para cima, para baixo ou lateral).
• Multi-timeframe.
• Sem repintura.
• Código leve e otimizado.
• Alertas por telefone, e-mail, som e visual.
• Pode ser aplicado a quaisquer ativos financeiros.
• Para especialistas e iniciantes.
Como esta ferramenta funciona:
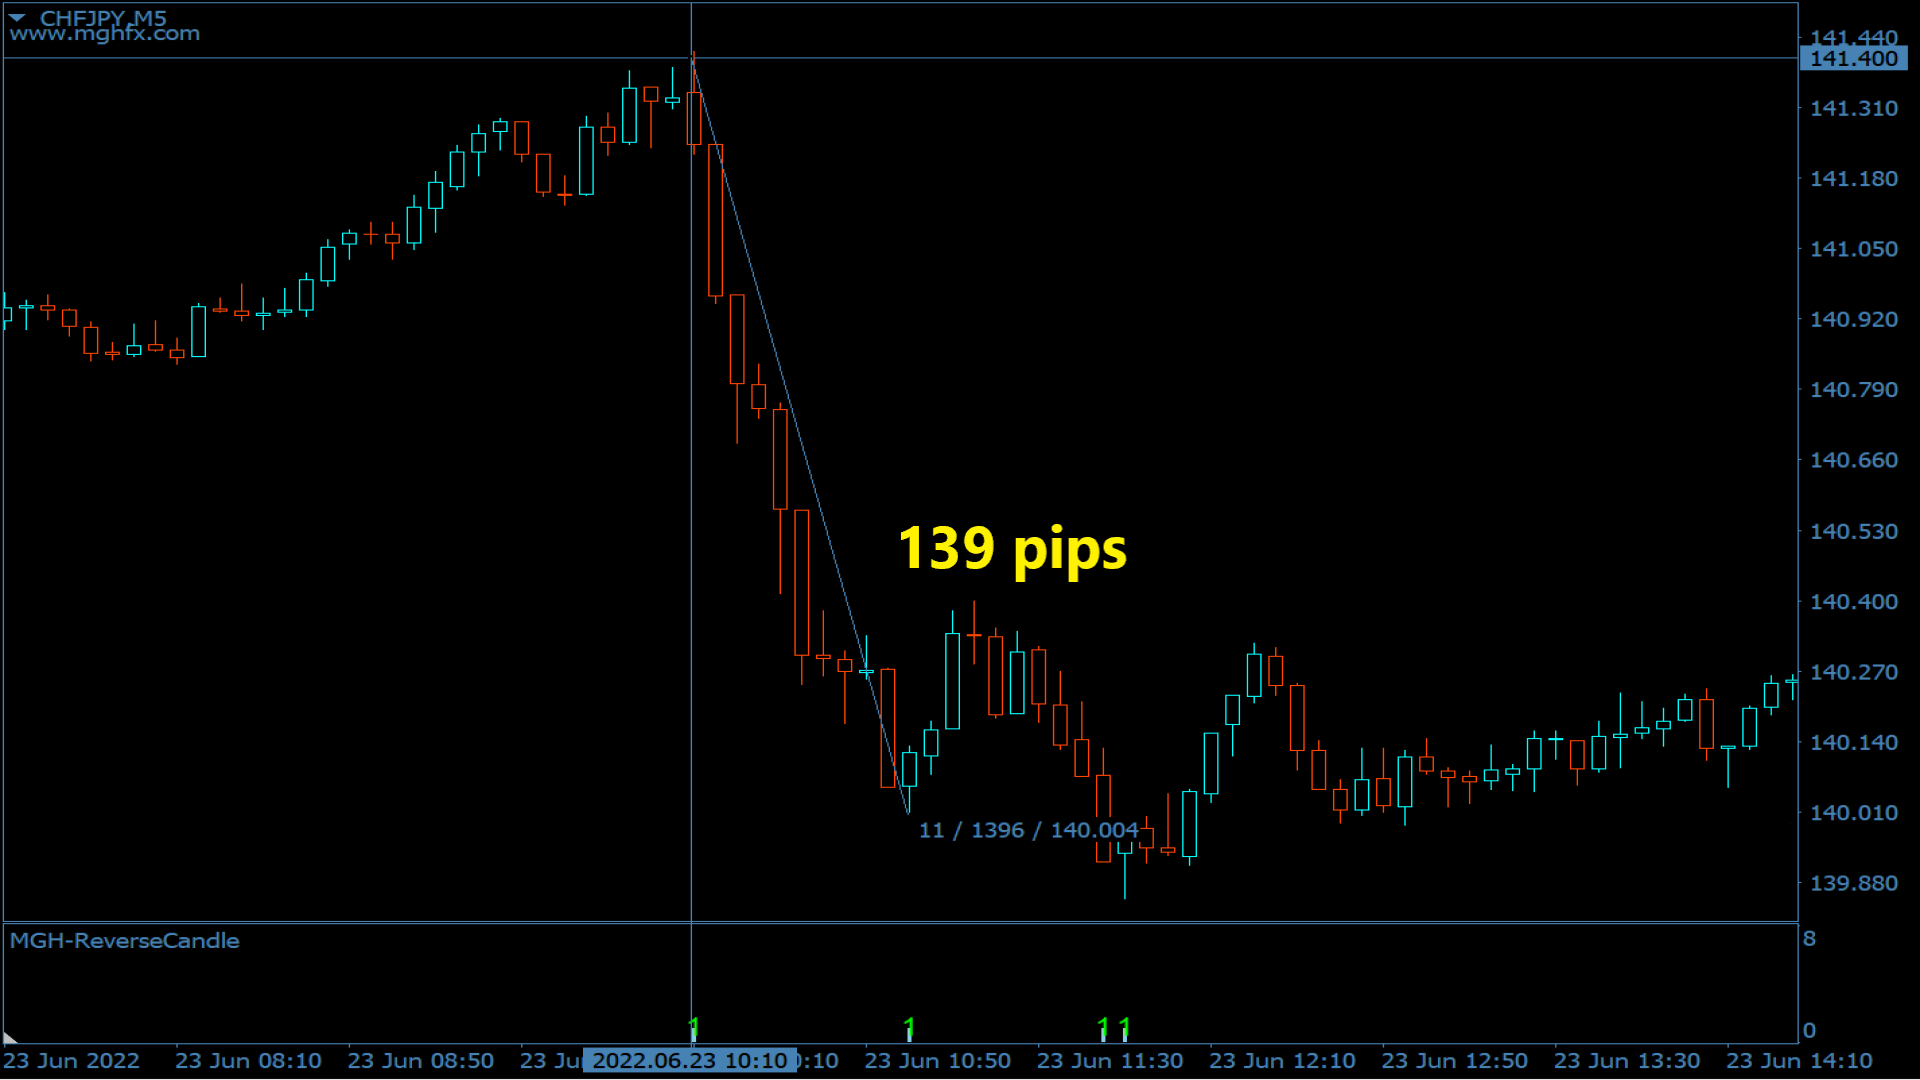
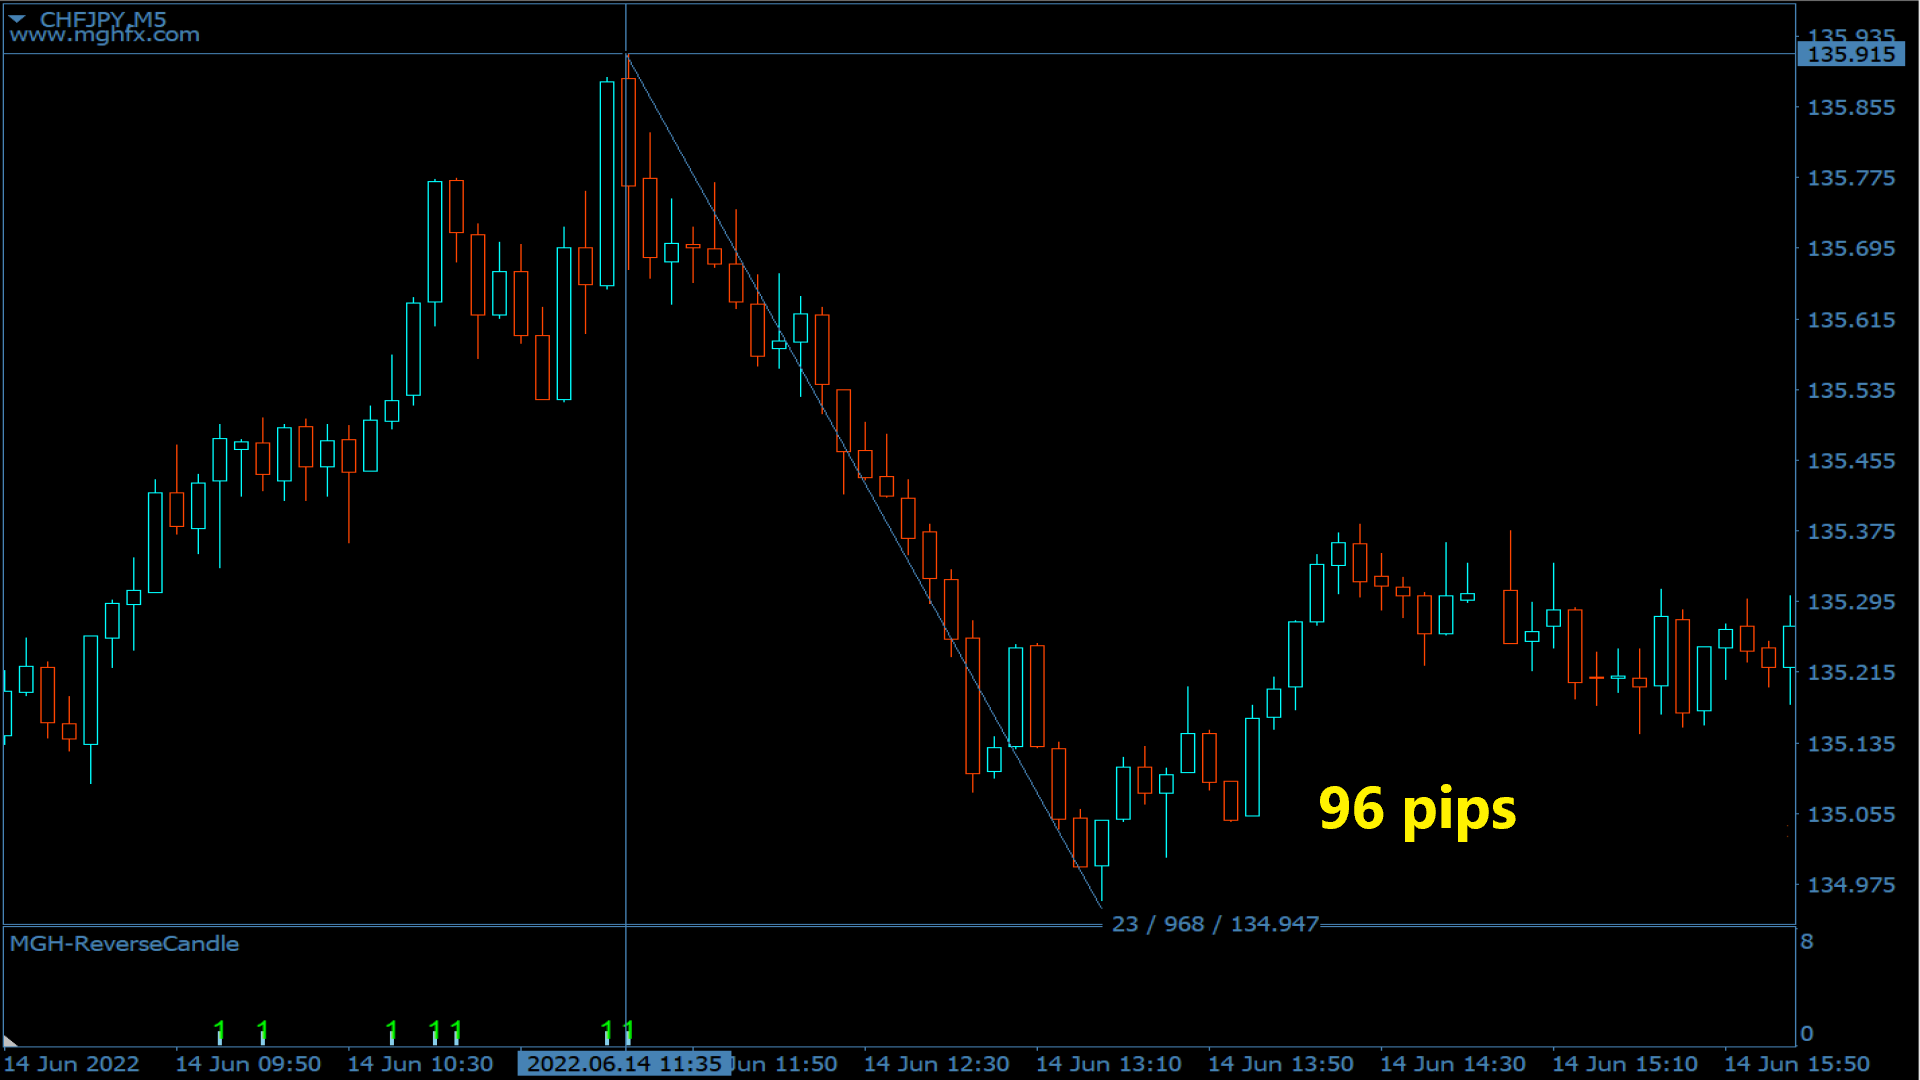
Ela recebe como entrada números mágicos (por exemplo, 9, 26, 52 etc.) e realiza uma análise de vários timeframes com base nas nuvens Ichimoku. Ela atribui uma pontuação específica a cada vela com base em sua força de reversão. Quanto maior a pontuação, maior a probabilidade de uma reversão.
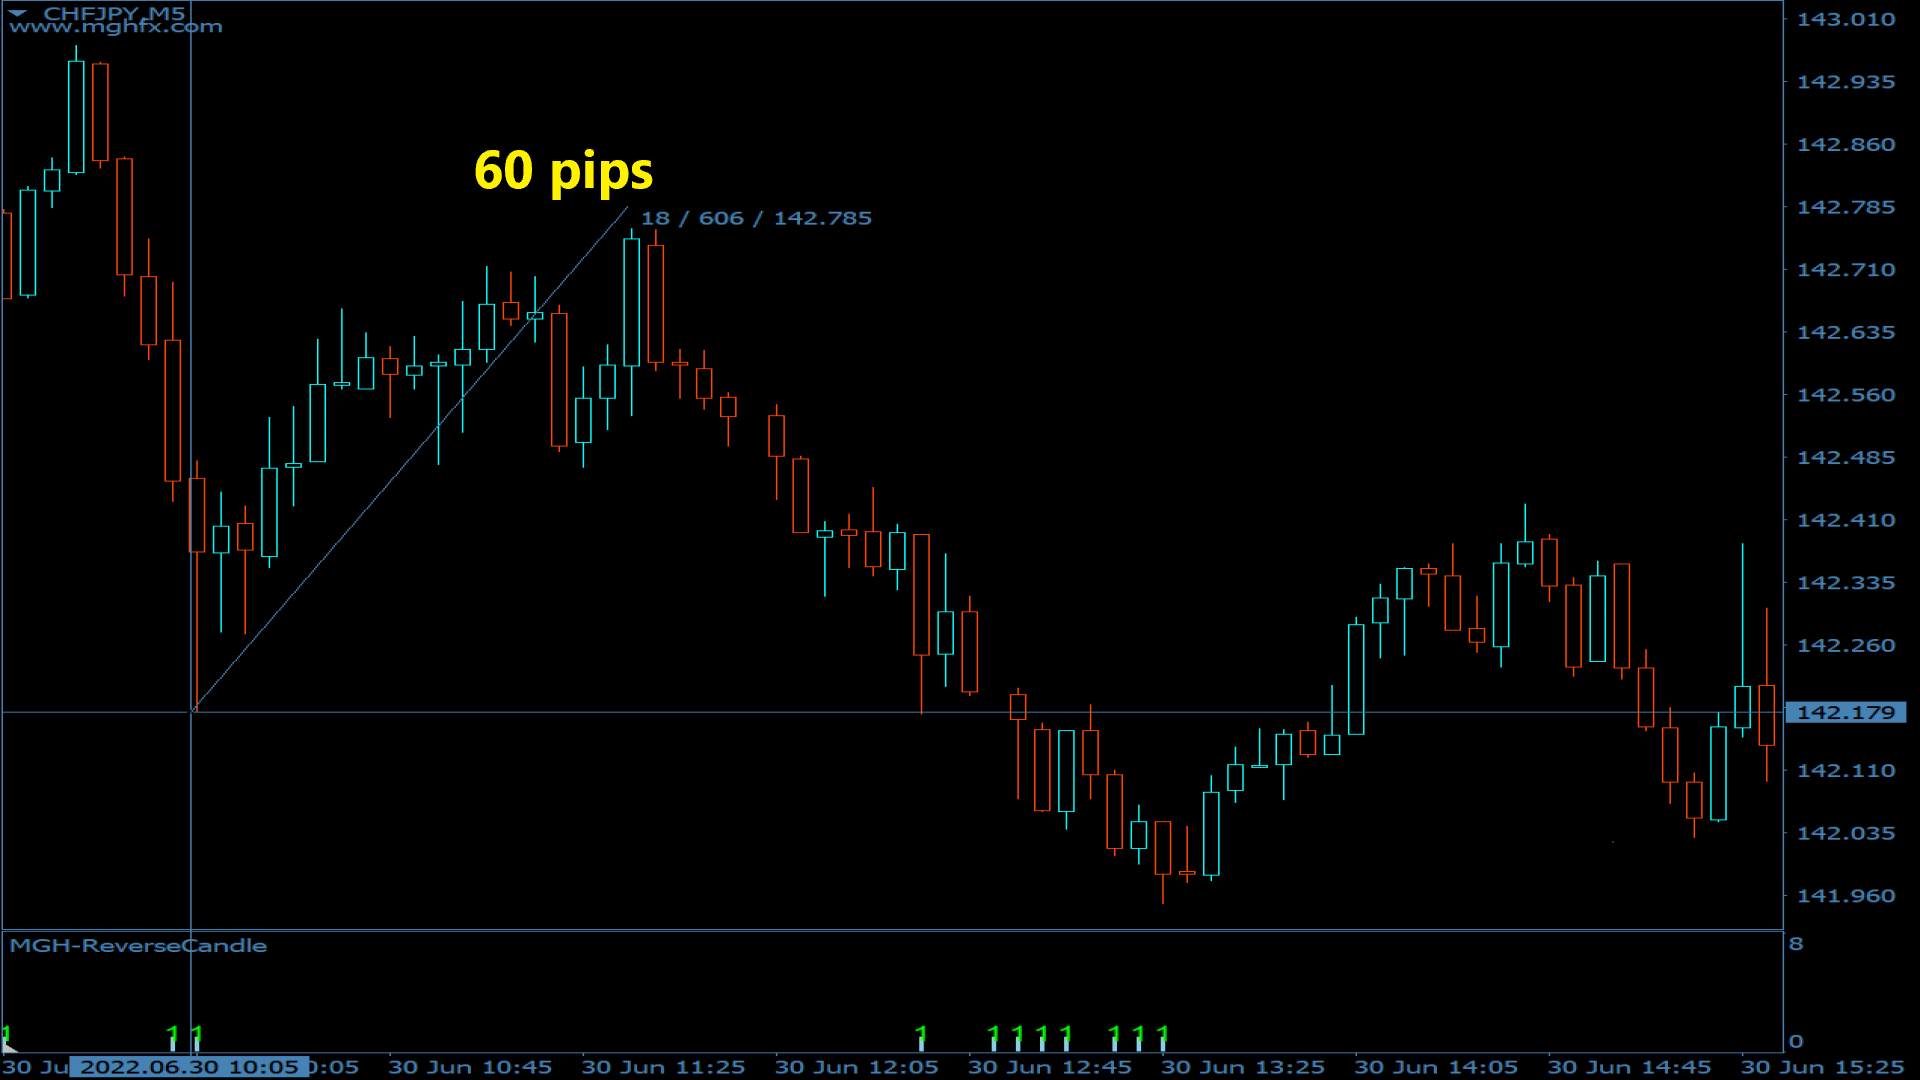
A estratégia para esta ferramenta, que é aplicável nos timeframes de 1 minuto e 5 minutos, envolve adicionar uma simples Tenkan-sen (média móvel de 9 períodos) ao gráfico e, no timeframe de 1 minuto, procurar um histograma com um valor de 6 ou, no timeframe de 5 minutos, procurar um histograma com um valor de 5. Um valor de 5 indica que as condições para uma reversão foram atendidas no timeframe atual e nos quatro timeframes superiores. Por exemplo, se você ver o número 5 no timeframe de 1 minuto, isso significa que a reversão pode levar uma ou duas velas horárias para ocorrer.
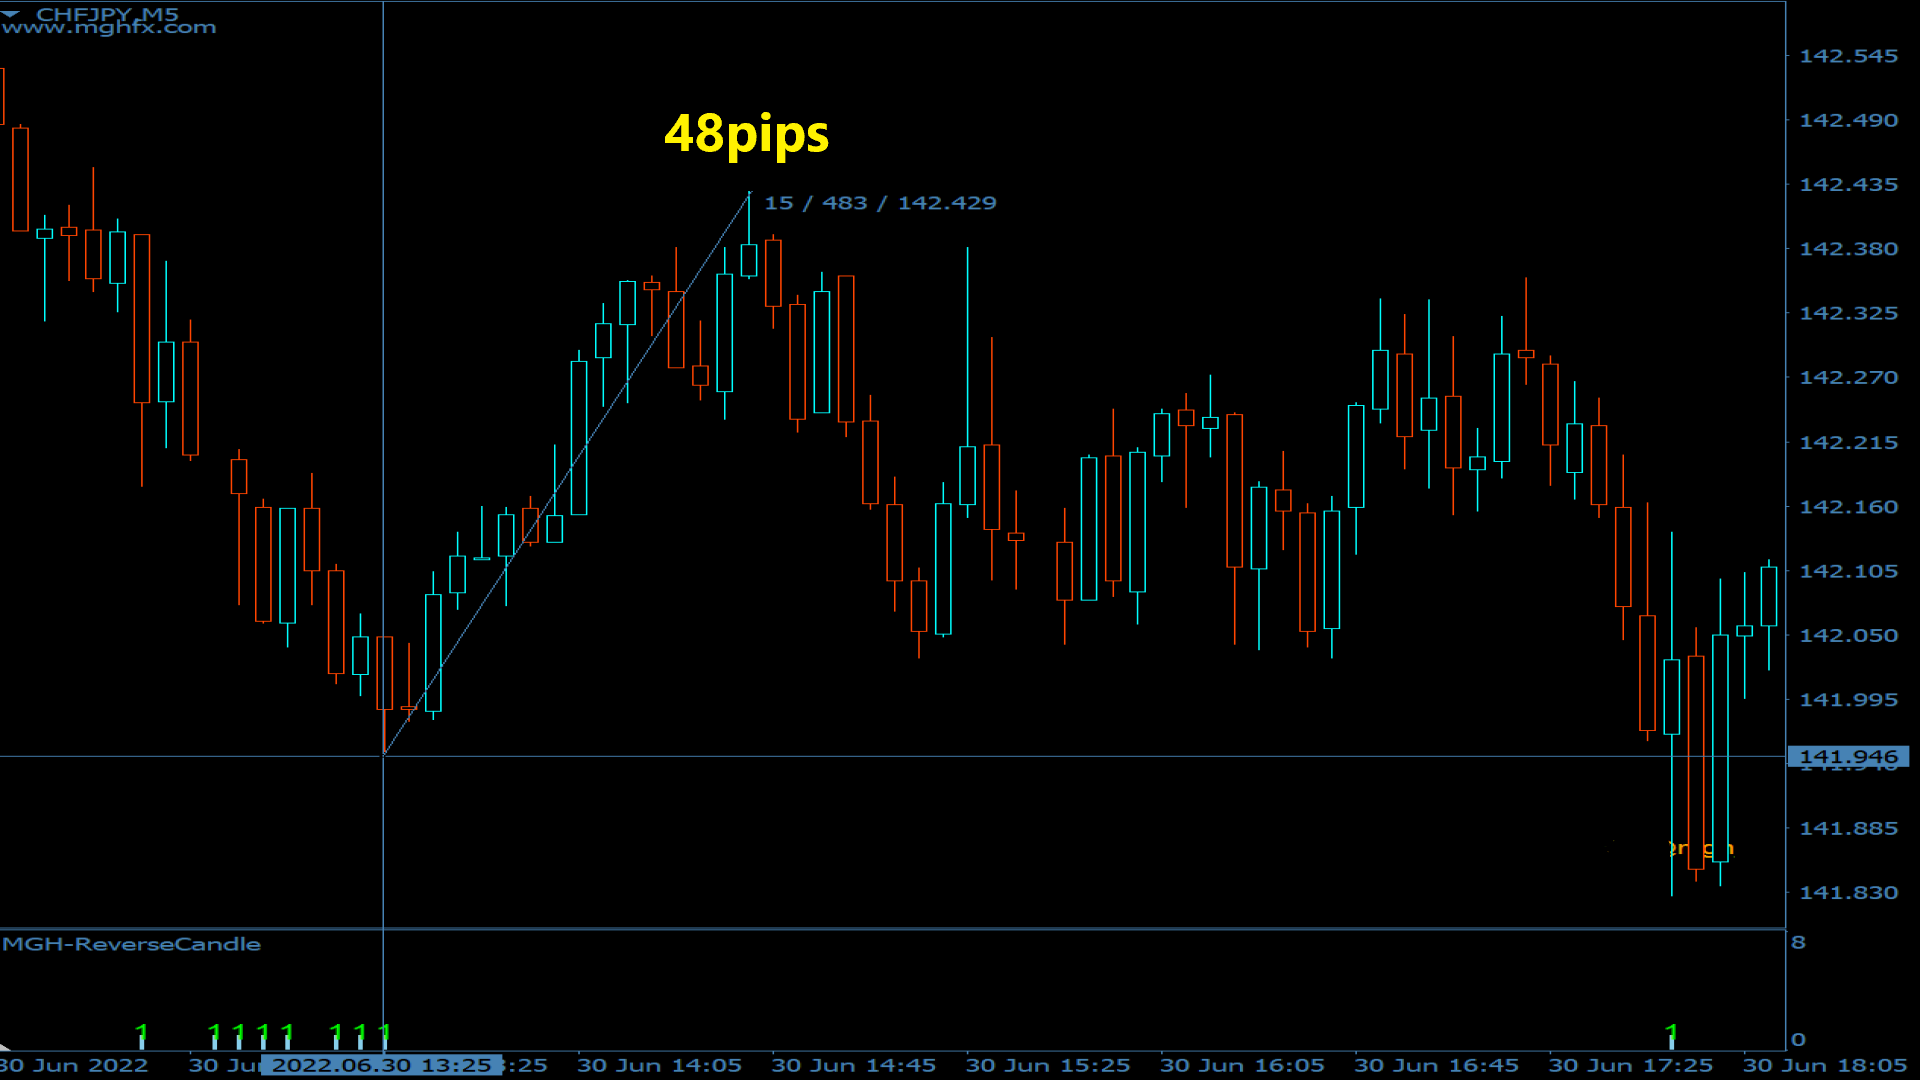
Cada número corresponde a um timeframe específico. Por exemplo, sempre que você vir o número 1, significa que as condições de reversão de acordo com os números Ichimoku foram atendidas no timeframe atual. Da mesma forma, se você encontrar o número 2, isso indica que as condições foram atendidas no timeframe atual e em um timeframe superior, e assim por diante. Por exemplo, o número 5 significa que o evento ocorreu do timeframe atual até quatro timeframes superiores.
Quais são os pontos ideais de entrada?
• Essa ferramenta funciona com maior precisão quando o mercado está em um intervalo de negociação em timeframes superiores. Os timeframes adequados para estratégias de reversão são de 15 minutos a 1 hora, enquanto para estratégias de tendência são de 1 hora e 5 minutos.
• Nas estratégias de reversão, a melhor maneira de usar essa ferramenta é combiná-la com níveis de suporte e resistência. Se os números gerados correspondem a fundos ou topos, ela funciona com muita precisão e força.
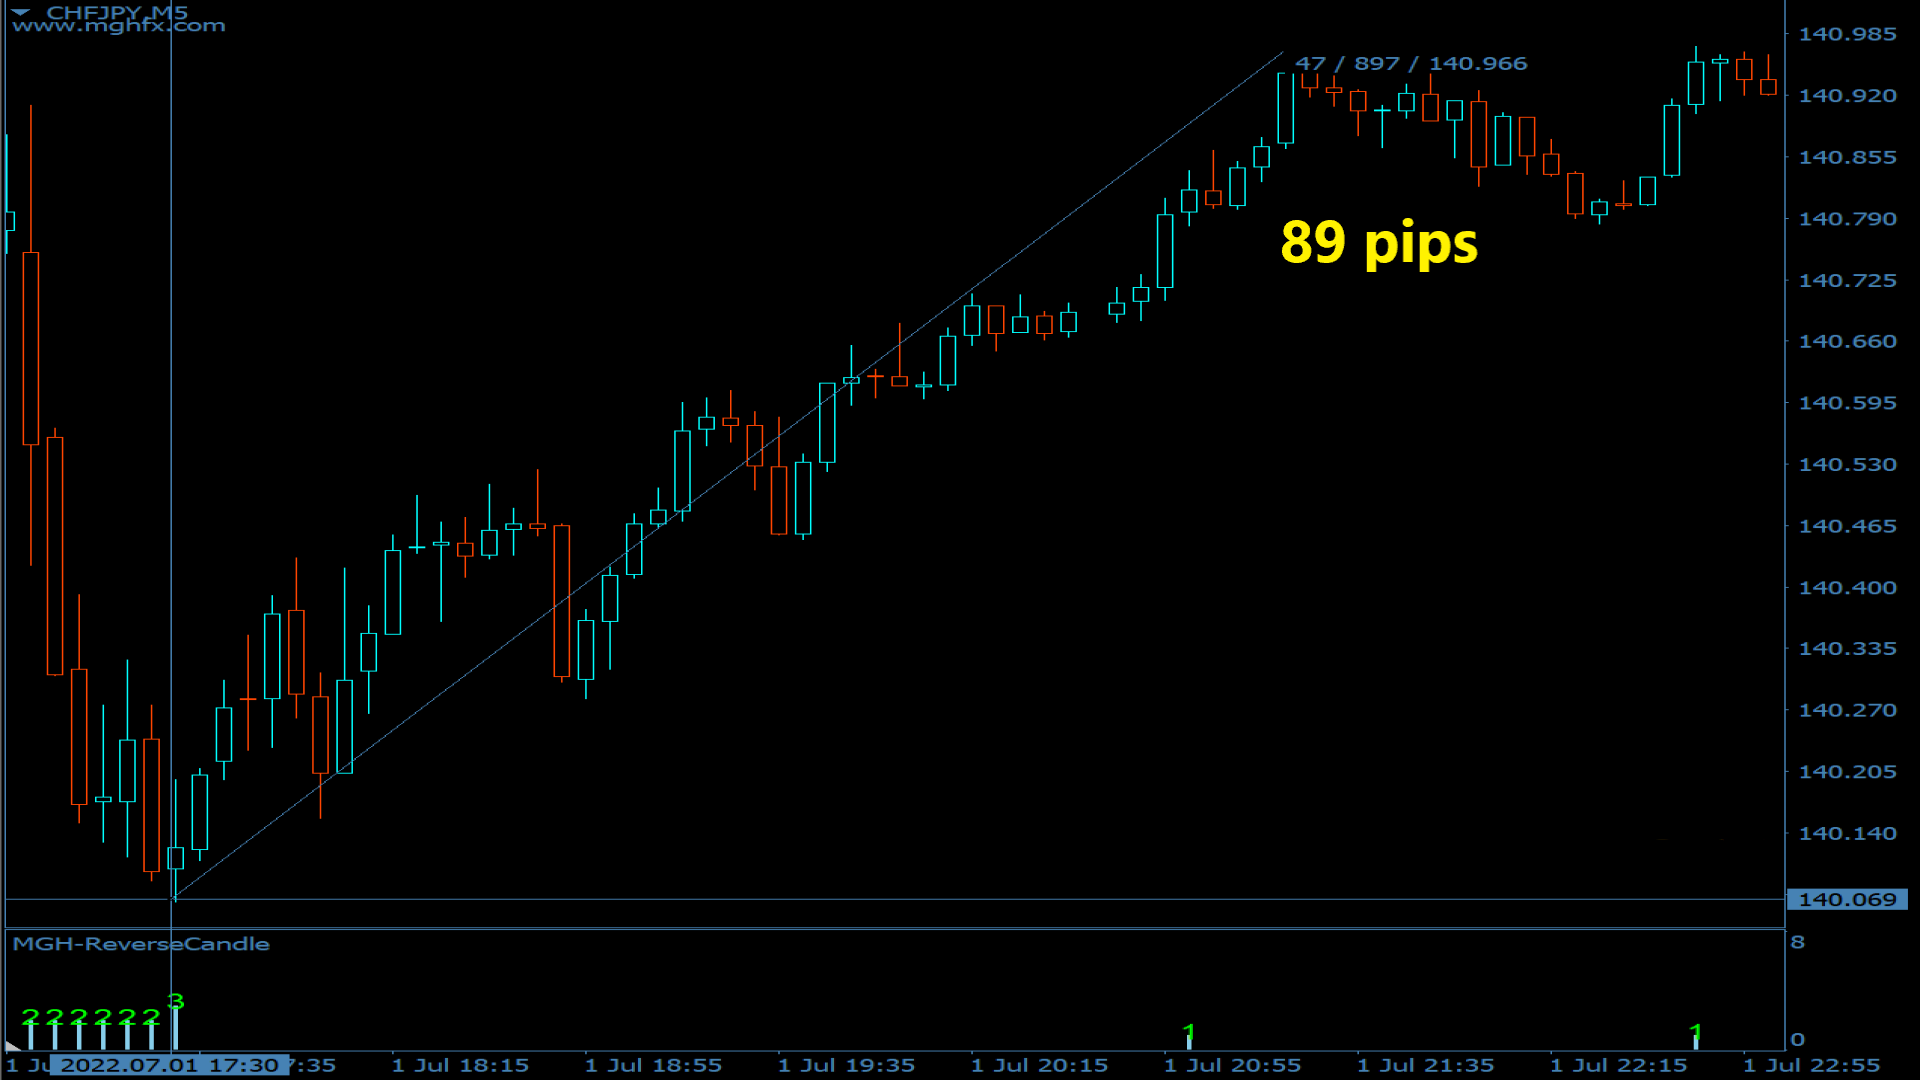
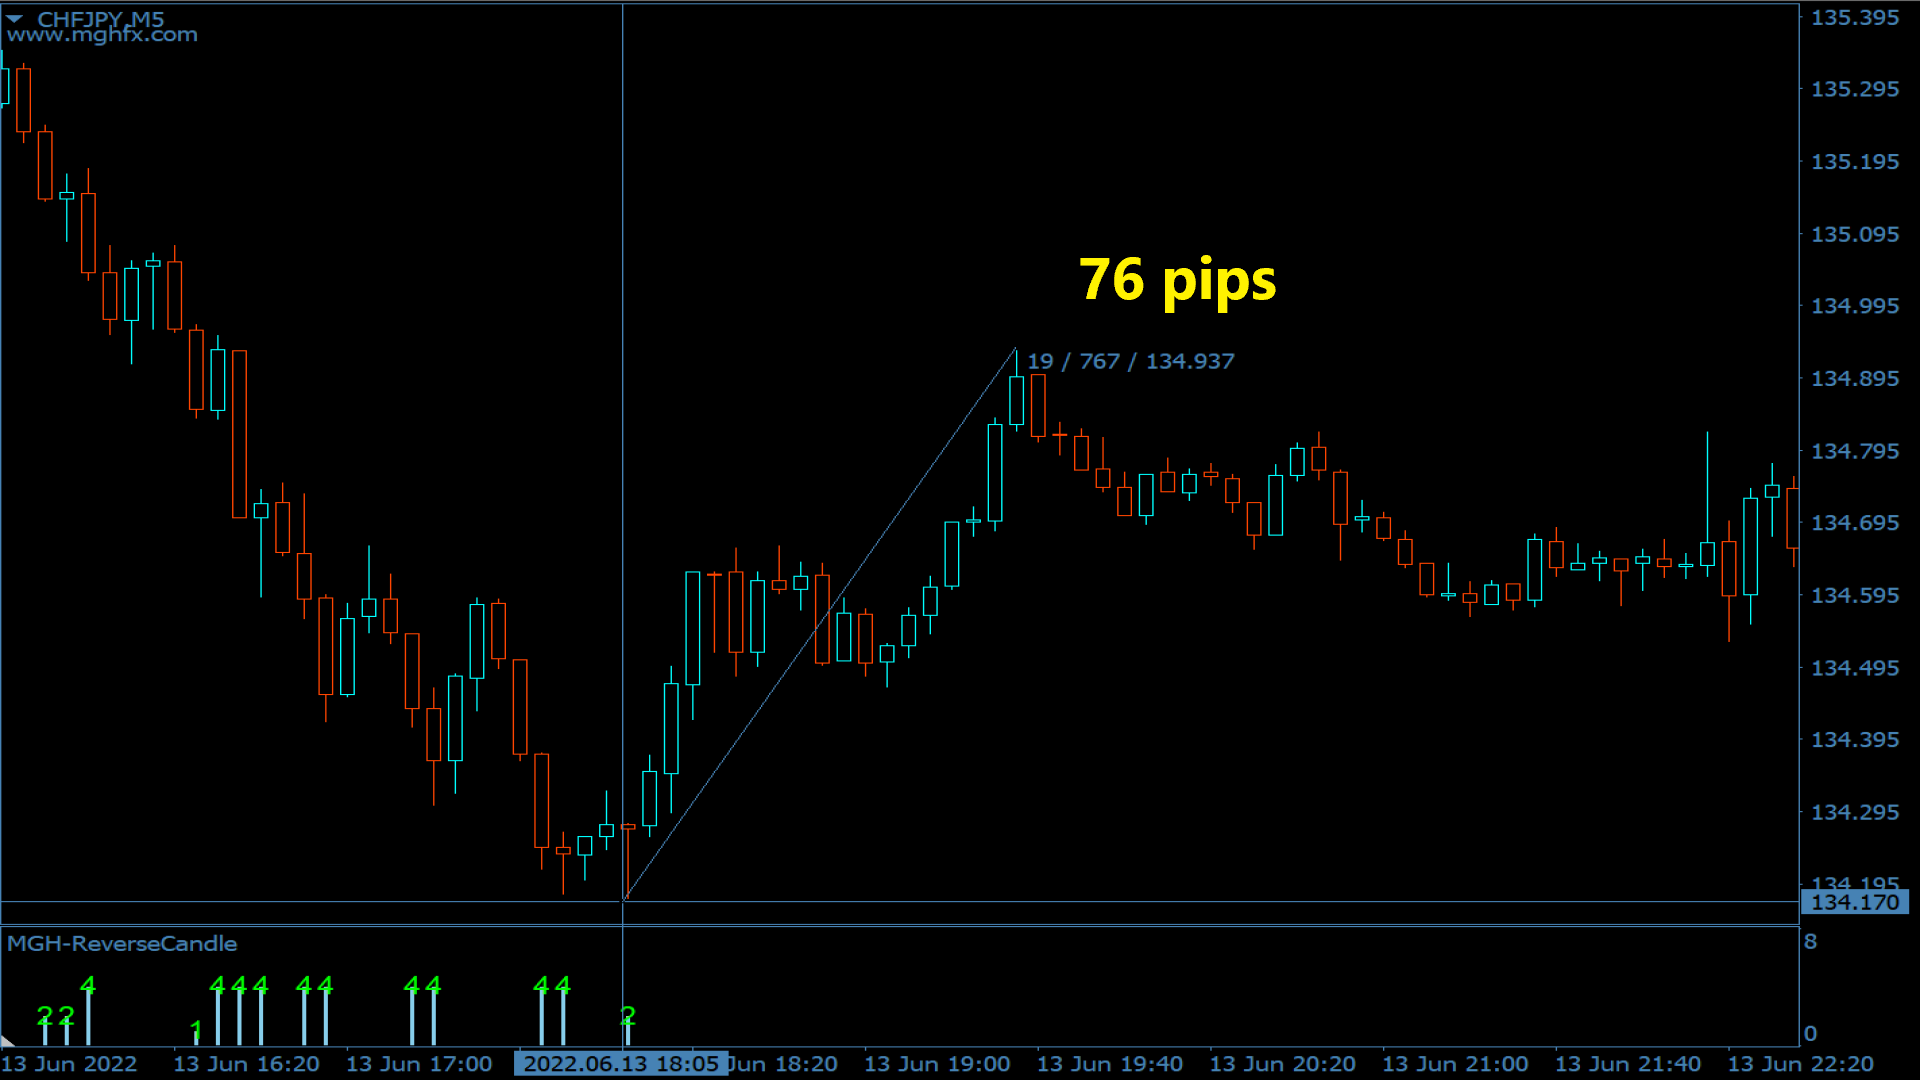
• Se uma forte tendência se forma em timeframes superiores e os números se repetem, é melhor usar estratégias de tendência. Nesses casos, você pode simplesmente abrir esse indicador no timeframe de 1 ou 5 minutos e entrar na direção da tendência principal após pequenas correções, observando o valor 1 no final dessas correções.
Pontos importantes:
• Um ponto crucial a ser observado é que até que a vela abaixo da Tenkan-sen seja fechada, não deve haver pavios nos histo-candles causados por velas subsequentes. Após o fechamento da vela, mova o stop loss acima do histo-candle e feche uma parte da posição em uma relação risco-recompensa de 1 para 1, mantendo o trailing para o restante.
• Outro ponto importante é que a vela precisa de reversão pode às vezes ser adiada em uma ou duas velas. Portanto, se você ver o número 5 no timeframe de 1 minuto, porque o número 5 está associado ao timeframe de 1 hora, a reversão pode levar aproximadamente uma ou duas velas horárias para ocorrer.
• Uma variação deste indicador também pode ser usada para reconhecer divergências, onde o número atual diminui em comparação com o número anterior.
• Uma nota final é que este indicador não é uma ferramenta estratégica, mas uma ferramenta prática, e pode ser usada como uma confirmação suplementar para outras tendências ou estratégias de reversão.
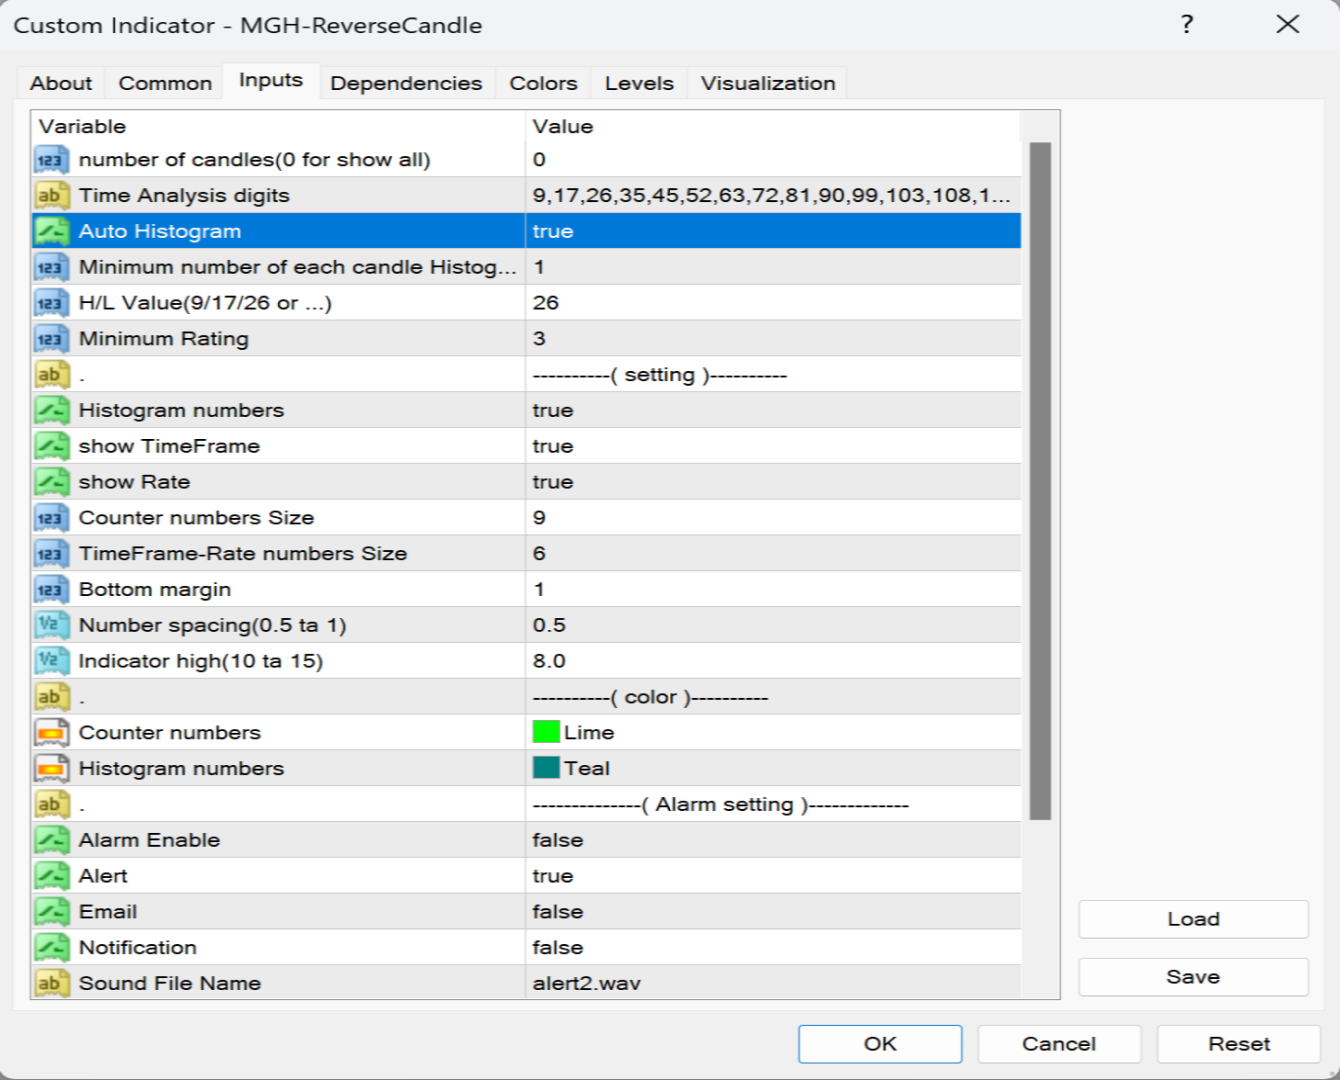
Configurações:
Há um item chamado "Exibição Inteligente da Contagem do Histograma". Se estiver ativado, ele mostra apenas histogramas com fortes probabilidades de reversão.
Se você está usando essa ferramenta como uma ferramenta estratégica independente, é melhor tê-la ativada. No entanto, se você está usando esse indicador como uma confirmação para seu sistema de negociação, é melhor tê-lo desativado.
Você também pode determinar a potência mínima do histo exibível para o próximo item.
Para qualquer dúvida relacionada à compra, instalação e uso do indicador - envie uma mensagem privada, por favor.
Para um guia estendido e bônus, entre em contato comigo através de mensagens privadas após a compra do indicador!
Você pode usar este indicador como uma confirmação confiável para sistemas de reversão e também como um poderoso sistema de negociação independente. Ele permite que você analise a probabilidade de uma reversão quando o preço encontra cada ponto de pivô ou nível de suporte/resistência. Ele desempenha um papel semelhante à divergência ou freios de continuação de tendência. A relação risco-recompensa desta ferramenta é de pelo menos 1 para 2 e, no melhor cenário, com trailing adequado, pode chegar a 1 para 10.
Versão MT5
Benefícios:
• Aumenta a taxa de sucesso.
• Um excelente complemento para uma abordagem de negociação ou uma estratégia auto-suficiente.
• Sinais para qualquer direção (para cima, para baixo ou lateral).
• Multi-timeframe.
• Sem repintura.
• Código leve e otimizado.
• Alertas por telefone, e-mail, som e visual.
• Pode ser aplicado a quaisquer ativos financeiros.
• Para especialistas e iniciantes.
Como esta ferramenta funciona:
Ela recebe como entrada números mágicos (por exemplo, 9, 26, 52 etc.) e realiza uma análise de vários timeframes com base nas nuvens Ichimoku. Ela atribui uma pontuação específica a cada vela com base em sua força de reversão. Quanto maior a pontuação, maior a probabilidade de uma reversão.
A estratégia para esta ferramenta, que é aplicável nos timeframes de 1 minuto e 5 minutos, envolve adicionar uma simples Tenkan-sen (média móvel de 9 períodos) ao gráfico e, no timeframe de 1 minuto, procurar um histograma com um valor de 6 ou, no timeframe de 5 minutos, procurar um histograma com um valor de 5. Um valor de 5 indica que as condições para uma reversão foram atendidas no timeframe atual e nos quatro timeframes superiores. Por exemplo, se você ver o número 5 no timeframe de 1 minuto, isso significa que a reversão pode levar uma ou duas velas horárias para ocorrer.
Cada número corresponde a um timeframe específico. Por exemplo, sempre que você vir o número 1, significa que as condições de reversão de acordo com os números Ichimoku foram atendidas no timeframe atual. Da mesma forma, se você encontrar o número 2, isso indica que as condições foram atendidas no timeframe atual e em um timeframe superior, e assim por diante. Por exemplo, o número 5 significa que o evento ocorreu do timeframe atual até quatro timeframes superiores.
Quais são os pontos ideais de entrada?
• Essa ferramenta funciona com maior precisão quando o mercado está em um intervalo de negociação em timeframes superiores. Os timeframes adequados para estratégias de reversão são de 15 minutos a 1 hora, enquanto para estratégias de tendência são de 1 hora e 5 minutos.
• Nas estratégias de reversão, a melhor maneira de usar essa ferramenta é combiná-la com níveis de suporte e resistência. Se os números gerados correspondem a fundos ou topos, ela funciona com muita precisão e força.
• Se uma forte tendência se forma em timeframes superiores e os números se repetem, é melhor usar estratégias de tendência. Nesses casos, você pode simplesmente abrir esse indicador no timeframe de 1 ou 5 minutos e entrar na direção da tendência principal após pequenas correções, observando o valor 1 no final dessas correções.
Pontos importantes:
• Um ponto crucial a ser observado é que até que a vela abaixo da Tenkan-sen seja fechada, não deve haver pavios nos histo-candles causados por velas subsequentes. Após o fechamento da vela, mova o stop loss acima do histo-candle e feche uma parte da posição em uma relação risco-recompensa de 1 para 1, mantendo o trailing para o restante.
• Outro ponto importante é que a vela precisa de reversão pode às vezes ser adiada em uma ou duas velas. Portanto, se você ver o número 5 no timeframe de 1 minuto, porque o número 5 está associado ao timeframe de 1 hora, a reversão pode levar aproximadamente uma ou duas velas horárias para ocorrer.
• Uma variação deste indicador também pode ser usada para reconhecer divergências, onde o número atual diminui em comparação com o número anterior.
• Uma nota final é que este indicador não é uma ferramenta estratégica, mas uma ferramenta prática, e pode ser usada como uma confirmação suplementar para outras tendências ou estratégias de reversão.
Configurações:
Há um item chamado "Exibição Inteligente da Contagem do Histograma". Se estiver ativado, ele mostra apenas histogramas com fortes probabilidades de reversão.
Se você está usando essa ferramenta como uma ferramenta estratégica independente, é melhor tê-la ativada. No entanto, se você está usando esse indicador como uma confirmação para seu sistema de negociação, é melhor tê-lo desativado.
Você também pode determinar a potência mínima do histo exibível para o próximo item.
Para qualquer dúvida relacionada à compra, instalação e uso do indicador - envie uma mensagem privada, por favor.
Para um guia estendido e bônus, entre em contato comigo através de mensagens privadas após a compra do indicador!

O usuário não deixou nenhum comentário para sua avaliação