• Visão global
  • Comentários
  • Discussão

Coral Notify Dash

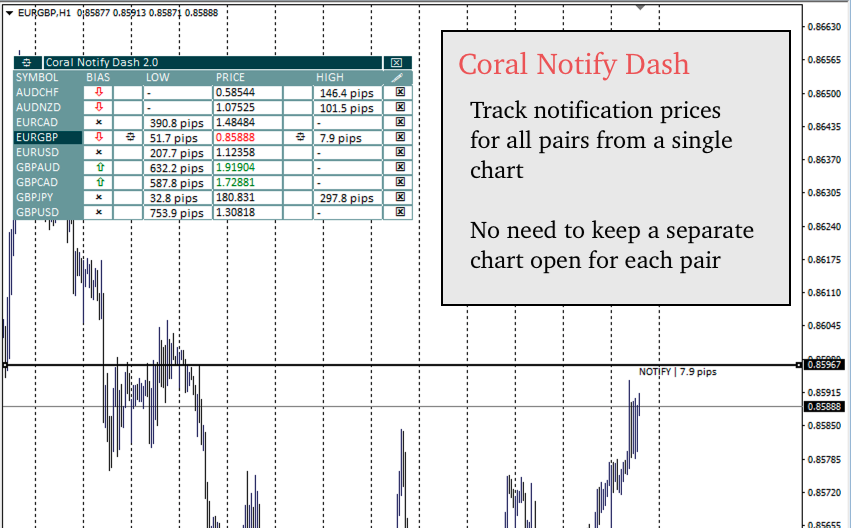
Coral Notify Dash allows you to manage all of your chart price-based notifications from a single consolidated dashboard.  It fills a gap left by MT4, which does not support popup alerts.  If you're like me and you often don't hear the alert sound for the built-in alerts, this is an indispensable tool.

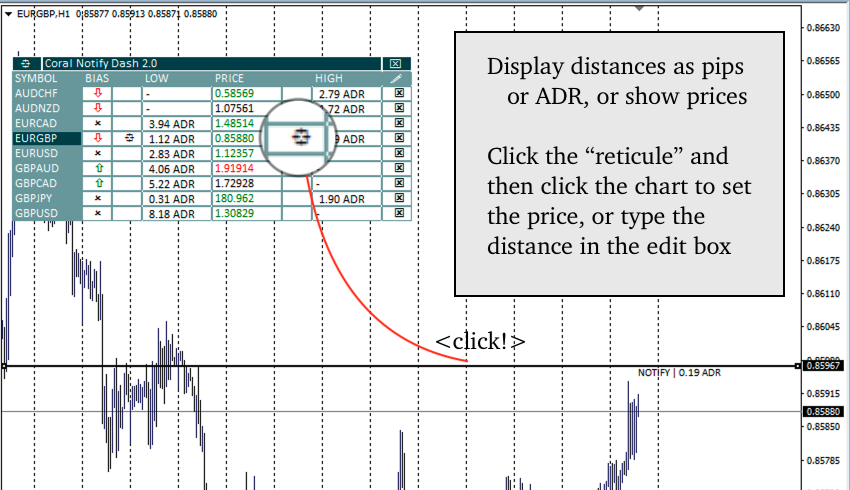
I use Coral Notify Dash as part of my daily chart analysis workflow.  I use a tool like Coral Dash (available for free, here) or one of the other dashboards to set my trading bias.  As I review the charts I decide where price needs to get to in order for me to consider a trade, and I add that symbol to the list of symbols in Notify Dash and set the price.  I can quickly set the price by clicking the "reticule" for the low or high price, and then clicking on the chart where I want the notification to be set.  I can then drag the notification line up and down as I like, and the price adjusts in the UI.

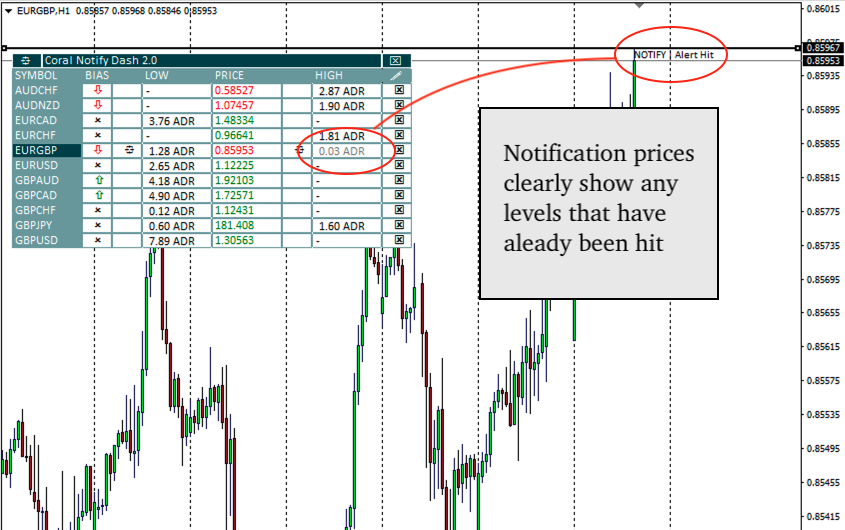
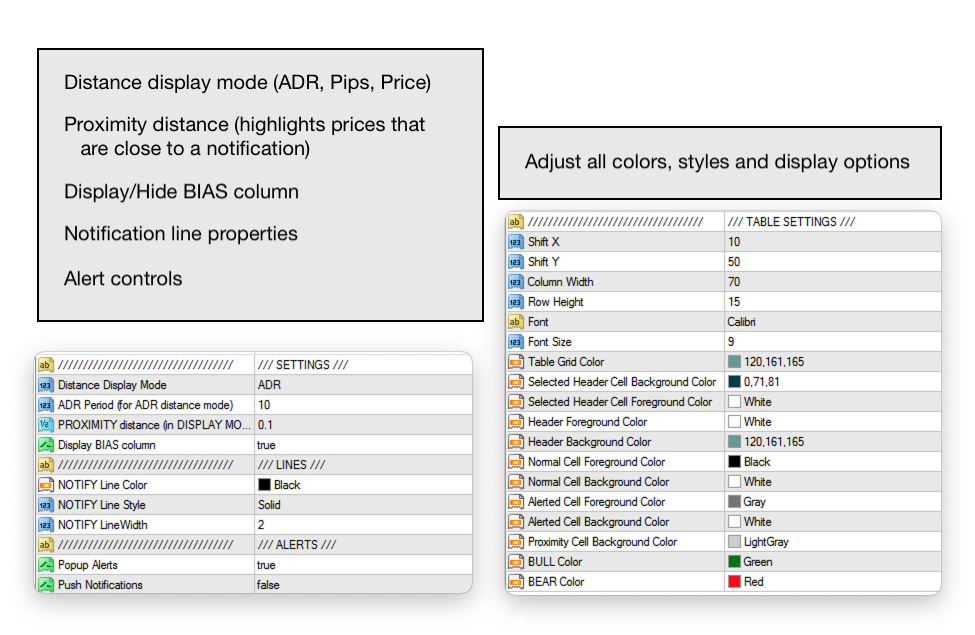
In the UI I can see all of the notifications that are set, and the distance to that price.  Distances can be shown either in ADR or pips, or as the price (rather than a distance).  You can also set a "proximity "distance, and the cell colors will highlight any notifications that are within that distance.  You can also see which alerts have already been hit from this dashboard; they are shown in different, configurable colors.

You can type a value directly into the dashboard for the current symbol, rather than clicking on the reticule.  The value you type in depends on the distance mode you've selected.  If the distance mode is "Price", then type in the price at which to be notified.  If the distance mode is ADR or Pips, then type in the distance to be notified in ADR or pips.  Coral Notify Dash will convert the distance into a price and draw the line on the chart at that price, and display that distance to the line in the window.

During my chart review and throughout the day, as I step through the list of charts that I'm monitoring, Notify Dash displays the lines for my alert levels for the selected chart.  This reminds me immediately of my prior analysis for this symbol, and where I was looking for price to reach for me to consider a trade.  I can see when price has already moved past my target, and which ones are close (within the proximity distance).  My chart review time is a fraction of what it used to be, because my analysis is captured in the notification levels and I can monitor them all from a single chart. 


Produtos recomendados
Indicator for binary options arrow is easy to use and does not require configuration works on all currency pairs, cryptocurrencies buy signal blue up arrow sell signal red down arrow tips do not trade during news and 15-30 minutes before their release, as the market is too volatile and there is a lot of noise it is worth entering trades one or two candles from the current period (recommended for 1 candle) timeframe up to m 15 recommended money management fixed lot or fixed percentage of the depo
TPO Profile MT4
Kyra Nickaline Watson-gordon
5 (1)
Definition : TPO is a Time Price Opportunity. Instead of using bars or candles with an Open, High, Low, and Close price, each "bar" in a Market Profile is represented by horizontal bars against the price It is called Market Profile terminology. In other words time-price-opportunity (TPO) profiles are histograms of how much time was spent at each price within the span of the profile. By using a TPO chart, you are able to analyze the amount of trading activity, based on time, for each price level
Awesome Oscillator by Bill Williams with the ability to fine-tune and replace the averaging algorithms of the indicator, which significantly expands the possibilities of using this oscillator in algorithmic trading and brings it closer in its properties to such an indicator as the MACD. To reduce price noise, the final indicator is processed with an additional Smooth averaging. The indicator has the ability to give alerts, send mail messages and push signals when the direction of movement of th
Um indicador técnico que calcula suas leituras nos volumes de negociação. Na forma de histograma, mostra o acúmulo da força do movimento do instrumento de negociação. Possui sistemas de cálculo independentes para direções de alta e baixa. Funciona em quaisquer instrumentos de negociação e prazos. Pode complementar qualquer sistema de negociação. O indicador não redesenha seus valores, os sinais aparecem na vela atual. É fácil de usar e não carrega o gráfico, não requer cálculos de parâmetros adi
Supply and Demand Indicator + FREE Currency Strength Meter ADD-ON Looking for a powerful tool that can help you identify the most reactive zones in the forex market? Our supply and demand indicator for MetaTrader 4 and 5 is exactly what you need. With its advanced algorithms and real-time analysis, this indicator helps traders of all experience levels make informed trading decisions. The supply and demand indicator is a cutting-edge tool that helps traders identify areas where buyers and seller
Indicador Crypto_Forex "CHANNEL of FRACTALS" para MT4. - Este indicador mostra linhas de tendência locais reais com base em máximas/mínimas de fractais. - Ótimo para traders que usam análise gráfica. - Linhas de tendência locais de resistência - cor vermelha. - Linhas de tendência locais de suporte - cor azul. - Possui poucos parâmetros responsáveis ​​pelo número de fractais, cores e largura das linhas de tendência. - O indicador é ótimo para detectar as condições atuais do mercado: - Condição
A singularidade deste indicador reside no algoritmo de contabilidade de volume: a acumulação ocorre diretamente para o período selecionado sem referência ao início do dia. As últimas barras podem ser excluídas do cálculo, então os dados atuais terão menos influência sobre os níveis significativos (volumes) formados anteriormente. Para um cálculo mais preciso, os dados do gráfico M1 são usados por padrão. A etapa de distribuição dos volumes de preços é regulamentada. Por padrão, a borda direita d
Introduction It is common practice for professional trades to hide their stop loss / take profit from their brokers. Either from keeping their strategy to the themselves or from the fear that their broker works against them. Using this indicator, the stop loss / take profit points will be drawn on the product chart using the bid price. So, you can see exactly when the price is hit and close it manually.  Usage Once attached to the chart, the indicator scans the open orders to attach lines for t
Ugenesys AI MT4
Odaine Ramon Mcmillan
5 (1)
uGenesys AI - 90% Accurate Daytrading Indicator Introducing the ultimate forex trading indicator system, uGenesys AI, powered by cutting-edge AI technology and advanced analytical techniques, including Time-Series Analysis and Genetic Algorithms. Our AI-powered trading system leverages the power of time-series analysis to identify trends and patterns in historical price data, allowing traders to make informed predictions about future market movements. By analyzing vast amounts of data, our syst
Trade History Drawer
David Leander Tschacher
Trade History Drawer is an indicator for MetaTrader 4. It shows trades on the chart and draws them in customized colors. Furthermore, the indicator shows a trade summary and saves a CSV history file for either one selected pair or all pairs. Inputs General Settings Number Trades : Number of trades to be drawn on the chart, if -1 then all trades Magic Number : Only trades with this magic number, if -1 then ignore Line Style : Line Style Line Thickness : Line Thickness Arrow Size : Arrow Size
This is a new strategy for SUPPLY DEMAND areas It is based on a calculation using the tick volume to detect the big price action in market for both bear /bull actions this smart volume action candles are used to determine the supply and demand areas prices in between main supply and demand lines indicate sideway market  up arrows will be shown when prices moves above the main supply and the secondary supply lines Down arrows will be shown when prices moves below the main demand and the secondary
We present you the indicator "Candle closing counter", which will become your indispensable assistant in the world of trading. That’s why knowing when the candle will close can help: If you like to trade using candle patterns, you will know when the candle will be closed. This indicator will allow you to check if a known pattern has formed and if there is a possibility of trading. The indicator will help you to prepare for market opening and market closure. You can set a timer to create a pre
KT Horizontal Lines MT4
KEENBASE SOFTWARE SOLUTIONS
In MetaTrader, plotting multiple   horizontal lines   and then tracking their respective price levels can be a hassle. This indicator automatically plots multiple horizontal lines at equal intervals for setting price alerts, plotting support and resistance levels, and other manual purposes. This indicator is suitable for Forex traders who are new and looking for chances to make quick profits from buying and selling. Horizontal lines can help traders find possible areas to start trading when the
Market Structure Zig Zag
Lesedi Oliver Seilane
4.63 (27)
Free Market structure zig zag to assist in price action trading the screenshots describe how to use and how to spot patterns new version comes with alerts, email alert and  push notification alert can be used on all pairs  can be used on all timeframes  you can add additional confirmation indicators the indicator shows you your higher high and low highs as well as your lower lows and lower highs  the indication makes price action analysis easier to spot.
FREE
Smart Market Structure Simple   is a powerful indicator that helps traders identify   market structure   based on the   Smart Money Concept (SMC) . This indicator automatically detects   Break of Structure (BOS), Change of Character (CHoCH), Fair Value Gaps (FVG), Order Blocks (OB), Liquidity Zones (LQZ),   and key swing points   Higher High (HH), Higher Low (HL), Lower High (LH), Lower Low (LL) .   Main Objective:   Assist traders in tracking institutional flow ( Smart Money ) and finding hi
Lisek Weis Wave
Darius Hans Lischka
5 (3)
This Weis Wave Volume indicator is a tool to help traders identify the current price trend.  Understanding volume can provide insight into a market's behavior to help you determine its overall health. The most important rule is this: volume precedes price. Typically, before a market price moves, volume comes into play. It has 2 main colors histogram which are green and red. – Green indicates an upward wave. The more the price increases, the bigger the green volume gets. – The red color shows a d
FREE
Quantum Heiken Ashi PRO MT4
Bogdan Ion Puscasu
4.33 (6)
Apresentando o       Gráficos   Quantum Heiken Ashi PRO Projetadas para fornecer informações claras sobre as tendências do mercado, as velas Heiken Ashi são conhecidas por sua capacidade de filtrar o ruído e eliminar sinais falsos. Diga adeus às confusas flutuações de preços e olá para uma representação gráfica mais suave e confiável. O que torna o Quantum Heiken Ashi PRO verdadeiramente único é sua fórmula inovadora, que transforma os dados tradicionais de velas em barras coloridas fáceis de le
Chart Patterns Detect 15 patterns (Ascending Triangle, Descending Triangle, Rising Wedge, Falling Wedge, Bullish Flag, Bearish Flag, Bullish Rectangle, Bearish Rectangle Symmetrical triangle, Head and Shoulders, Inverted Head and Shoulders, Triple top, Triple Bottom, Double Top, Double Bottom) Use historical data to calculate the probability of each pattern to succeed (possibility to filter notification according to the chance of success) gives graphic indication about the invalidation level and
Uma das sequências numéricas é chamada de "Forest Fire Sequence". Foi reconhecida como uma das mais belas novas sequências. Sua principal característica é que essa sequência evita tendências lineares, mesmo as mais curtas. É esta propriedade que formou a base deste indicador. Ao analisar uma série temporal financeira, este indicador tenta rejeitar todas as opções de tendência possíveis. E somente se ele falhar, ele reconhece a presença de uma tendência e dá o sinal apropriado. Esta abordagem pe
ForexGumpXL
Andrey Kozak
5 (1)
ForexGumpXL é uma nova geração na linha de indicadores forex gump. Mais preciso, mais rápido, menos complicado nas configurações é tudo sobre o novo indicador ForexGumpXL. Na nova versão do indicador, aplicamos um algoritmo de trabalho verdadeiramente novo. Agora ele não apenas analisa o mercado para uma reversão de preços, mas com a ajuda de um algoritmo de adaptação, determinar a volatilidade atual no indicador de mercado com um alto grau de probabilidade é capaz de antecipar falsas reversões
O telefone de notificação de seta de escalpelamento é um indicador de negociação de escalpelamento exclusivo. O indicador desenha setas no gráfico quando você precisa abrir um pedido, mostra em que direção você precisa abrir os pedidos e também envia uma notificação sobre um sinal para o seu telefone celular. A qualquer momento, mesmo quando não estiver no computador, você receberá sinais, poderá controlar o mercado e negociar. O indicador mostra com uma seta quando abrir um pedido, assim como
Indicador único que implementa uma abordagem profissional e quantitativa para significar negociação de reversão. Ele capitaliza o fato de que o preço desvia e retorna à média de maneira previsível e mensurável, o que permite regras claras de entrada e saída que superam amplamente as estratégias de negociação não quantitativas. [ Installation Guide | Update Guide | Troubleshooting | FAQ | All Products ] Sinais de negociação claros Incrivelmente fácil de negociar Cores e tamanhos personalizáveis
Atena Gold EA
Igor Pereira Calil
O especialista Atena é um robô para Meta Trader com objetivos de trabalhar com tendência e estratégias próprias do robô. OBTENHA Atena Gold EA GRATUITAMENTE INSTALADO E OPERANDO EM SUA CONTA, ME PERGUNTE MANDE MENSAGEM NO PRIVADO. Atena foi desenvolvido para operar com maior segurança no metal americano (GOLD, XAUUSD). Atena GOLD é um robô de longo prazo, com lucros SEMANAL E MENSAL, não se apavore muito se as vezes demorar algum fechamento. Lembre-se que Atena opera nas duas tendências do merca
Delta Pairs
Anatolii Zainchkovskii
Delta Pairs is an indicator for pair trading, it displays the divergence of two currency pairs. Does not redraw. A useful tool for the analysis of the behavior of two currency pairs relative to each other. Purpose The Delta Pairs indicator is designed for determining the divergences in the movements of two currency pairs. This indicator is displayed as two line charts and the difference (delta) between these charts in the form of a histogram. The Delta Pairs indicator will be useful for those w
To download MT5 version please click  here . This is the exact conversion from TradingView: "WaveTrend [LazyBear]" By "zeusuk3". One of the coolest indicators out there to detect overbought and oversold zones. It can be used as a part of more complicated strategy and for confirming a potential trade setup. There are buffers to use in EAs also. The indicator is loaded light and non-repaint. - You can message in private chat for further changes you need. Thanks for downloading 
Daily Candle Predictor é um indicador que prevê o preço de fechamento de uma vela. O indicador destina-se principalmente ao uso em gráficos D1. Este indicador é adequado tanto para negociação forex tradicional quanto para negociação de opções binárias. O indicador pode ser usado como um sistema de negociação autônomo ou pode atuar como um complemento ao seu sistema de negociação existente. Este indicador analisa a vela atual, calculando certos fatores de força dentro do próprio corpo da vela, be
Antes de tudo, vale ressaltar que esta Ferramenta de Negociação é um Indicador Não Repintante, Não Redesenhante e Não Atrasado, o que a torna ideal para negociação profissional. Curso online, manual do utilizador e demonstração. O Indicador de Conceitos de Ação de Preço Inteligente é uma ferramenta muito poderosa tanto para traders novos quanto experientes. Ele combina mais de 20 indicadores úteis em um único, combinando ideias avançadas de negociação como Análise do Trader do Círculo Interno e
Golden Flash Scalper
Felipe Jose Costa Pereira
Principais Características: O Golden Scalper XAU/USD foi criado para se adaptar às nuances do mercado de ouro, proporcionando sinais de alta qualidade Análise Avançada de Padrões: Usando técnicas de análise de padrões de preços, o indicador identifica as melhores oportunidades de entrada, evitando os falsos sinais e aumentando as chances de sucesso a cada operação. Alta Taxa de Assertividade: Baseado em algoritmos inteligentes, o indicador tem uma taxa de assertividade superior, proporcionando a
This indicator draws Horizontal Support and Resistance automatically. It works with any symbol and any timeframe. Stronger Support Lines are displayed in thicker green horizontal lines. In the same way, Stronger Resistance lines are displayed with thicker red lines. Change the timeframe to display the Support and Resistance Lines of various timeframes.
NeuroExtMT4
Dmytryi Voitukhov
https://t.me/mql5_neuroExt   actual version Signal  https://www.mql5.com/ru/signals/1516213 You can use any tool. The bases will be automatically created at the start of the Learn. If you need to start learning from 0 - just delete the base files. Initial deposit - from 200 ye. Options: DO NOT ATTEMPT TO TEST WITHOUT NEURAL NETWORK TRAINING! it is enough for the balance graph after training to be horizontal. generating a training base is extremely simple.  there is a ready-made training for
FREE
Os compradores deste produto também adquirem
Gann Made Easy
Oleg Rodin
4.8 (116)
Gann Made Easy é um sistema de negociação Forex profissional e fácil de usar, baseado nos melhores princípios de negociação usando a teoria do sr. W. D. Gann. O indicador fornece sinais precisos de COMPRA e VENDA, incluindo níveis de Stop Loss e Take Profit. Você pode negociar mesmo em movimento usando notificações PUSH. Entre em contato comigo após a compra! Vou compartilhar minhas dicas de negociação com você e ótimos indicadores de bônus de graça! Provavelmente você já ouviu muitas vezes sobr
Actualmente 20% OFF ! A melhor solução para qualquer novato ou comerciante especializado! Este software de painel de instrumentos está a funcionar em 28 pares de moedas. É baseado em 2 dos nossos principais indicadores (Advanced Currency Strength 28 e Advanced Currency Impulse). Dá uma grande visão geral de todo o mercado Forex. Mostra valores avançados de força da moeda, velocidade de movimento da moeda e sinais para 28 pares de divisas em todos os (9) períodos de tempo. Imagine como a sua n
Scalper Inside PRO
Alexey Minkov
4.76 (63)
!SPECIAL SALE! An exclusive indicator that utilizes an innovative algorithm to swiftly and accurately determine the market trend. The indicator automatically calculates opening, closing, and profit levels, providing detailed trading statistics. With these features, you can choose the most appropriate trading instrument for the current market conditions. Additionally, you can easily integrate your own arrow indicators into Scalper Inside Pro to quickly evaluate their statistics and profitability
M1 Arrow
Oleg Rodin
5 (17)
Uma estratégia intradiária baseada em dois princípios fundamentais do mercado. O algoritmo é baseado na análise de volumes e ondas de preços usando filtros adicionais. O algoritmo inteligente do indicador dá um sinal apenas quando dois fatores de mercado se combinam em um. O indicador calcula ondas de um determinado intervalo no gráfico M1 usando os dados do período de tempo mais alto. E para confirmar a onda, o indicador utiliza a análise por volume. Este indicador é um sistema de negociação pr
Dynamic Forex28 Navigator
Bernhard Schweigert
5 (5)
Dynamic Forex28 Navigator - A ferramenta de negociação Forex de última geração. ATUALMENTE 49% DE DESCONTO. Dynamic Forex28 Navigator é a evolução dos nossos indicadores populares de longa data, combinando o poder de três em um: Indicador Advanced Currency Strength28 (695 avaliações) + Advanced Currency IMPULSE com ALERTA (520 avaliações) + Sinais CS28 Combo (Bônus). Detalhes sobre o indicador https://www.mql5.com/en/blogs/post/758844 O que o Next-Generation Strength Indicator oferece?  Tudo
Scalper Vault
Oleg Rodin
5 (29)
Scalper Vault é um sistema profissional de escalpelamento que fornece tudo o que você precisa para um escalpelamento bem-sucedido. Este indicador é um sistema de negociação completo que pode ser usado por comerciantes de forex e opções binárias. O período de tempo recomendado é M5. O sistema fornece sinais de seta precisos na direção da tendência. Ele também fornece sinais superiores e inferiores e níveis de mercado Gann. Os indicadores fornecem todos os tipos de alertas, incluindo notificações
Grabber System MT4
Ihor Otkydach
5 (1)
Apresento a você um excelente indicador técnico: Grabber, que funciona como uma estratégia de trading “tudo incluído”, pronta para usar. Em um único código estão integradas ferramentas poderosas de análise técnica de mercado, sinais de entrada (setas), funções de alertas e notificações push. Cada comprador deste indicador também recebe gratuitamente: Utilitário Grabber: ferramenta para gerenciamento automático de ordens abertas Vídeo tutorial passo a passo: como instalar, configurar e operar com
Algo Pumping MT4
Ihor Otkydach
5 (4)
PUMPING STATION – Sua estratégia pessoal “tudo incluído” Apresentamos o PUMPING STATION — um indicador revolucionário para Forex que vai transformar sua maneira de operar em uma experiência empolgante e eficaz. Este não é apenas um assistente, mas sim um sistema de trading completo com algoritmos poderosos que vão te ajudar a operar de forma mais estável. Ao adquirir este produto, você recebe GRATUITAMENTE: Arquivos de configuração exclusivos: para uma configuração automática e desempenho máximo
Easy Breakout
Mohamed Hassan
5 (10)
After your purchase, feel free to contact me for more details on how to receive a bonus indicator called VFI, which pairs perfectly with Easy Breakout for enhanced confluence!   Easy Breakout is a powerful price action trading system built on one of the most popular and widely trusted strategies among traders: the Breakout strategy ! This indicator delivers crystal-clear Buy and Sell signals based on breakouts from key support and resistance zones. Unlike typical breakout indicators, it levera
Enigmera
Ivan Stefanov
5 (7)
ENIGMERA: O núcleo do mercado Importante: A demonstração do MQL5.com funciona no Strategy Tester e pode não refletir completamente a funcionalidade do Enigmera. Verifique a descrição, as capturas de tela e o vídeo para mais detalhes. Fique à vontade para me enviar uma mensagem com qualquer dúvida! O código do indicador foi completamente reescrito. A versão 3.0 adiciona novas funcionalidades e corrige erros acumulados desde o início do indicador. Introdução Este indicador e sistema de negociação
Golden Trend Indicator
Noha Mohamed Fathy Younes Badr
4.9 (10)
Golden Trend indicator  is The best indicator for predicting trend movement this indicator never lags and never repaints and never back paints    and give  arrow buy and sell    before the candle appear  and it will help you and  will make your trading decisions clearer its work on all currencies and  gold and crypto and all time frame This unique  indicator uses very secret algorithms to catch the  trends, so you can trade using this indicator and see the trend clear on charts  manual guide and
TPSproTREND PrO
Roman Podpora
4.68 (25)
VERSION MT5        —        ИНСТРУКЦИЯ RUS           —        INSTRUCTIONS  ENG Principais funções: Sinais de entrada precisos SEM RENDERIZAÇÃO! Se aparecer um sinal, ele permanece relevante! Esta é uma diferença importante em relação aos indicadores de redesenho, que podem fornecer um sinal e depois alterá-lo, o que pode levar à perda de fundos depositados. Agora você pode entrar no mercado com maior probabilidade e precisão. Também existe a função de colorir as velas após o aparecimento da se
Lux Trend
Mohamed Hassan
5 (3)
After purchase, please contact me to get your trading tips + more information for a great bonus!   Lux Trend is a professional strategy based on using Higher Highs and Lower Highs to identify and draw Trendline Breakouts! Lux Trend  utilizes two Moving Averages to confirm the overall trend direction before scanning the market for high-quality breakout opportunities, ensuring more accurate and reliable trade signals. This is a proven trading system used by real traders worldwide, demonstrating
O Oscilador de Quebra de Volume é um indicador que combina o movimento dos preços com as tendências de volume sob a forma de um oscilador. Queria integrar a análise de volume nas minhas estratégias, mas sempre me desiludiram a maioria dos indicadores de volume, como OBV, Money Flow Index, A/D, mas também como Volume Weighted Macd e muitos outros. Por isso escrevi este indicador para mim próprio, estou satisfeito com a sua utilidade e por isso decidi publicá-lo no mercado. Principais caracterí
Volatility Trend System - um sistema de negociação que dá sinais para entradas. O sistema de volatilidade fornece sinais lineares e pontuais na direção da tendência, bem como sinais para sair dela, sem redesenho e atrasos. O indicador de tendência monitora a direção da tendência de médio prazo, mostra a direção e sua mudança. O indicador de sinal é baseado em mudanças na volatilidade e mostra entradas no mercado. O indicador está equipado com vários tipos de alertas. Pode ser aplicado a vários i
Gold Venamax MT4
Sergei Linskii
2 (1)
Gold Venamax   - este é o melhor indicador técnico de ações. O algoritmo do indicador analisa o movimento do preço de um ativo e reflete a volatilidade e as zonas de entrada potenciais. Recursos do indicador: Este é um super indicador com Magic e dois blocos de setas de tendência para uma negociação confortável e lucrativa. O botão vermelho para alternar blocos é exibido no gráfico. Magic é definido nas configurações do indicador, para que você possa instalar o indicador em dois gráficos exibin
FX Power MT4 NG
Daniel Stein
4.94 (18)
FX Power: Analise a Força das Moedas para Decisões de Negociação Mais Inteligentes Visão Geral FX Power é a sua ferramenta essencial para compreender a força real das principais moedas e do ouro em quaisquer condições de mercado. Identificando moedas fortes para comprar e fracas para vender, FX Power simplifica as decisões de negociação e revela oportunidades de alta probabilidade. Quer você prefira seguir tendências ou antecipar reversões usando valores extremos de Delta, esta ferramenta adap
GOLD Impulse with Alert
Bernhard Schweigert
4.6 (10)
Este indicador é uma super combinação dos nossos 2 produtos Advanced Currency IMPULSE with ALERT  +   Currency Strength Exotics . Funciona para todos os períodos de tempo e mostra graficamente impulso de força ou fraqueza para as 8 principais moedas mais um Símbolo! Este Indicador é especializado para mostrar a aceleração da força da moeda para quaisquer símbolos como Ouro, Pares Exóticos, Commodities, Índices ou Futuros. É o primeiro do seu género, qualquer símbolo pode ser adicionado à 9ª
FX Volume
Daniel Stein
4.6 (35)
FX Volume: Vivencie o Verdadeiro Sentimento de Mercado sob a Perspectiva de um Corretor Visão Geral Rápida Quer aprimorar sua abordagem de trading? FX Volume fornece insights em tempo real sobre como traders de varejo e corretores estão posicionados—bem antes de relatórios atrasados como o COT. Seja para buscar ganhos consistentes ou simplesmente ter uma vantagem mais clara no mercado, FX Volume ajuda você a detectar grandes desequilíbrios, confirmar rompimentos e aperfeiçoar sua gestão de ris
Experimente o "Chart Patterns All in One" no modo demo e receba um bônus. Envie-me uma mensagem após testar no modo demo para receber seu bônus. Deixe um comentário após a compra para receber 8 indicadores de alta qualidade como bônus. O indicador Chart Patterns All-in-One ajuda os traders a visualizar vários padrões gráficos comumente usados na análise técnica. Este indicador auxilia na identificação de comportamentos potenciais do mercado, mas não garante rentabilidade. Recomenda-se testar o
[ MT5 Version ]  [ Kill Zones ]  [ SMT Divergences ] How to trade using Order Blocks:  Click here User Interface Performance:  During testing in the strategy tester, the UI may experience lag. Rest assured, this issue is specific to the testing environment and does not affect the indicator's performance in live trading. Elevate your trading strategy with the  Order Blocks ICT Multi TF  indicator, a cutting-edge tool designed to enhance your trading decisions through advanced order block analys
Tendência do ouro   - este é um bom indicador técnico de acções. O algoritmo do indicador analisa o movimento do preço de um ativo e reflecte a volatilidade e as potenciais zonas de entrada. Os melhores sinais do indicador: - Para VENDER = histograma vermelho + ponteiro SHORT vermelho + seta de sinal amarelo na mesma direção. - Para COMPRAR = histograma azul + ponteiro LONGO azul + seta de sinal aqua na mesma direção. Vantagens do indicador: 1. O indicador produz sinais com elevada precis
O Wave Synchronizer é um indicador visual de análise de ondas. Combina sequências de movimentos de velas e cria ondas direcionais, produzindo movimentos sincronizados juntamente com o mercado. O início de cada onda começa com uma seta de sinalização, existindo também alertas. O indicador nunca redesenhará ou moverá as setas no histórico anterior. Aparecem setas de sinal no fecho da vela. Adapta-se para trabalhar com quaisquer instrumentos de negociação e prazos. Fácil de utilizar e configurar,
Uma implementação pessoal de blocos de pedidos, uma estratégia de negociação de posição simples, mas eficaz. O negociador deve entrar no mercado ou procurar negociações na direção do último bloco de ordem, se a faixa de preço não foi violada na direção oposta ao rompimento. Blocos abertos não são desenhados para maior clareza. [ Guia de instalação | Guia de atualização | Solução de problemas | FAQ | Todos os produtos ] Um bloco aberto de alta é a primeira barra de alta após uma nova baixa do me
Candle Probability Scalper
Martin Alejandro Bamonte
Guia de Uso do Candle Probability Scalper Este indicador torna o scalping fácil e 100% intuitivo. Candle Probability Scalper mostrará de forma instantânea os dados percentuais de força de compradores e vendedores em TEMPO REAL e na vela atual. Os percentuais são atualizados a cada tick, o que significa que você saberá, segundo a segundo, o que a maioria dos compradores e vendedores está fazendo, sem nenhum atraso. Isso ajudará imensamente a determinar ou confirmar a força de cada lado e, conseq
ACTUALMENTE 31% DE DESCONTO!! A melhor solução para qualquer novato ou comerciante especializado! Este indicador é uma ferramenta comercial única, de alta qualidade e acessível, porque incorporámos uma série de características proprietárias e uma fórmula secreta. Com apenas UM gráfico, dá alertas para todos os 28 pares de moedas. Imagine como a sua negociação irá melhorar porque é capaz de identificar o ponto exacto de desencadeamento de uma nova tendência ou oportunidade de escalada! Constr
KT Asian Breakout Indicator
KEENBASE SOFTWARE SOLUTIONS
O indicador KT Asian Breakout analisa uma parte crítica da sessão asiática para gerar sinais de compra e venda em ambas as direções, com base na quebra de preço. Um sinal de compra ocorre quando o preço rompe acima da máxima da sessão, enquanto um sinal de venda ocorre quando o preço rompe abaixo da mínima da sessão. Coisas para lembrar Se a caixa da sessão for muito ampla verticalmente, deve-se evitar uma nova negociação, pois a maior parte da ação do preço já ocorreu dentro da sessão. Se a ve
O sistema PRO Renko é um sistema de negociação altamente preciso especialmente concebido para a negociação de gráficos RENKO. Trata-se de um sistema universal que pode ser aplicado a vários instrumentos de negociação. O sistema neutraliza eficazmente o chamado ruído de mercado, dando-lhe acesso a sinais de inversão precisos. O indicador é muito fácil de usar e tem apenas um parâmetro responsável pela geração de sinal. Você pode facilmente adaptar a ferramenta a qualquer instrumento de negocia
O Top Bottom Tracker é um indicador baseado em algoritmos sofisticados que analisa a tendência do mercado e pode detetar os altos e baixos da tendência / Versão MT5 . O preço aumentará progressivamente até atingir 500$. Próximo preço --> $99 Características Sem repintura Este indicador não altera os seus valores quando chegam novos dados Pares de negociação Todos os pares de forex Timeframe   Todos os timeframes Parâmetros ==== Configuração do indicador ==== Parâmetro de configuração
TPSpro RFI Levels
Roman Podpora
4.85 (27)
O indicador que redefiniu a negociação, tornou-se referência para análise de gráficos e estabeleceu novos padrões em negociação. Zonas de reversão /   Zonas de pico de volume   /   Zonas ativas de um grande player     INSTRUÇÕES RUS         INSTRUÇÕES   ENG   /   Recomendamos usar com o indicador -   TPSpro TREND PRO Cada comprador deste indicador recebe adicionalmente GRATUITAMENTE: 6 meses de acesso aos sinais de negociação do serviço RFI SIGNALS - pontos de entrada prontos de acordo c
Mais do autor
Coral Rate of Change Dashboard  displays "rate of change" calculations across multiple symbols and timeframes simultaneously.  See at a glance which pairs are moving, and how quickly.  Receive alerts when any symbol + timeframe is experiencing very strong movement.  You can display data for currency pairs, or for individual currencies (takes the average for each currency across all available pairs). See the CoralDash product description for the core functionality of the dashboard (symbol exposu
Coral Heatmap
D Armond Lee Speers
Coral Heatmap is a currency strength meter based on the ATR values for the selected timeframe.  There are two main view modes: All Currencies (default) - see the ranked strength of all currencies in a single view Selected Currency - see the relative strength of all other currencies compared to a selected currency You can optionally display the timeframe selection toolbar; timeframe is always synchronized to the current chart timeframe.  Use keyboard shortcuts to quickly navigate currencies (up/d
Chart Logic
D Armond Lee Speers
Chart Logic is here!  Chart automation for MT4: put your Ideas into Actions! Chart Logic is an EA for MT4 that lets you automate actions on your charts.  You define "conditions" and 'actions"; when all the conditions are true, then all the actions are triggered.  Conditions can refer to a wide range of observations, about account information, candle data, technical indicators, key levels, price, time, market data, trades and so on.  And actions can send alerts/notifications, open/close/modify tr
CoralDash
D Armond Lee Speers
CoralDash is a simple symbol shortcut dashboard.   The Symbol List has many presets to choose from:  Market Watch Open Orders Current Chart Majors A custom list Clicking the symbol has two available actions Set the current chart symbol Filter the list of symbols shown in the dashboard based on one currency (e.g., see all EUR pairs) Click the "PAIR" cell in the header to toggle between the two available actions Click the symbol cell to apply the action For the filter, click the left side to selec
FREE
CoralPage
D Armond Lee Speers
CoralPage is a simple little utility to add navigation controls to your chart.  You can now easily step through the symbols in the Market Watch without having to click-and-drag a symbol from the Market Watch onto your chart.  It's a simple but indispensable time-saver! Click move to the first, previous, next or last symbol in the Market Watch.  Shift-click to go the the previous or next symbol that has an open order. CoralPage is completely free.  If you like this, please check out my other prod
FREE
Coral Trade Planner is a 3-in-1 tool for making smart trades.   The Lot Size Calculator lets you determine the appropriate lot size based on risk, and see the impact on your risk as you change the stop loss distance and/or lot size.   The Trade Planner is an innovative tool for visualizing your planned trades on the chart, and gives you immediate feedback on the value of the trade (both the risk of hitting your stop loss and the reward of hitting your take profit).  Both Market and Pending order
Coral Multi TF Meter allows you to quickly see how price is moving on a single currency pair across multiple timeframes at once.  You can select which timeframes to display; the size, position, colors of cells; whether to display values or not; and how often the meter is updated. The calculation is based on ATR distance for each displayed timeframe.  Hover over the header cell for the row (with the currency name in it) to see the current ATR value (in pips) for that period.  When "Display Values
Coral History
D Armond Lee Speers
Coral History displays information about your trading account and a summary of your history for the day, week, month and all time in a convenient, lightweight window. NEW : You can now set daily / weekly / monthly goals.   Coral History can notify you when reaching a goal.  If set the goal will be displayed in the History section row header; and if you've reached the goal the row will be highlighted in green. Account Information Balance Equity Free Margin (amount, percent or drawdown) Marin Leve
Coral Rescue
D Armond Lee Speers
Coral Rescue will help save an account with trades in drawdown.  Do you have losing trades that are just too large to deal with?  They reduce your available margin and can be accumulating swap costs, but the loss would be too great to just accept closing the trades.  Just hoping that price will eventually come back is not an effective strategy, you need a disciplined, consistent and preferably automatic way to dig yourself out of the hole. Coral Rescue is not an EA that places trades on its own.
Filtro:
Sem comentários
Responder ao comentário