Daily Highs and Lows
- Indicadores
- Philani Mthembu
- Versão: 1.0
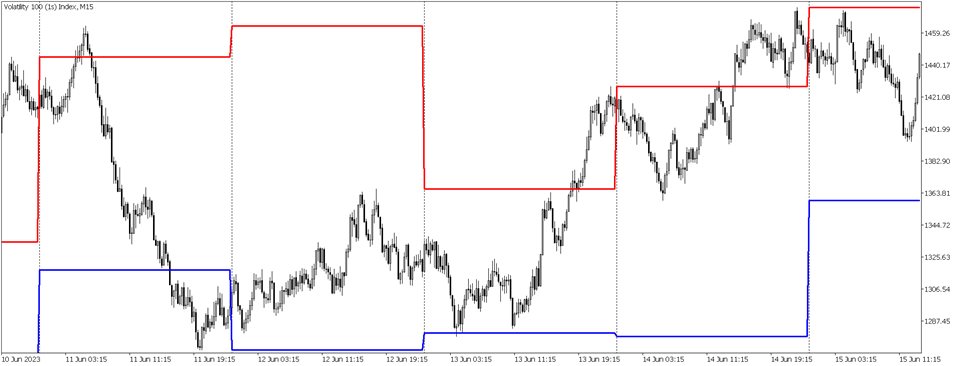
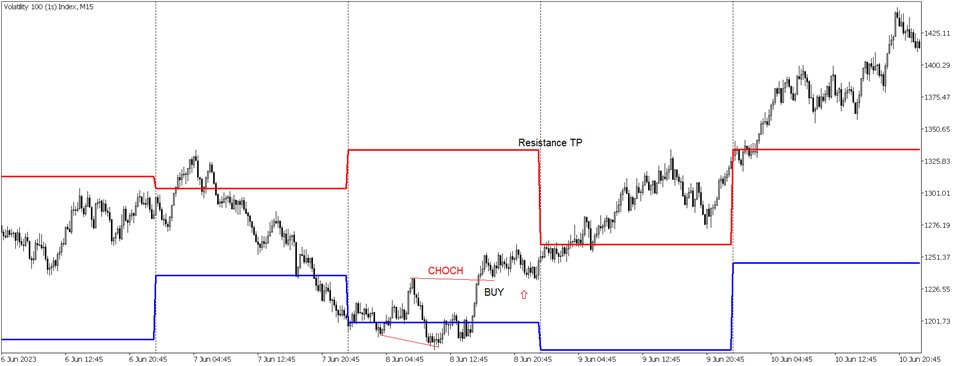
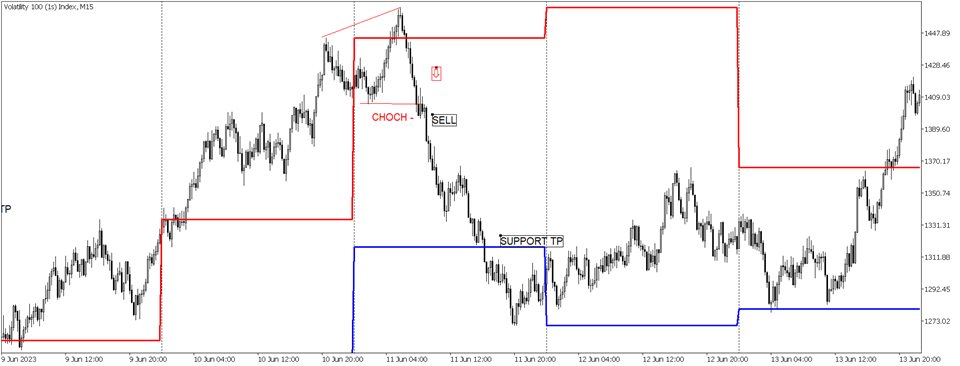
The Daily Highs and Lows Indicator is a versatile tool that combines support and resistance levels with real-time market dynamics. By incorporating previous daily highs and lows, it provides valuable insights into market psychology and identifies potential areas of price reversals or breakouts. With its ability to adapt to changing market conditions and customizable options, traders can stay ahead of trends and make informed decisions. This indicator is suitable for various trading styles and timeframes, empowering both experienced and novice traders with a competitive edge.
### CHECK OUT OUR NEW LIQUIDITY HUNTER EA: https://www.mql5.com/en/market/product/121106?source=Site+Market+My+Products+Page
### TRADES SMC MARKET STRUCTURE. DOWNLOAD FOR FREE!!
Key Use Cases:
You can use this indicator any trading style.
One possible trading strategy utilizing the Dynamic Support and Resistance Indicator is the Breakout Strategy.
This strategy aims to capture potential price breakouts when the market surpasses key support or resistance levels.
Here's how the Breakout Strategy can be implemented:
1. Identify the Dynamic Support and Resistance Levels: Set up the indicator to display the dynamic support and resistance levels based on the previous daily highs and lows.
2. Wait for Consolidation: Monitor the price action to identify a period of consolidation where the price is trading within a relatively narrow range. This indicates that market participants are undecided about the next direction.
3. Set Entry Orders: Place buy orders slightly above the dynamic resistance level or sell orders slightly below the dynamic support level. This ensures that if the price breaks out of the consolidation range, the orders will be triggered, capturing the potential breakout movement.
4. Implement Stop Loss and Take Profit Levels: To manage risk, set a stop loss order below the breakout level for buy orders or above the breakout level for sell orders. This helps limit potential losses in case the breakout fails. Additionally, determine a take profit level based on your risk-reward ratio or by identifying the next significant support or resistance level.
5. Monitor and Manage the Trade: Once the breakout occurs and the trade is triggered, monitor the trade closely. Adjust the stop loss level as the price moves in your favor to protect profits and potentially trail the stop loss to lock in gains.
6. Evaluate the Outcome: After the trade is closed, assess the results of the breakout. Analyze whether the breakout was successful or false, and identify any patterns or market conditions that could improve your strategy going forward.
Remember, it's essential to combine this strategy with proper risk management techniques, such as position sizing and portfolio diversification. Additionally, backtesting and forward testing the strategy on historical and real-time data can provide valuable insights into its effectiveness before committing real funds.

