Gold PL MTF 5
- Indicadores
- Sergei Linskii
- Versão: 3.0
- Atualizado: 26 julho 2023
- Ativações: 5
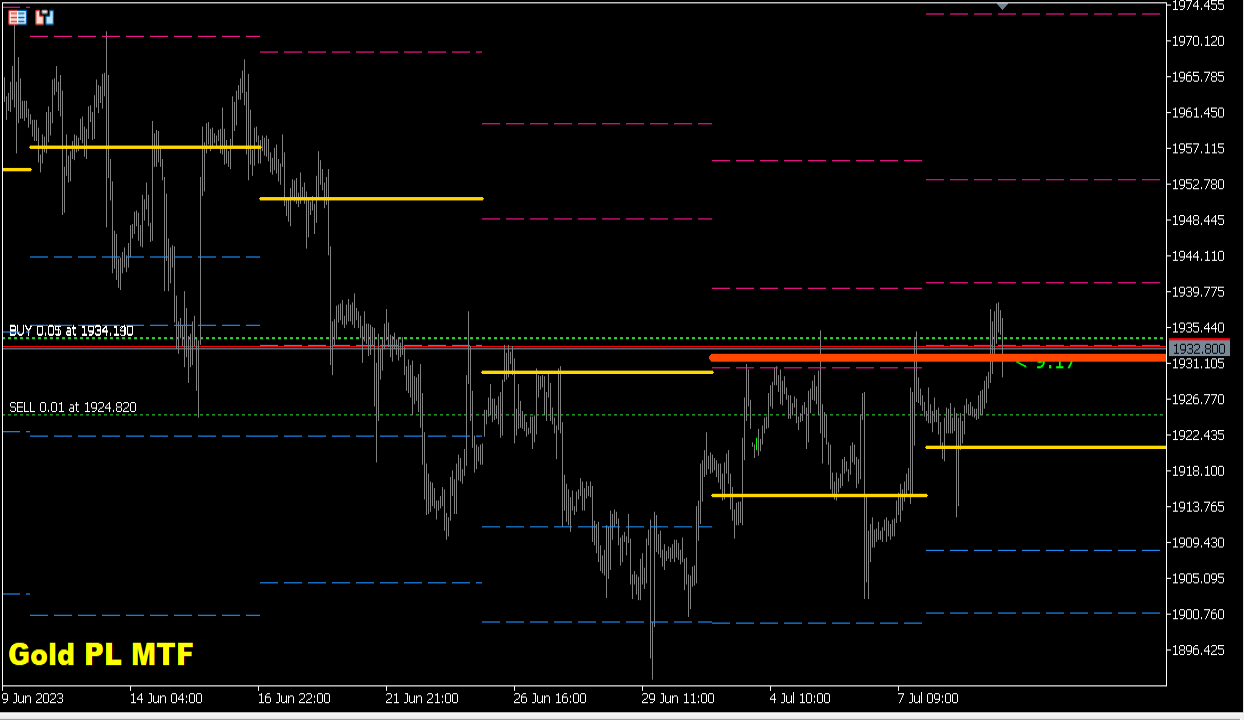
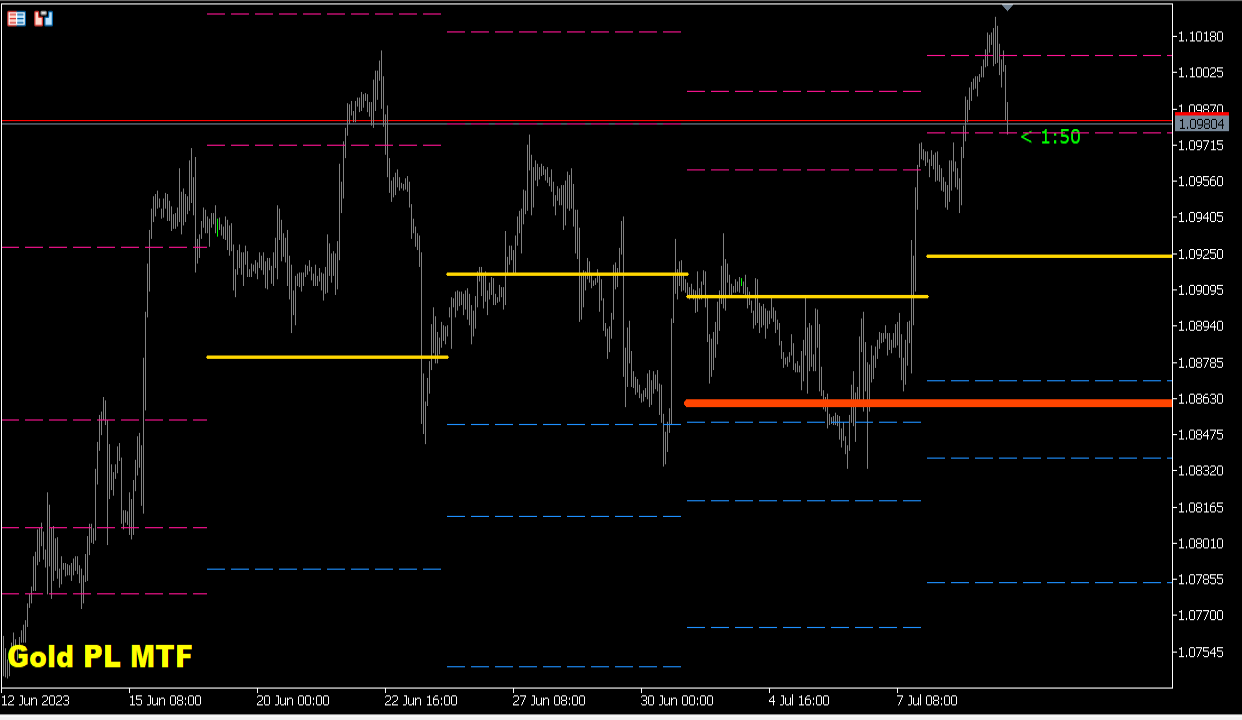
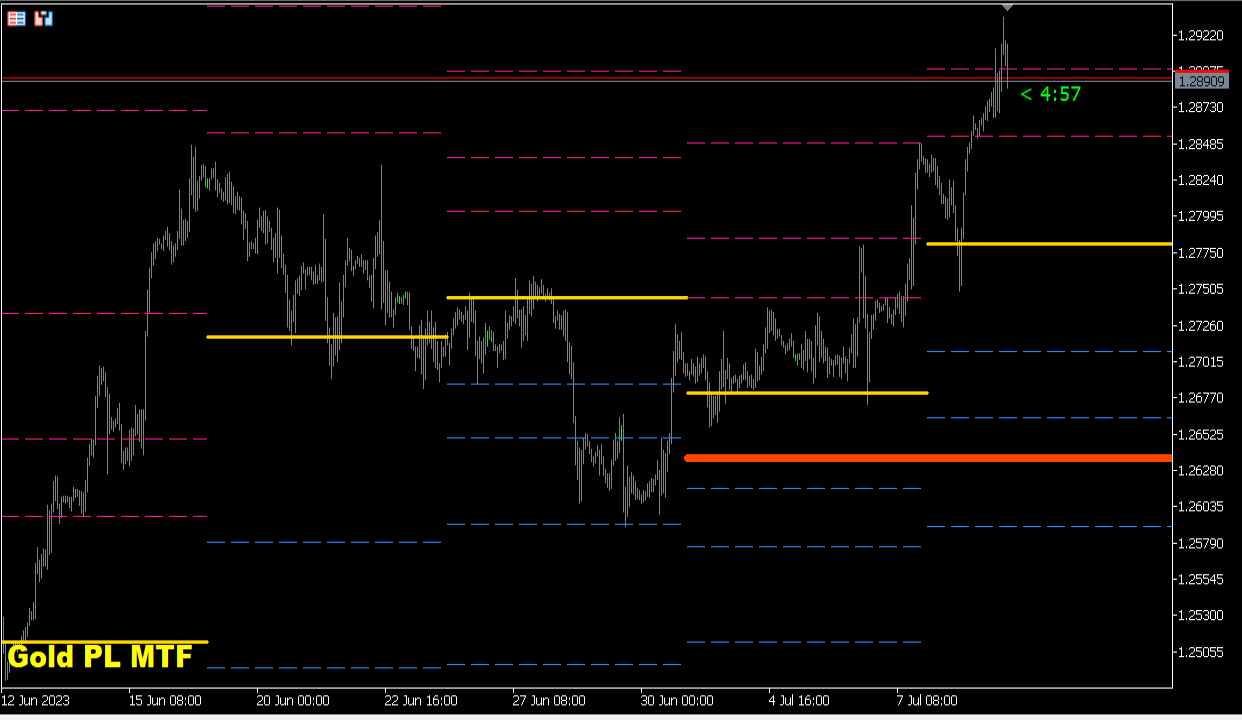
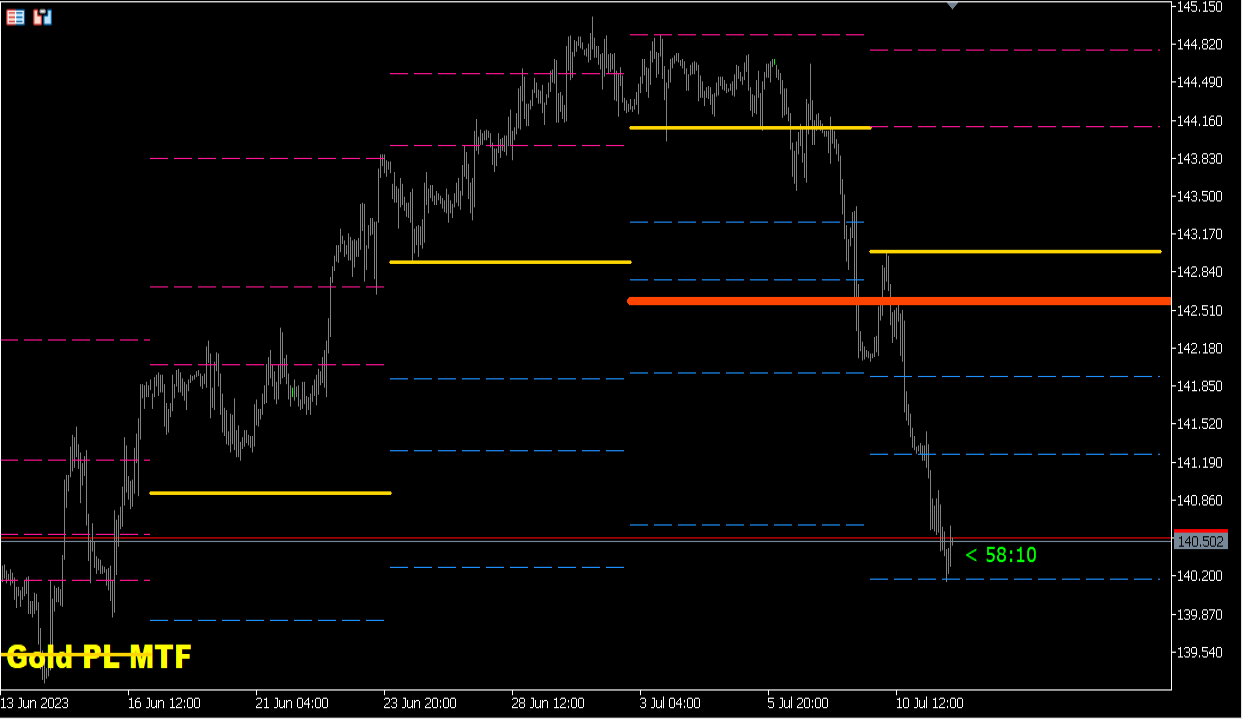
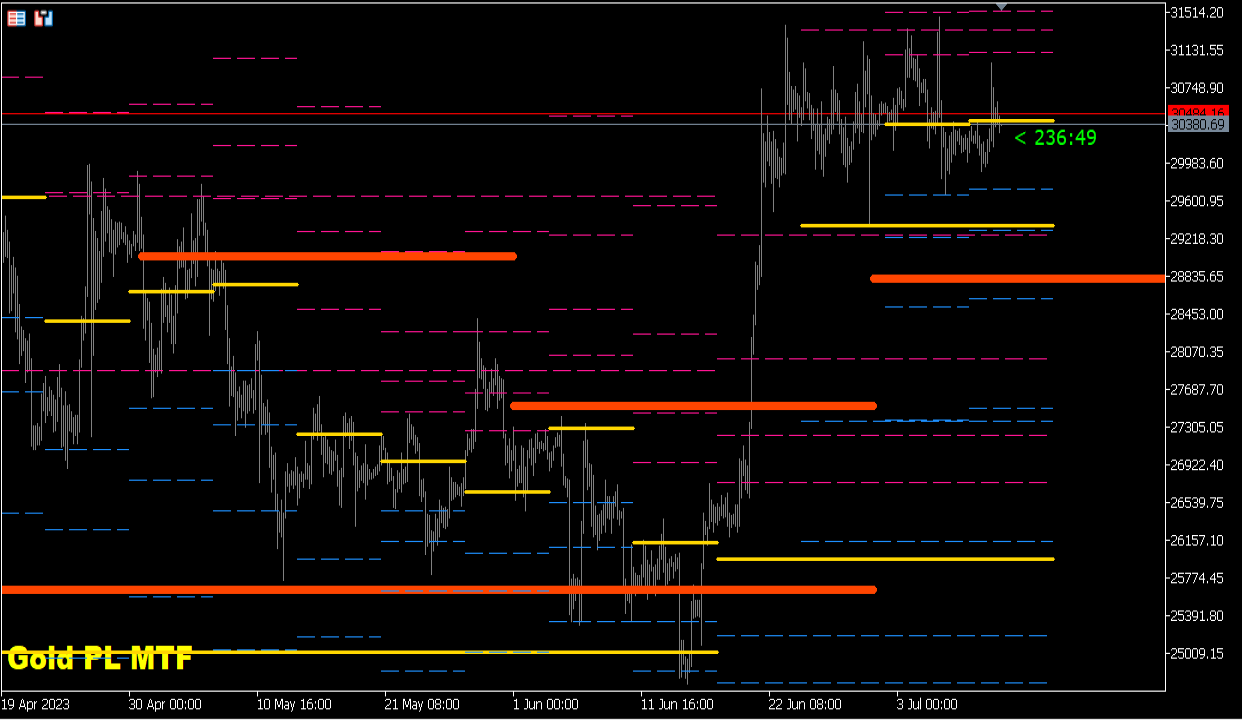
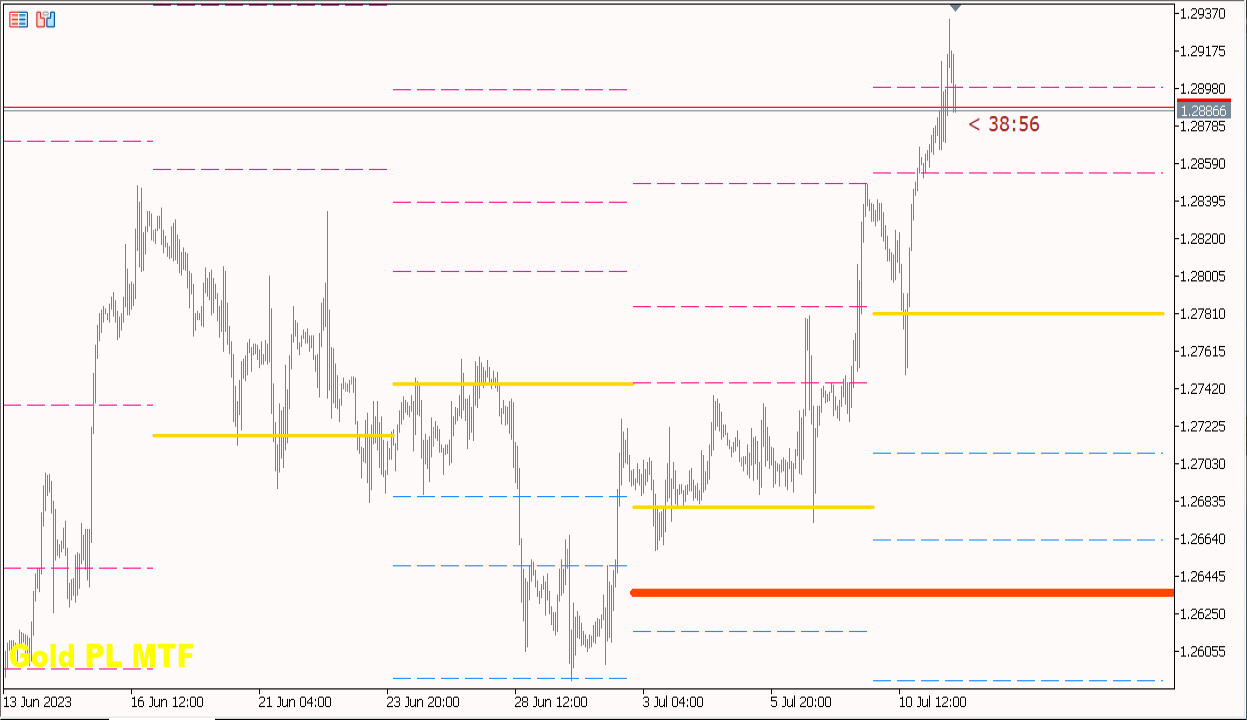
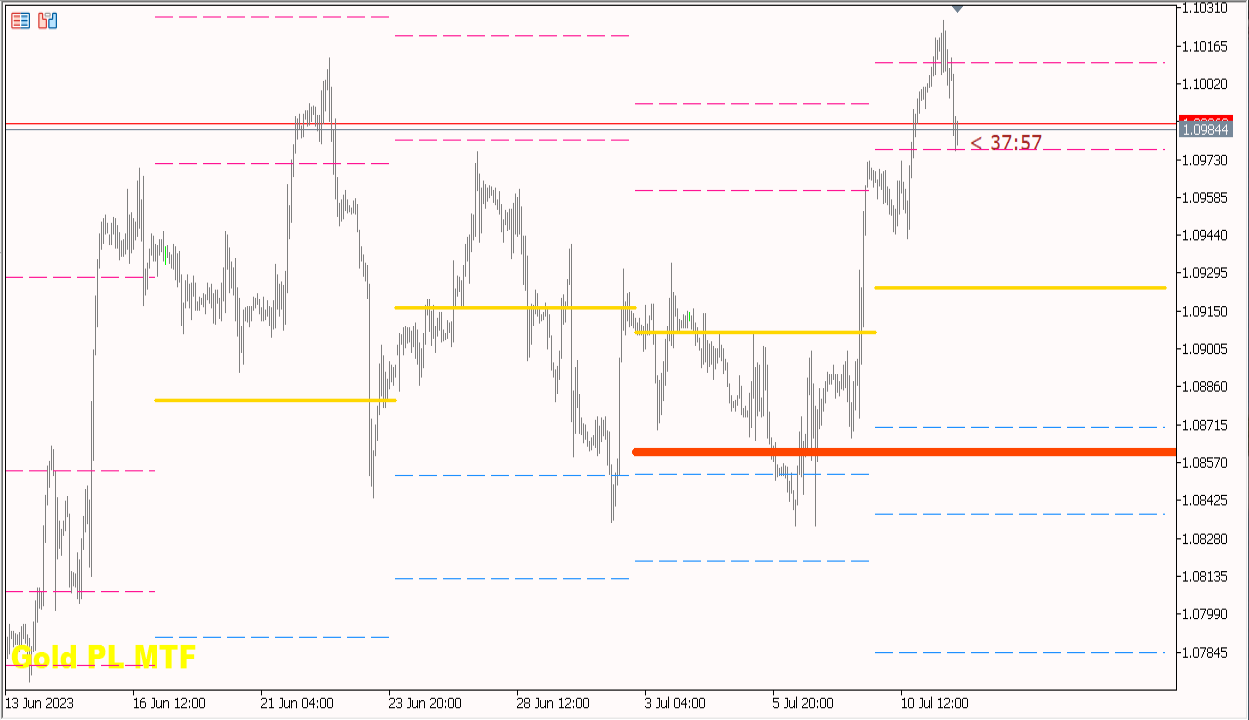
Gold PL MTF - this is a fine stock technical indicator. The indicator algorithm analyzes the movement of the asset price and automatically reflects the important Pivot Levels of the specified timeframe (TF) using the Fibonacci method (golden section).
The indicator perfectly describes the price trajectory of the selected timeframe (day, week, month, year), determines the beginning of a trend and the beginning of a correction, which may develop into an opposite trend.
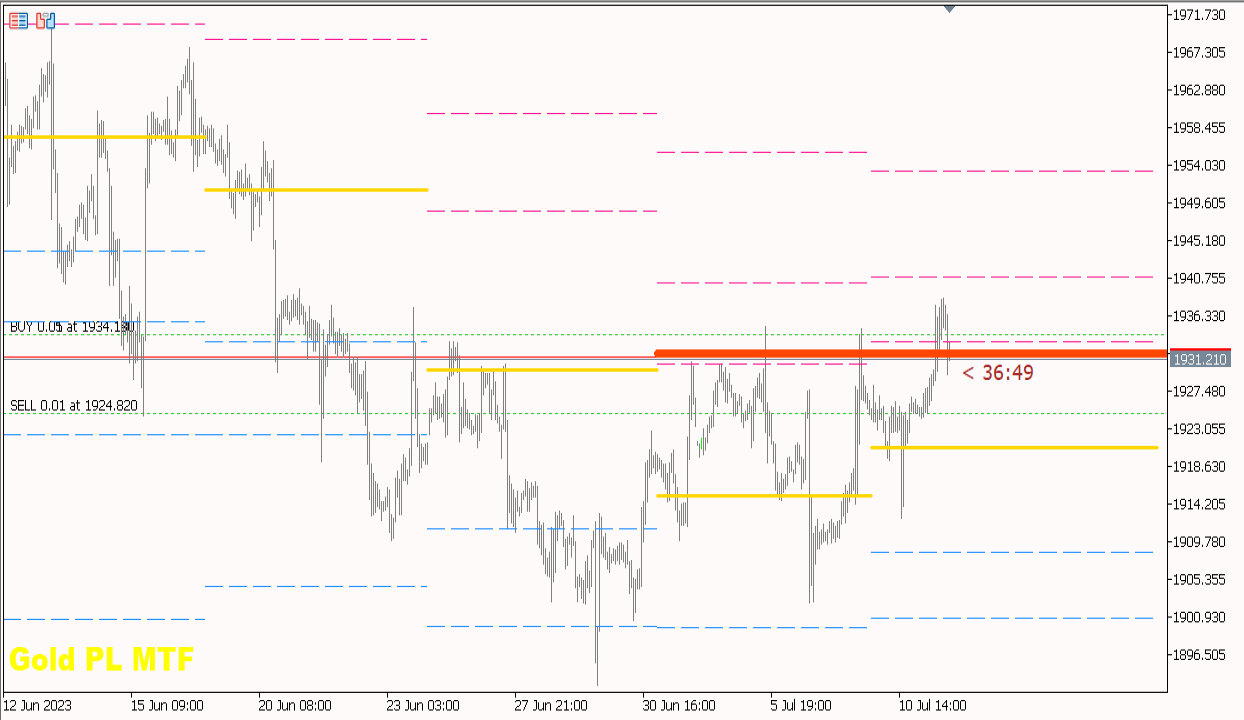
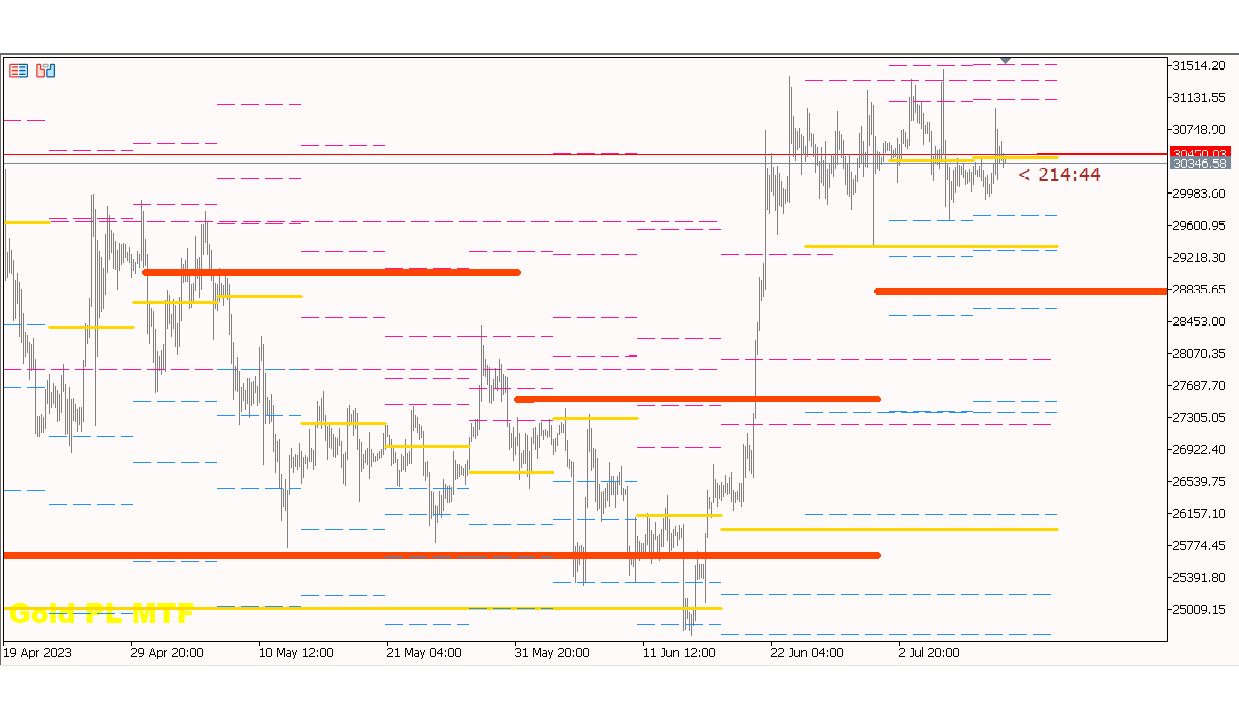
The indicator also shows the current unworked Pivot Levels of different timeframes, which serve as a price magnet. This allows you to quickly assess the situation on the market and make a decision on entering and / or exiting a transaction. The potential of each transaction averages from 50 to 250 points.
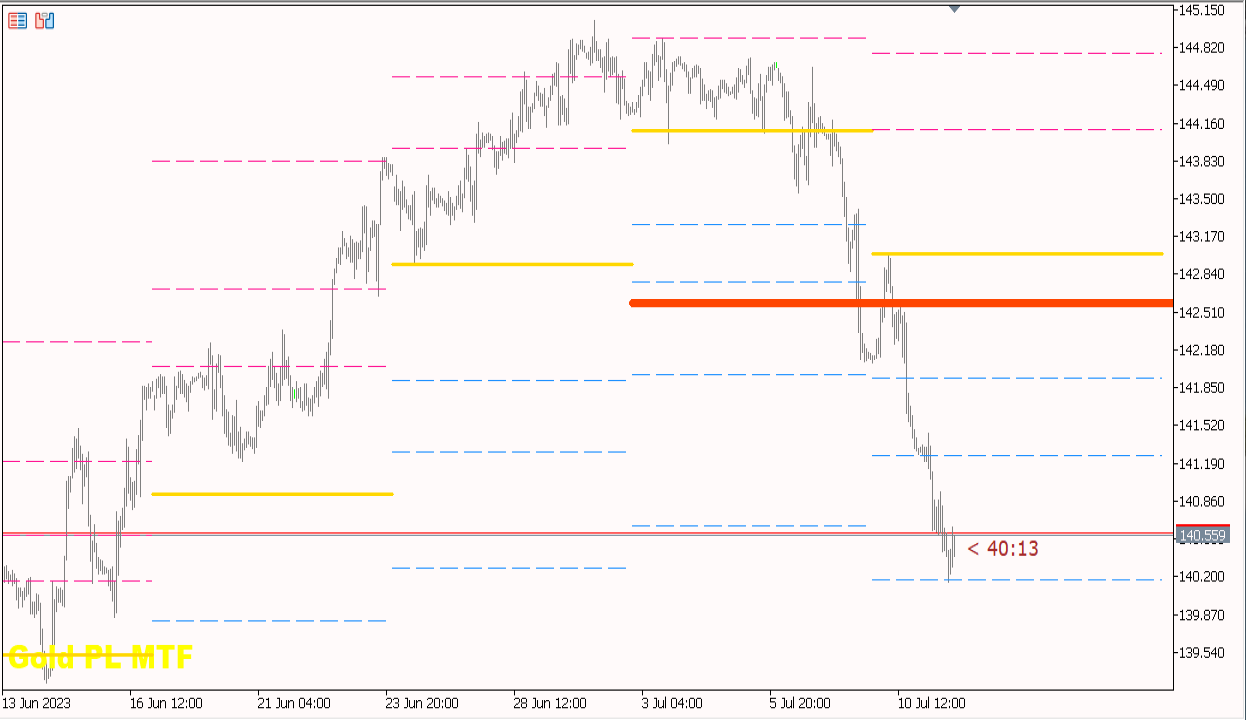
The indicator allows you to evaluate the likely direction of price movement on different timeframes, and also shows the most probable targets and the potential for price movement.
Benefits of the indicator:
- The indicator produces signals with high accuracy.
- The signal of the indicator does not disappear and is not redrawn.
- You can trade on the MetaTrader 5 trading platform of any broker.
- You can trade any assets (currencies, metals, cryptocurrencies, stocks, indices etc.).
- Recommended timeframes M30-H1-H4 for medium-long-term trading.
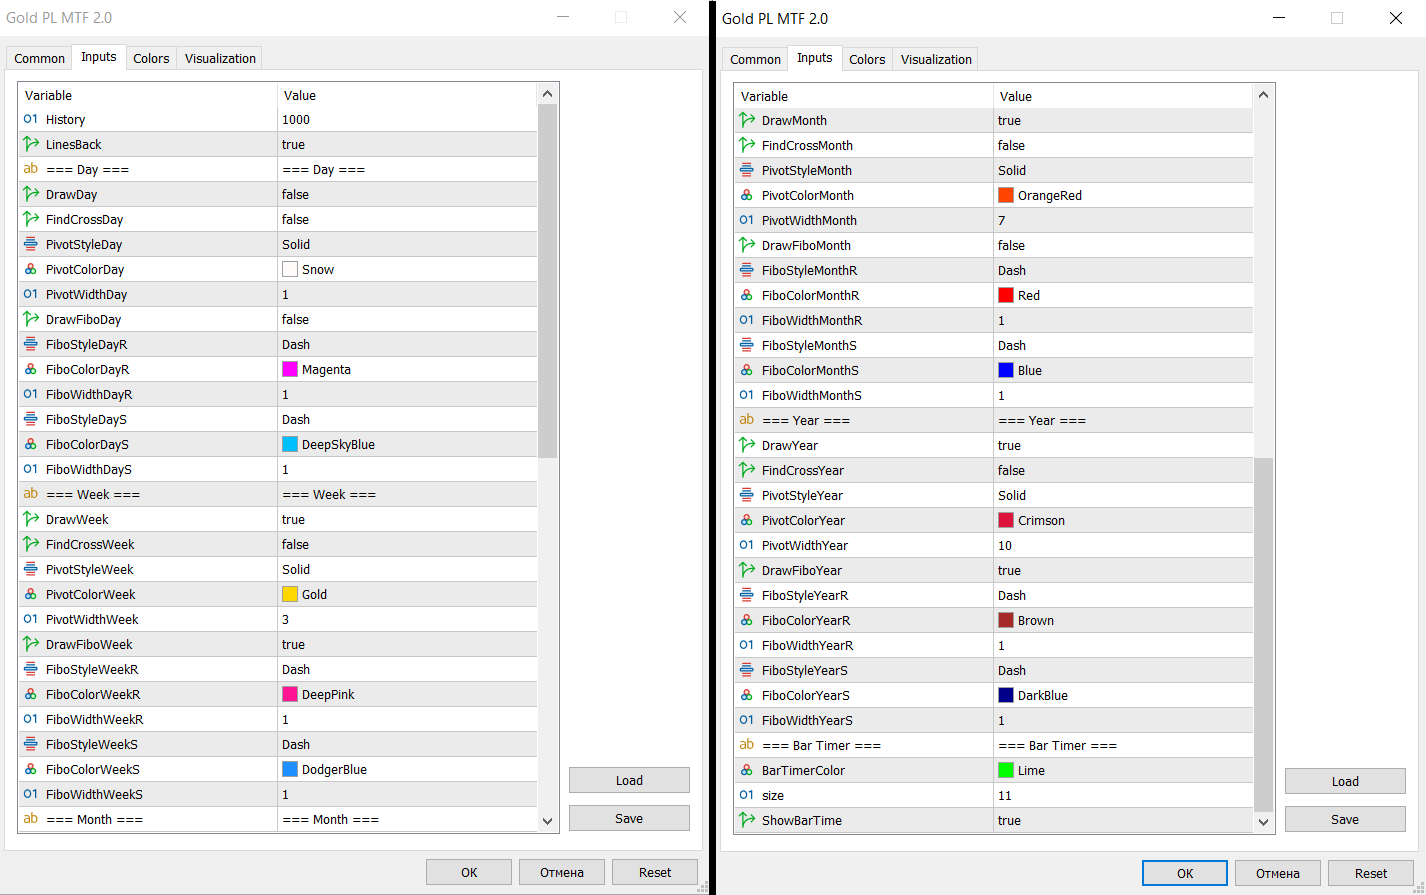
- Individual parameters (TF, color etc.) are available to change in the indicator settings so that each trader can easily customize the indicator for themselves.
- The indicator can be used as an excellent main addition to your trading system, as well as an independent trading system.
Version of the Gold РL MTF indicator for MetaTrader 4
I wish you all good luck in trading and stable profit!