Adaptive Moving average EA
- Indicadores
- Nardus Van Staden
- Versão: 2.0
- Ativações: 5
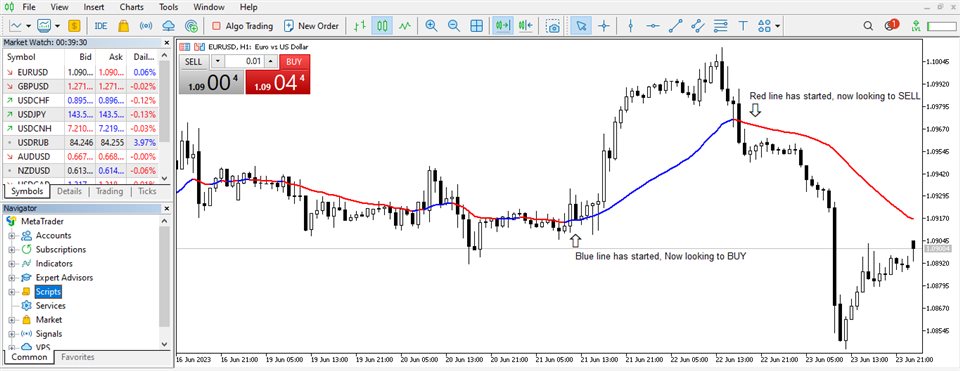
The Adaptive EMA consists of 3 lines:
Yellow, Blue and Red
If a yellow line appears, it means the market is entering Consolidation, Range, Contraction and no opportunities are available.
If a Blue line appears, It means prices are accumulating, and now being marked up, so you are now entering a buy market with a strong Bullish trend.
If a Red line appears, it means prices are now being marked down, price distribution is underway, so you are now entering a Sell market with a strong Bearish trend.
You can change the line colours as you please.
A strong and accurate piece of software for its price, developed for beginner and experienced traders.
Accuracy= 97%
