• Visão global
  • Comentários
  • Discussão (1)
  • O que há de novo

Trend Sensor MT5

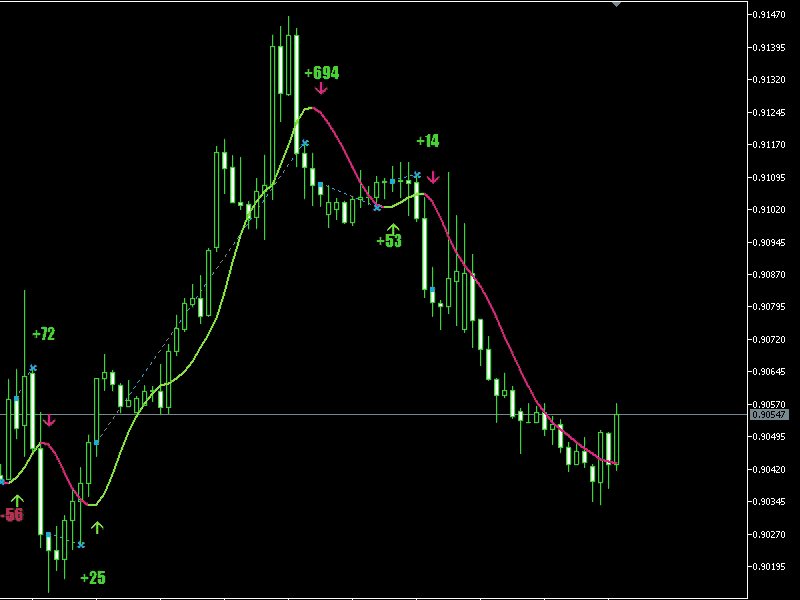
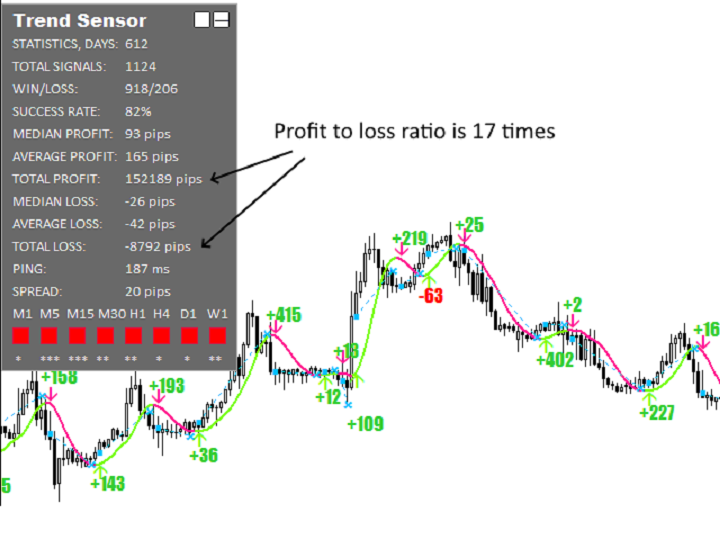
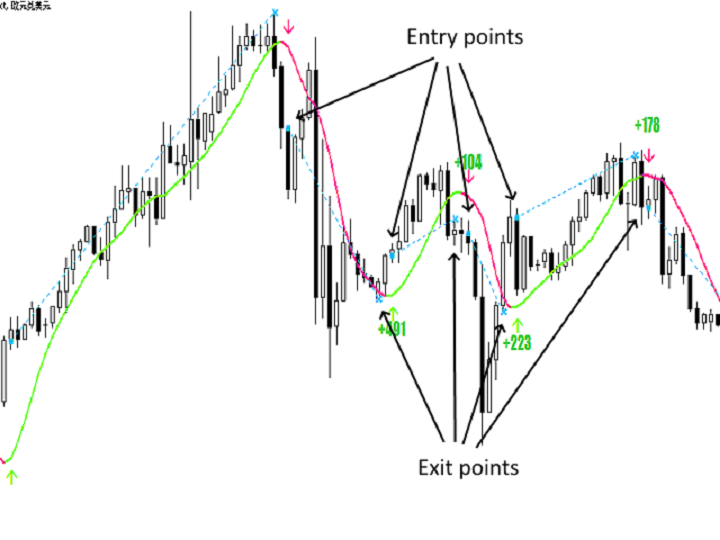
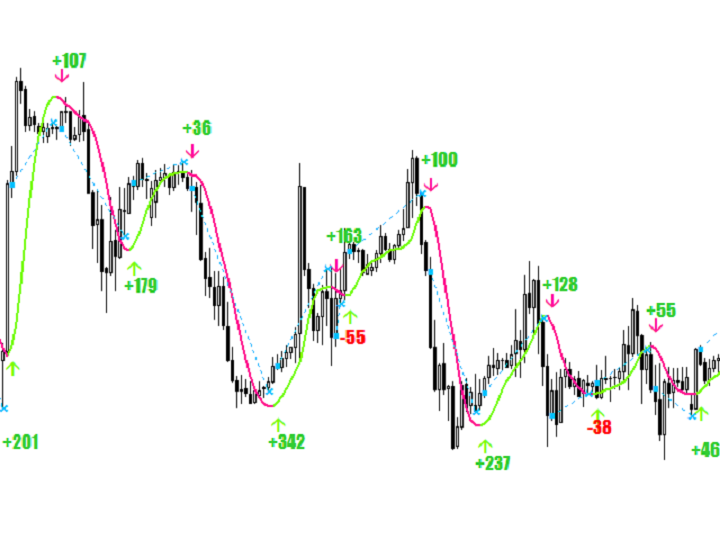
O indicador mostra os pontos de entrada e saída mais adequados. Também apresenta dados estatísticos sobre todos os sinais para uma melhor análise da negociação.
Com a ajuda deste indicador, será capaz de compreender melhor o mercado.

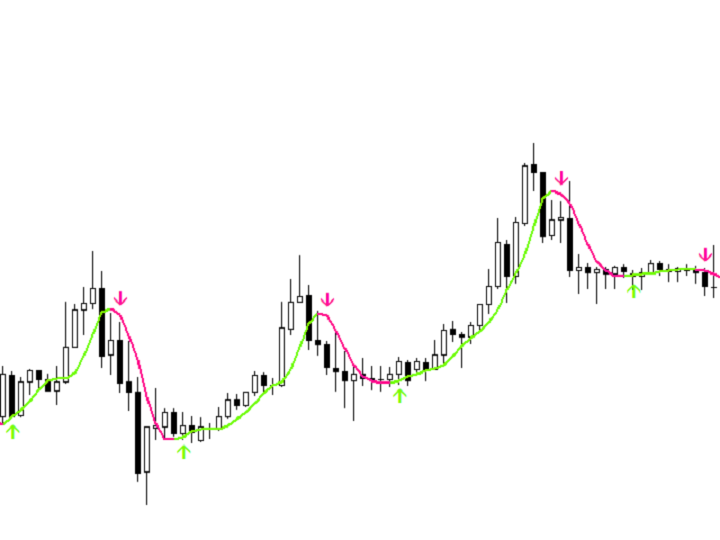
Assim que a força da tendência começar a enfraquecer (isto será mostrado no painel), a linha de tendência gravitará para a posição horizontal - este é o sinal para sair da transação. Ou pode sair quando o nível de lucro médio/mediano for atingido.

O indicador foi o resultado da minha experiência de negociação desde 2010.

Versão do indicador para MT4

Características

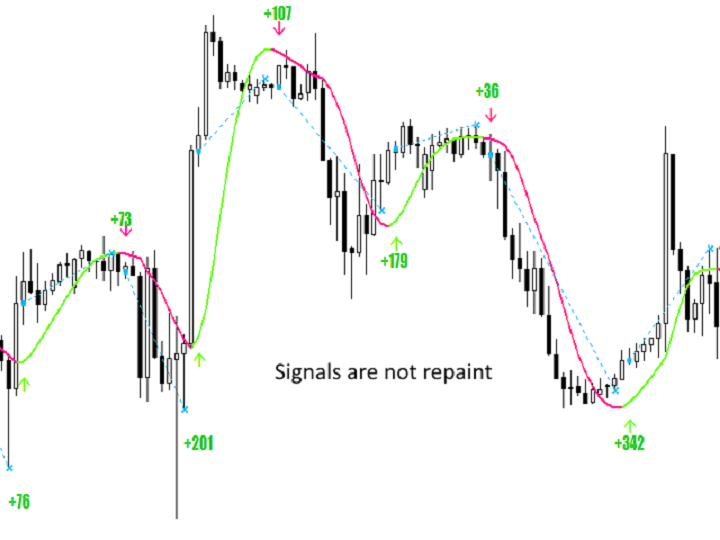
  • Este indicador não é redesenhado. O que é impresso no gráfico histórico também será impresso em tempo real.
  • Pode ser usado para negociar quaisquer ativos: criptomoedas, ações, metais, índices, commodities e moedas.
  • Funciona em todos os períodos de tempo.
  • Os sinais para entrar aparecem na abertura de uma nova vela.
  • Os sinais para sair da negociação são dados provisoriamente, porque muitas vezes você pode fechar a negociação com um lucro maior.
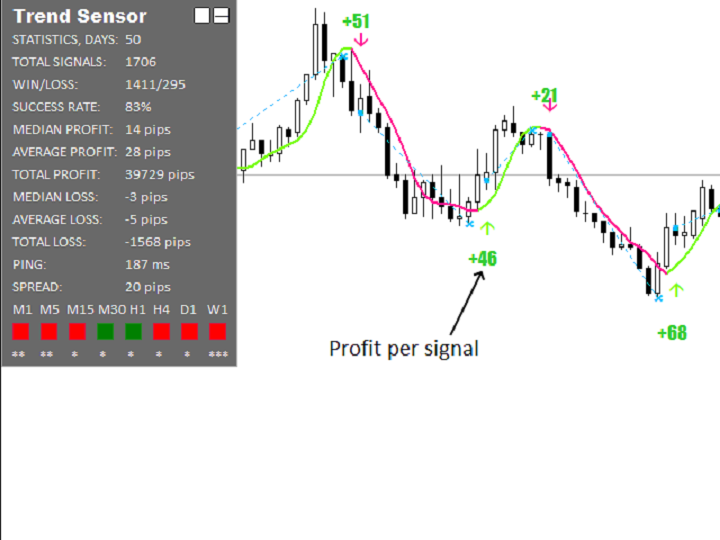
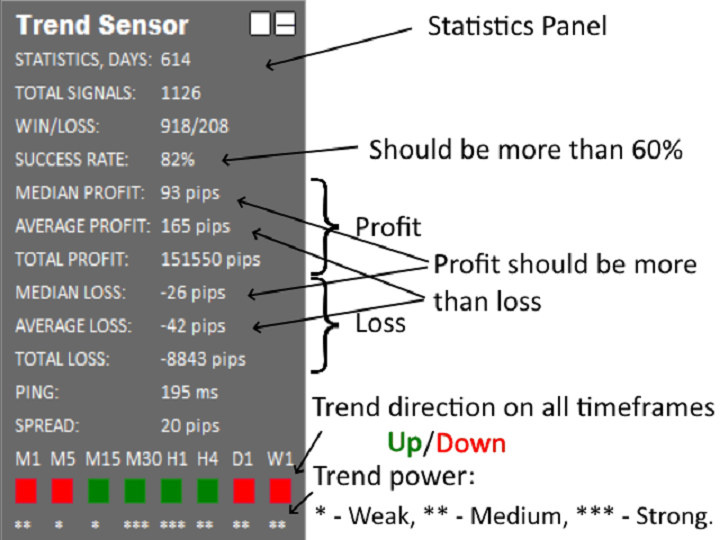
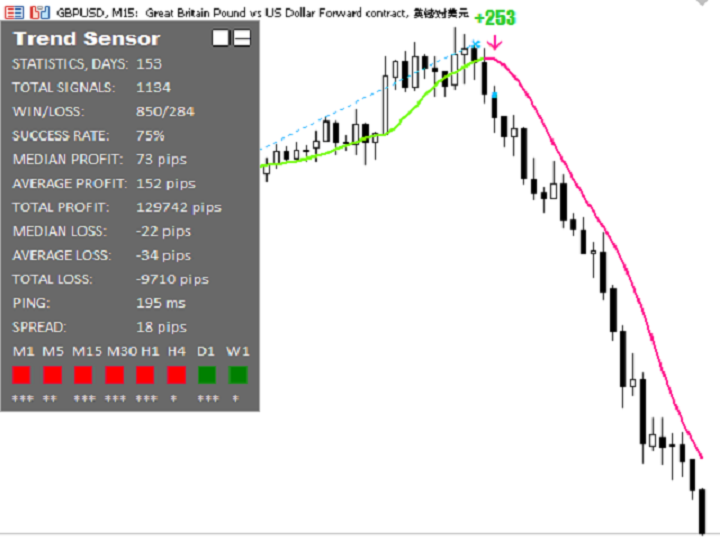
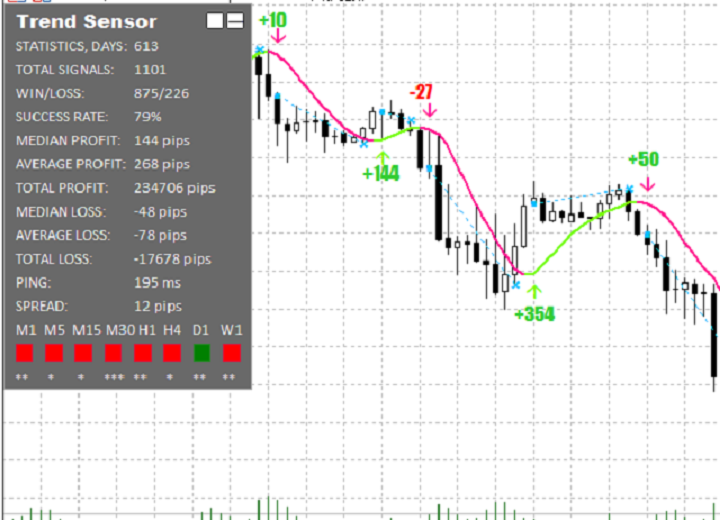
  • No canto superior esquerdo há um painel detalhado de estatísticas de negociação, que pode ser minimizado.
  • Mostra a direção da tendência e a sua potência de uma vez em timeframes de M1 a W1.
  • Tem um código leve, por isso não carrega e não torna o terminal mais lento.
  • Utiliza uma fórmula especial para calcular a média móvel, que determina a direção da tendência. 
  • Para não perder um sinal para entrar numa transação, pode receber notificações na janela Alerta e no Push.
  • Para utilizadores de todos os níveis, desde principiantes a especialistas.

Painel de estatísticas

  1. Número de dias a partir dos quais o histórico de sinais é obtido.
  2. O número total de sinais sobre os quais as estatísticas são dadas.
  3. A proporção do número de sinais lucrativos e perdedores.
  4. A percentagem da quantidade total de sinais lucrativos.
  5. Lucro mediano por sinal.
  6. Lucro médio por sinal.
  7. Lucro total de todos os sinais.
  8. Perda mediana por sinal.
  9. Perda média por sinal.
  10. Perda total de todos os sinais.
  11. Último ping para o servidor do corretor.
  12. Spread atual.
  13. Direção da tendência UP/DOWN em timeframes de M1 a W1.
  14. Mede o poder da tendência:   * Fraca   ** Média   *** Forte.

Parâmetros

Trading style
Agressivo
Médio
Seguro
(sensibilidade do indicador, quanto mais sensível, mais sinais)
Working hours
horas de trabalho do indicador em que aparecem os sinais de intervalo para entrar no mercado
(o formato da hora deve ser xx:xx-xx:xx, por exemplo, 00:00-23:59)
Show statistics
on/off mostra o painel de estatísticas dos sinais no canto superior esquerdo do gráfico
Show line
on/off mostrar linha de tendência
Show arrows
on/off mostrar setas quando a tendência muda
Show entry/exit
on/off mostrar pontos de entrada e saída do mercado
Use alert notification
on/off janela pop-up com notificação e notificação sonora
Use push notification
on/off notificação push

Se tiver alguma dúvida ou dificuldade, envie-me uma mensagem privada.

Produtos recomendados
Skiey
Vitalii Zakharuk
Skiey - Indicator of easy solutions! Using this indicator is very simple, since the simplest is to look at the chart and act according to the color arrows. Such a calculation option takes into account intraday price fluctuations and focuses on measuring the "candlestick" share in the trend. The algorithm takes into account the measurement of prices, this method also emphasizes the measurement of each of the price drops (H / C, H / O, LC, LO) - which gives more detailed information but also mor
Easy Buy Sell Signal
Franck Martin
4.85 (46)
Easy Buy Sell is a market indicator for opening and closing positions. It becomes easy to track market entries with alerts. It indicates trend reversal points when a price reaches extreme values ​​and the most favorable time to enter the market. it is as effective as a Fibonacci to find a level but it uses different tools such as an algorithm based on ATR indicators and Stochastic Oscillator. You can modify these two parameters as you wish to adapt the settings to the desired period. It cannot
FREE
MTF MultiMeter5
GRANTLEY LAURENCE CAUSE
Benefits: A new and innovative way of looking across multiple timeframes and multiple indicators on any chart. Provides instant multi-timeframe analysis of any market. i.e. forex currency pairs, cryptocurrency pairs, commodities, etc. It offers precise indications across multiple timeframes of volatility as measured by RSI, ADX and STOCH within one chart. Helps you determine high probability trading setups. See example strategy in comments. Can see bullish/bearish volatility building across mult
Gann Box MT5
Frederic Jacques Collomb
O indicador Gann Box é uma ferramenta poderosa e versátil projetada para ajudar os traders a identificar e explorar os níveis-chave do mercado. Este indicador permite desenhar um retângulo no gráfico, que é automaticamente dividido em várias zonas com níveis estratégicos 0, 0.25, 0.50, 0.75, 1 . Quando o preço atinge um desses níveis, alarmes são acionados, oferecendo assim uma ajuda valiosa para as decisões de trading. Você sabe instantaneamente como o mercado está evoluindo em relação à zona q
TREND HARMONY MT5 – Multi Timeframe Trend and Phase and Pullback Level Visualizer indicator for Metatrader5 The TREND HARMONY indicator automates deep trend analysis and generates visualizations for you. Take control of your trades by eliminating uncertainty! Revolutionize your trading experience with precision and insight through the TREND HARMONY Multi Timeframe indicator – your ultimate MT5 trend visualization indicator. [  Features and Manual   | MT4 version |   All Products   ] Are you tir
Maximum Minimum Candle Indicator
Carlos Daniel Vazquez Rosas
5 (1)
Maximum Minimum Candle indicator  is a basic indicator (but useful) that shows the highest and lowest candle in a period of time . The indicator shows the maximum candle and the minimum candle for a defined period of time. You can choose the number of candles that make up the period The indicator will show with color points  the maximum and minimum values. A message tells you when the price reaches the maximum or minimum. Parameters number_of_candles: It is the number of candles that will be c
FREE
Previous Candle Levels MT5
Wachinou Lionnel Pyrrhus Sovi Guidi
Previous Candle Levels MT5 shows the previous candle levels, it shows the previous candle Open High Low Close levels (OHLC Levels) in different time frame. It's designed to help the trader to analyse the market and pay attention to the previous candle levels in different time frame.  We all know that the OHLC Levels in Monthly, Weekly and Daily are really strong and must of the time, the price strongly reacts at those levels. In the technical analysis, the user can use them as a support and res
FREE
AXIS Neural EA for MT5
Enrique Enguix
4.89 (9)
Você vai continuar vendo como outros ganham ou vai entrar de verdade no jogo? NODE Neural EA foi o aquecimento. AXIS é o jogo de verdade. É aqui que você começa a jogar a sério. AXIS Neural EA Isso não é apenas mais um EA. É o sistema usado pelos traders que sabem o que estão fazendo. Opera em EUR/USD, GBP/USD e AUD/USD – Não só diversifica, mas maximiza suas oportunidades nos pares mais líquidos. Rentabilidade mensal histórica de 4,74 % – Dados reais, não simulações ou promessas infladas. Preci
Introducing   Order Blocks Breaker , a brand-new way to identify and leverage order blocks in your trading strategy. After developing multiple order block tools with unique concepts, I’m proud to present this tool that takes things to the next level. Unlike previous tools,   Order Blocks Breaker   not only identifies order blocks but also highlights   Breaker Order Blocks —key areas where the price is likely to retest after a breakout. MT4 -  https://www.mql5.com/en/market/product/124101/ This t
Rejection Block
Usiola Oluwadamilol Olagundoye
5 (1)
The "Rejection Block" MetaTrader 5 Indicator offers traders a comprehensive tool for identifying and visualizing rejection candlestick patterns, commonly known as rejection blocks. These patterns are pivotal in discerning potential market reversals or continuations, making them invaluable for traders seeking to enhance their analysis. Key Features: Rejection Block Detection: The indicator diligently scans price data, pinpointing instances of rejection candlestick patterns. These patterns typical
FREE
Aqui estão os resultados do teste forward. (MT4 ver.) USDJPY Trend Surfer é uma ferramenta de negociação inovadora projetada como um EA (Expert Advisor) de acompanhamento de tendências. Este EA captura com precisão a tendência do USDJPY combinando múltiplas SMAs (Médias Móveis Simples), RSI (Índice de Força Relativa) e StdDev (Desvio Padrão). Ao utilizar várias SMAs, ele analisa simultaneamente as tendências em diferentes períodos e, ao combinar indicadores como RSI e StdDev, detecta condições d
QuantNas100
Thiago Levi Azevedo Valente
Inicie o Ano de 2024 da forma perfeita aproveitando o EA Quantitativo que performou resultados maravilhosos os anos anteriores (inclusive 2023)no Índice NASDAQ (NAS100)! Não é um EA de alta frequência. São poucas operações. Mas são operações muito precisas, onde o EA analisa o preço/volume anteriores para entender o movimento e momento atual. Vídeo TP/SL Mensal = 10%   https://www.youtube.com/watch?v=dwgEMMEIIPc Vídeo TP/SL Mensal   = 20%   https://www.youtube.com/watch?v=u0bxfyCbmpU Leia As
E2C Lines
Eduardo Cristian De Carvalho
Descubra o poder do nosso indicador de alta precisão, projetado para identificar as regiões de alvo e exaustão de qualquer ativo. Testado e validado por mais de 3 anos nos mercados de mini dólar e mini índice, ele oferece confiabilidade e eficácia incomparáveis. Transforme sua estratégia de trading e alcance novos patamares de sucesso com nossa ferramenta inovadora.
Xtrade Trend Detector
Dago Elkana Samuel Dadie
Xtrade Trend Detector is an indicator capable of finding the best opportunities to take a position in any stock market. Indeed, it is a great tool for scalpers but also for Daytraders. You could therefore use it to identify areas to trade, it fits easily on a chart. I use it to detect trends on Big timeframes and take positions on Small timeframes. Don't hesitate to give me a feedback if you test it.
In finance, a moving average (MA) is a stock indicator that is commonly used in   technical analysis . The reason for calculating the moving average of a stock is to help smooth out the price data by creating a constantly updated   average price . This Indicator determines the current time frame and calculates 3 moving averages from the next 3 available time frames. You can put this indicator on M1, M5, M15, M30, H1 and H4 TF. Blue and Magenta Arrows show the moment to go Long or Short accordi
MetaCOT 2 is a set of indicators and specialized utilities for the analysis of the U.S. Commodity Futures Trading Commission reports. Thanks to the reports issued by the Commission, it is possible to analyze the size and direction of the positions of the major market participants, which brings the long-term price prediction accuracy to a new higher-quality level, inaccessible to most traders. These indicators, related to the fundamental analysis, can also be used as an effective long-term filter
Highest High and Lowest Low (HH_LL) Indicator Description: The HH_LL Indicator is a trading tool designed to help traders identify key market points by automatically drawing Higher High (HH) and Lower Low (LL) lines across multiple timeframes. This indicator allows traders to easily spot significant levels on the chart, facilitating more accurate trading decisions. Key Features: Multi-Timeframe Analysis: The indicator supports various timeframes, including M30, H1, and H4. This enables traders t
FREE
ZigZag Expert
Almat Kaldybay
ZigZag Expert is a robot that trades on the signals of the ZigZag indicator. The decision to enter the market is made by the signal of the trend system of the continuation model. See pictures and videos for more details. Program input parameters: Choose tf - you need to specify the period for which the market will be monitored (recommended H4 and older); Depth of ZigZag - the first parameter of the ZigZag indicator (recommended from 4 to 8); Deviation of ZigZag - the second parameter of the Zi
Trade Results By Magic Number
Abd Al Mouhemen Mo Haj Madoun
Do Youe use Multi Epert Advisor? You need this Indicator ... TradeResultsByMagic Overview This indicator creates a detailed trading report in a separate window, displaying performance metrics for trades grouped by magic numbers across multiple symbols. It shows various metrics including deal counts, lot sizes, prices, profits, win rates, and exposure percentages. Key Features Tracks multiple magic numbers (up to 1024) Supports multiple symbols per magic number (up to 100 per magic) Displays cus
This indicator, named Edyx_Candle_Size, is designed to be used with the MetaTrader 5 trading platform. It displays the size of the candlestick body for the current timeframe as a histogram. The indicator does not provide any specific trading signals or recommendations Measures the size of of the candlestick. That is the difference between the open and close as the case may be for either a bullish or a bearish candle. This can be use to filter out entry position as to maximise profit and minimis
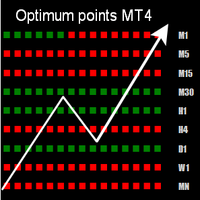
O indicador mostra a direção da tendência de vários períodos de tempo numa janela. Se a tendência de vários períodos de tempo coincidir, são desenhadas setas. Também pode mudar para o histograma, indicando a tendência no período de tempo atual. O indicador desenha pontos de entrada e pontos de saída aproximados no gráfico. Aviso: uma vez que o indicador é multi-timeframe, quando utilizado no testador de estratégias, as cotações para todos os timeframes necessários devem ser descarregadas antec
Engulfing Candle Indicator
Chioma Obunadike
3.2 (5)
This Engulfing Candle Indicator as the name implies can detect engulfing candlestick patterns on the chart. The indicator alerts the user of the presence of an engulfing candle (Bearish engulfing candle and Bullish engulfing candle) by using visual representation of arrows on the chart.  - Blue arrow for Bullish engulfing - Red arrow for Bearish engulfing Extra modifications can be added based on request.
FREE
Description: The Wall of Worry indicator allows you to assess market sentiment and possible reversals. The indicator represents three lines that are displayed in a separate window. Black line (trend) - the amount of volumes in the candle body. Red line (bears) - the amount of volumes in the upper shadow of the candlestick. Blue line (bulls) - the amount of volumes in the lower shadow of the candle. The idea is based on "Wall of Worry" - this is the periodic tendency of financial markets to
Entry IQ MT5
Michael Prescott Burney
5 (1)
The Entry IQ Indicator is a technical analysis tool designed to assist traders in identifying potential entry points for long and short positions. It utilizes dynamic price boxes, equilibrium zones, and trend detection algorithms to analyze market trends and price movements. The indicator adapts to different broker price digit formats, provides customizable arrow signals, and plots real-time trendlines to refine signal accuracy. By assessing price action over a specific lookback period, Entry I
FREE
God Spike Boom
Pedro Luis Oiaz Villamar
Aqui vem a você o indicador que vai revolucionar a negociação com índices sintéticos BOOM na plataforma de negociação Deriv mt5. Deus Spike Boom. Características principais: Funciona apenas em índices BOOM. Possui filtro de tendência. Envie alertas apenas quando o mercado estiver em alta. Alertas sonoros. Você pode enviar alertas para celular. Modo de uso: Aplicar nas temporalidades de m1 e m5 Aguarde o alerta sonoro. Analise se há uma tendência forte ou que já começou. Não tome alerta
Congestion Breakout MT5
CARLO FINANCIAL SOFTWARE TECHNOLOGY LLC
Introducing "Congestion Breakout MT5" - the indicator that helps you identify congestion zones in your chart and alerts you when the price breaks through them.   Traders know that congestion zones can be key areas of price action and can indicate potential turning points in the market. However, spotting these zones and anticipating breakouts can be a difficult and time-consuming task. That's where "Congestion Breakout" comes in. This powerful indicator uses advanced algorithms to analyze the pri
Aussenstab Markttechnik
Alexander Josef Zeidler
This indicator shows external bars ("Aussenstäbe") in the chart in candle form. The colors of the candles can be set individually. Also different colors for bearish and bullish bars are possible. In addition, the color of the wicks or outlines is also adjustable. Outside bars are mentioned e.g. by Michael Voigt in the book "Das große Buch der Markttechnik". All other candles are inner bars.
BOT Simles ea
Goyani Parth Ghanshyambhai
BOT SMILES EA   IS MADE OUT OF LOVE AND EMPOWERMENT. ONLY FOR FEW BUYERS THAT IS THE REASON OF THE PRICE . BOT SMILES EA  is an aggressive  multi-cycle  scalper designed for  EURUSD M1 . Each cycle is  independent.  it uses a sequence of orders and has its own  TP  and  SL . It uses a  martingale  system. This EA is using  strong recurrences  of the past to take position and achieve a  high success rate . MODELLING :-  1 minute OHLC INPUTS:-  Buy default...........    Check Drawdown Then BUY..
FREE
the fundamental technical indicator Informative Trend, which allows you to assess the current market situation in order to enter the market of the selected currency pair in a trend and with minimal risk. It basically uses the process of identifying the rate of change in price growth and allows you to find entry and exit points from the market. The indicator was created on the basis of the original indicators for searching for extreme points and is well suited for determining a reversal or a la
XP Speed Meter the best indicator that measures the price/tick’s currency speed for you. It will give you the ability to know when the pair moving fast or slow . So, you can trade or not trade. It’s very important tool for scalper traders – news traders. Even for trend traders it will be useful to know if the market is trending fast or slow . XP Speed Meter is better than the volume type indicators of course. Because it shows the currency speed on the run-time without any lacking like what the v
Os compradores deste produto também adquirem
Moneytron — профессиональный сигнальный индикатор тренда Индикатор Moneytron предназначен для тех, кто хочет зарабатывать стабильно и системно, торгуя по тренду. Он автоматически определяет: • Точки входа (Buy/Sell сигналы) • 3 уровня тейк-профита (TP1, TP2, TP3) • 3 уровня стоп-лосса (SL1, SL2, SL3) • Показывает реальную статистику успешности сделок прямо на графике Особенности: • Работает на всех валютных парах и металлах • Идеален для таймфреймов M30, H1 и выше • Подходит как для начинающи
TPSproTREND PrO MT5
Roman Podpora
4.72 (18)
VERSION MT4        —        ИНСТРУКЦИЯ RUS           —        INSTRUCTIONS  ENG Principais funções: Sinais de entrada precisos SEM RENDERIZAÇÃO! Se aparecer um sinal, ele permanece relevante! Esta é uma diferença importante em relação aos indicadores de redesenho, que podem fornecer um sinal e depois alterá-lo, o que pode levar à perda de fundos depositados. Agora você pode entrar no mercado com maior probabilidade e precisão. Também existe a função de colorir as velas após o aparecimento da set
TPSpro RFI Levels MT5
Roman Podpora
4.55 (20)
INSTRUÇÕES         Russo   -        ENG       R   ecomendado para uso com um indicador       -       TPSpro   TREND PRO -   Versão MT4         Principais funções:: Exibindo zonas ativas para vendedores e compradores! O indicador mostra todos os níveis/zonas de impulso inicial corretos para compra e venda. Após a ativação desses níveis/zonas, onde a busca por pontos de entrada começa, os níveis mudam de cor e são preenchidos com tons específicos. Além disso, setas aparecem para uma compreensão m
Quantum TrendPulse
Bogdan Ion Puscasu
5 (13)
Apresentando   Quantum TrendPulse   , a ferramenta de negociação definitiva que combina o poder do   SuperTrend   ,   RSI   e   Stochastic   em um indicador abrangente para maximizar seu potencial de negociação. Projetado para traders que buscam precisão e eficiência, este indicador ajuda você a identificar tendências de mercado, mudanças de momentum e pontos de entrada e saída ideais com confiança. Principais características: Integração SuperTrend:   siga facilmente a tendência predominante do
CBT Quantum Maverick Sistema de Negociação de Opções Binárias de Alta Eficiência O CBT Quantum Maverick é um sistema de opções binárias de alto desempenho, projetado para traders que buscam precisão, simplicidade e um enfoque disciplinado. Não exige personalização: o sistema está otimizado para resultados eficazes desde o início. Basta seguir os sinais, que podem ser dominados com um pouco de prática. Principais características: Precisão nos sinais: Sinais baseados na próxima vela, utilizando
Royal Scalping Indicator M5
Vahidreza Heidar Gholami
5 (6)
Royal Scalping Indicator is an advanced price adaptive indicator designed to generate high-quality trading signals. Built-in multi-timeframe and multi-currency capabilities make it even more powerful to have configurations based on different symbols and timeframes. This indicator is perfect for scalp trades as well as swing trades. Royal Scalping is not just an indicator, but a trading strategy itself. Features Price Adaptive Trend Detector Algorithm Multi-Timeframe and Multi-Currency Trend Low
Timeframes Trend Scanner   is a trend analyzer or trend screener indicator that helps you know the trend in   all timeframes of selected symbol you are watching . This indicator provides clear & detailed analysis results on a beautiful dashboard, let you able to use this result right away without need to do any additional analysis. How it works Step 1: Calculate values of 23 selected & trusted technical indicators (Oscillator & Moving Average indicators) Step 2: Analyze all indicators using bes
KT Trend Trading Suite MT5
KEENBASE SOFTWARE SOLUTIONS
O KT Trend Trading Suite é um indicador multifuncional que combina uma estratégia de acompanhamento de tendência com múltiplos pontos de rompimento como sinais de entrada. Assim que uma nova tendência é estabelecida, o indicador oferece várias oportunidades de entrada para aproveitar o movimento. Um limite de recuo é utilizado para evitar entradas menos significativas. Versão para MT4 disponível aqui  https://www.mql5.com/en/market/product/46268 Recursos Combina diversas dinâmicas de mercad
Visual Heatmap Book Analyzer
Alexandre Moraes De Souza Lima
Visual Heatmap Book Analyser Este indicador revolucionário monitora efetivamente a liquidez do mercado e gera as cores a partir de ordens de padrões de quantidades e atividades de renovações no livro. Isso permite que você visualize o fluxo de ordens e identifique áreas de alta e baixa liquidez e alta e baixa atividade. O indicador utiliza técnicas machine learning para analisar o comportamento das ordens no livro. Isso significa que ele pode detectar padrões e tendências nas ordens, permitind
[ MT4 Version ] Are you tired of spending months on demo or live accounts to test your trading strategies? The Backtesting Simulator is the ultimate tool designed to elevate your backtesting experience to new heights. Utilizing Metatrader historical symbol information, it offers an unparalleled simulation of real market conditions. Take control of your testing speed, test ideas quickly or at a slower pace, and witness remarkable improvements in your testing performance. Forget about wasting tim
Pro Thunder V10: O Indicador Definitivo para Operações de Opções Binárias! Eleve seu trading a outro nível com o Pro Thunder V10 , o auge das operações em opções binárias. Alimentado pela avançada tecnologia de Redes Neurais com IA , este indicador revolucionário foi projetado para oferecer precisão e confiabilidade incomparáveis. Desde sinais em tempo real que não repintam até um desempenho impecável em mercados voláteis, o Pro Thunder V10 é o seu companheiro definitivo para o sucesso
MetaForecast M5
Vahidreza Heidar Gholami
5 (3)
MetaForecast prevê e visualiza o futuro de qualquer mercado com base nas harmonias nos dados de preços. Embora o mercado nem sempre seja previsível, se houver um padrão nos preços, o MetaForecast pode prever o futuro com a maior precisão possível. Em comparação com outros produtos similares, o MetaForecast pode gerar resultados mais precisos ao analisar as tendências do mercado. Parâmetros de entrada Past size (Tamanho do passado) Especifica o número de barras que o MetaForecast usa para criar
PZ Trend Trading MT5
PZ TRADING SLU
3.8 (5)
O Trend Trading é um indicador projetado para lucrar o máximo possível com as tendências que ocorrem no mercado, cronometrando retrocessos e rupturas. Ele encontra oportunidades de negociação analisando o que o preço está fazendo durante as tendências estabelecidas. [ Guia de instalação | Guia de atualização | Solução de problemas | FAQ | Todos os produtos ] Negocie mercados financeiros com confiança e eficiência Lucre com as tendências estabelecidas sem ser chicoteado Reconhecer retrocessos
RelicusRoad Pro MT5
Relicus LLC
4.78 (18)
Agora US $ 147 (aumentando para US $ 499 após algumas atualizações) - Contas ilimitadas (PCs ou Macs) Manual do usuário do RelicusRoad + vídeos de treinamento + acesso ao grupo de discórdia privado + status VIP UMA NOVA FORMA DE OLHAR PARA O MERCADO O RelicusRoad é o indicador de negociação mais poderoso do mundo para forex, futuros, criptomoedas, ações e índices, oferecendo aos traders todas as informações e ferramentas necessárias para se manterem rentáveis. Fornecemos análises técnicas e
This indicator is based on the mathematics of the great trader W.D. Ganna. With its help, you can easily find strong levels by analyzing swings to find the optimal entry point. The indicator works on all instruments and all timeframes. The indicator is fully manual and has control buttons. All you need to do is press the NEW button, a segment will appear, which you can place on any movement, swing or even 1 candle that you want to analyze. By placing the segment, press the OK button. A grid (th
CONTACT US  after purchase to get the Indicator Manual. Try Now—Limited Discount for the next 10 Buyers! Download the  Metatrader 4 Version Read the product description carefully before purchasing the product.  Due to regulatory restrictions, our service is unavailable in certain countries such as India, Pakistan, and Bangladesh. Disclaimer: • Our products are available only on mql5.com. • We never contact anyone or sell our products privately. • We do not provide any personal trading advice.
This indicator identifies and displays zones, as it were areas of strength, where the price will unfold. The indicator can work on any chart, any instrument, at any timeframe. The indicator has two modes. The indicator is equipped with a control panel with buttons for convenience and split into two modes. Manual mode: To work with manual mode, you need to press the NEW button, a segment will appear. This segment is stretched over the movement and the LVL button is pressed. The level is displayed
Advanced Supply Demand MT5
Bernhard Schweigert
4.5 (14)
Atualmente com 33% de desconto! A melhor solução para qualquer Trader Novato ou especialista! Este indicador é uma ferramenta de negociação exclusiva, de alta qualidade e acessível porque incorporamos uma série de recursos proprietários e uma nova fórmula. Com esta atualização, você poderá mostrar fusos horários duplos. Você não só será capaz de mostrar um TF mais alto, mas também mostrar ambos, o TF do gráfico, MAIS o TF mais alto: MOSTRANDO ZONAS ANINHADAS. Todos os traders de Oferta e Demanda
Was: $249  Now: $149   Market Profile defines a number of day types that can help the trader to determine market behaviour. A key feature is the Value Area, representing the range of price action where 70% of trading took place. Understanding the Value Area can give traders valuable insight into market direction and establish the higher odds trade. It is an excellent addition to any system you may be using. Inspired by Jim Dalton’s book “Mind Over Markets”, this indicator is designed to suit the
LIMITED! JUST 10 COPIES AVAILABLE!  BONUS AUX VIP Club 2024 : Include EA CAP, CEP, LDH, PSC307 & AO4C to enhance the performance of this tool to its maximum potential  Click Here to Download Files   ( for users only ) FREE Trading Education Available Daily via Zoom --- For More Info or Instant Message Click link ---  https://t.me/abcdwave Transform your trading with the "Five Magic Bullets" Indicator, tailored for traders who embrace the power of Elliott Wave Chaos Theory. Spec
Blahtech Supply Demand MT5
Blahtech Limited
4.54 (13)
Was: $299  Now: $149  Supply Demand uses previous price action to identify potential imbalances between buyers and sellers. The key is to identify the better odds zones, not just the untouched ones. Blahtech Supply Demand indicator delivers functionality previously unavailable on any trading platform. This 4-in-1 indicator not only highlights the higher probability zones using a multi-criteria strength engine, but also combines it with multi-timeframe trend analysis, previously confirmed swings
Descubra os verdadeiros padrões ocultos do mercado com o Sistema de Trading PREDATOR AURORA —o chefe final dos indicadores de trading híbridos. Veja o que os outros não veem! O Sistema de Trading PREDATOR AURORA é uma potência projetada para aqueles que se recusam a se acovardar nas sombras da mediocridade. Este não é apenas mais um indicador; é o código de trapaça; é sua vantagem injusta, um sofisticado sistema híbrido de caça que rastreia os movimentos do mercado com precisão letal em uma
PZ Swing Trading MT5
PZ TRADING SLU
5 (5)
Swing Trading é o primeiro indicador projetado para detectar oscilações na direção da tendência e possíveis oscilações de reversão. Ele usa a abordagem de negociação de linha de base, amplamente descrita na literatura de negociação. O indicador estuda vários vetores de preço e tempo para rastrear a direção da tendência agregada e detecta situações nas quais o mercado está sobrevendido ou sobrecomprado em excesso e pronto para corrigir. [ Guia de instalação | Guia de atualização | Solução de prob
TPA True Price Action indicator reveals the true price action of the market makers through 100% non-repainting signals strictly at the close of a candle! TPA shows entries and re-entries, every time the bulls are definitely stronger than the bears and vice versa. Not to confuse with red/green candles. The shift of power gets confirmed at the earliest stage and is ONE exit strategy of several. There are available now two free parts of the TPA User Guide for our customers. The first "The Basics"
Elliott Wave Trend was designed for the scientific wave counting. This tool focuses to get rid of the vagueness of the classic Elliott Wave Counting using the guideline from the template and pattern approach. In doing so, firstly Elliott Wave Trend offers the template for your wave counting. Secondly, it offers Wave Structural Score to assist to identify accurate wave formation. It offers both impulse wave Structural Score and corrective wave Structure Score. Structural Score is the rating to sh
Royal Wave Pro M5
Vahidreza Heidar Gholami
3.5 (4)
Royal Wave is a Trend-Power oscillator which has been programmed to locate and signal low-risk entry and exit zones. Its core algorithm statistically analyzes the market and generates trading signals for overbought, oversold and low volatile areas. By using a well-designed alerting system, this indicator makes it easier to make proper decisions regarding where to enter and where to exit trades. Features Trend-Power Algorithm Low risk Entry Zones and Exit Zones Predictions for Overbought and Over
Introduction to Fractal Pattern Scanner Fractal Indicator refers to the technical indicator that makes use of the fractal geometry found in the financial market. Fractal Pattern Scanner is the advanced Fractal Indicator that brings the latest trading technology after the extensive research and development work in the fractal geometry in the financial market. The most important feature in Fractal Pattern Scanner is the ability to measure the turning point probability as well as the trend probabil
Hello I Want to introduce The Forex Buy Sell Arrow Premium MT5 i recently release this premium indicator! its 1000% Non Repaint Indicator, It Work Perfectly Well,, i tested it day by day, Just mind blowing Result,  Including Powerful trend Algorithm! How It Work? well, it work market trend formula, when trend Bullish Or when trend Bearish,  Recommend Timeframe M30, H1 it work all timeframe, and all currency pair, 100% non repaint, How to take signal From Forex Buy Sell Arrow Premium Ind
Volume by Price MT5
Brian Collard
3.25 (4)
Volume Profile, Footprint and Market Profile TPO (Time Price Opportunity). Volume and TPO histogram bar and line charts. Volume Footprint charts. TPO letter and block marker collapsed and split structure charts. Static, dynamic and flexible range segmentation and compositing methods with relative and absolute visualizations. Session hours filtering and segment concatenation with Market Watch and custom user specifications. Graphical layering, positioning and styling options to suit the user's a
Apresentando       Quantum Breakout PRO   , o inovador Indicador MQL5 que está transformando a maneira como você negocia Breakout Zones! Desenvolvido por uma equipe de traders experientes com experiência comercial de mais de 13 anos,       Quantum Breakout PRO       foi projetado para impulsionar sua jornada comercial a novos patamares com sua estratégia de zona de fuga inovadora e dinâmica. O Quantum Breakout Indicator lhe dará setas de sinal em zonas de breakout com 5 zonas-alvo de lucro e su
Mais do autor
O indicador mostra a direção da tendência de vários períodos de tempo numa janela. Se a tendência de vários períodos de tempo coincidir, são desenhadas setas. Também pode mudar para o histograma, indicando a tendência no período de tempo atual. O indicador desenha pontos de entrada e pontos de saída aproximados no gráfico. Aviso: uma vez que o indicador é multi-timeframe, quando utilizado no testador de estratégias, as cotações para todos os timeframes necessários devem ser descarregadas antec
Flat finder MT4
Yuriy Lyachshenko
Este indicador detecta um flat e pinta a área encontrada com um retângulo colorido. A ideia principal deste indicador é detetar um flat quando o preço preenche uma determinada área no gráfico. Parâmetros de entrada: Color rectangle - cor do retângulo a ser sombreado. Bars in rectangle - número mínimo permitido de barras num retângulo. Density in % - densidade do flat, definida como uma percentagem da área do retângulo.
O indicador mostra os pontos de entrada e saída mais adequados. Também apresenta dados estatísticos sobre todos os sinais para uma melhor análise da negociação. Com a ajuda deste indicador, será capaz de compreender melhor o mercado. Assim que a força da tendência começar a enfraquecer (isto será mostrado no painel), a linha de tendência gravitará para a posição horizontal - este é o sinal para sair da transação. Ou pode sair quando o nível de lucro médio/mediano for atingido. O indicador foi
Flat finder
Yuriy Lyachshenko
Este indicador detecta um flat e pinta a área encontrada com um retângulo colorido. A ideia principal deste indicador é detetar um flat quando o preço preenche uma determinada área no gráfico. Parâmetros de entrada: Color rectangle - cor do retângulo a ser sombreado. Bars in rectangle - número mínimo permitido de barras num retângulo. Density in % - densidade do flat, definida como uma percentagem da área do retângulo.
Filtro:
Sem comentários
Responder ao comentário
Versão 1.30 2023.11.20
Agora você pode ajustar o tamanho da fonte.
Versão 1.20 2023.06.30
Corrigido o erro de divisão por zero.
Versão 1.10 2023.06.23
A versão 1.1 melhorou o trabalho com objectos gráficos.