Conheça o Mercado MQL5 no YouTube, assista aos vídeos tutoriais
Como comprar um robô de negociação ou indicador?
Execute seu EA na
hospedagem virtual
hospedagem virtual
Teste indicadores/robôs de negociação antes de comprá-los
Quer ganhar dinheiro no Mercado?
Como apresentar um produto para o consumidor final?
Pagamento de Expert Advisors e Indicadores para MetaTrader 5 - 81

O utilitário Fibo_Z facilita o uso das retrações e expansões de Fibonacci. Com ele você deixa pré-configurado duas configurações de expansão e uma de retração de fibo para utilizar através de atalho do teclado e clique do mouse. Ou seja, o utilitário Fibo_Z facilita o uso de funções nativas do MT5.
As teclas de atalho são: "Z" configuração 1 da expansão. "X" configuração 2 da expansão "Z" configuração da retração. "V" limpa os objetos da tela. É isso.
Sucesso e bons trades!

O indicador WT Vwap Bands é um indicador que combina o preço e o volume, ajudando a mostrar se está o preço está dentro do "preço justo", sobrecomprado ou sobrevendido.
O código do indicador foi pensado visando o desempenho e já testado em conta real de negociação.
Além dos inputs visuais (cor, espessura e estilo da linha), o usuário pode definir um valor % que depende do preço.
Os valores default trabalham com a banda mais afastada a 1% do preço e depois dividindo esta distância em 3,

The Stepper indicator generates Signals in strong Trend zones. Even when the Trend is set, we must filter when to ENTER or HOLD the trigger. The Trend is represented by two lines: Trend UP and Trend DOWN. W e are in a Bullish trend when the Trend UP (Green line) is above. And in a Bearish trend when the Trend DOWN (Pink line) is above.
When the momentum is aligned with the Trend , this indicator generates: BUY signals (LIME line) SELL signals (RED line) The user is alerted of the scenario, at

Hi Friends! this is countdown candles with 4 functions. 1. Countdown current Candles 2. Countdown H1 timeframe. 3. Countdown H4 timeframe. 4. show the spread index and the lowest spread value within 5 minutes. Instructions for installing and downloading this indicator in the link below. https://www.youtube.com/watch?v=fi8N84epuDw
Wish you have a happy and successful day.
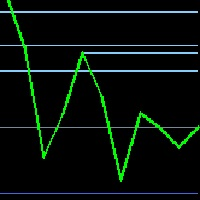
Resistance and Support levels is one of the most important factors when you enter the market This indicator will automatically draw all resistance and support for last x (you can insert the x value as you like) resistances and supports You should trade between those lines and put your stop loss behind this line (if you in sell then your stop line should be above this line, and opposite for buy) Also your take profit should be upon those lines So you should trade between support and resistance
Some candles have a strong tendency to continue the movement, or its turn. Using the Colored candles and patterns indicator, such candles are clearly visible. This indicator calculates the parameters of each candle, as well as its volume, and after that it colors the candles depending on its strength and direction. Bullish candles turn green and bearish candles turn red. The greater the strength of the bulls or bears, the brighter the color. If desired, the colors can be changed. In addition, t

Trend Factor is an indicator based on the calculation of price values to answer questions about what direction the trend is acting on the market at the moment and when this trend will end.
By launching the Trend Factor indicator, the user will see two lines and bars of different colors, which can change color to green during an uptrend, to red during a downtrend or to be yellow during an uncertainty.
The trader uses the Trend Factor indicator to determine the market situation. This is a t
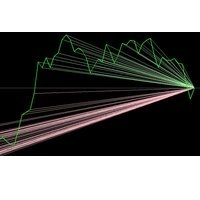
Esse indicador fornece uma marca muito vendida e bem-sucedida para a direção do preço, fornecendo valores para os últimos níveis de preços, permitindo prever o próximo movimento de preço
Nesta edição gratuita, você pode trabalhar apenas no BTCJPY, versão completa em construção
Recomendamos que você compre ou venda quando o valor de compra / venda for superior a duas vezes o valor de venda / compra
Vamos dar exemplos:
Se os valores foram Buy: 45, sell: 55, não entre no mercado
se os va

Special Channel channel indicator is a classic indicator of a family of channel indicators, the use of which allows the trader to respond in time to the price out of the channel set for it. This corridor is built on the basis of the analysis of several candles, starting from the last, as a result of which the extrema of the studied interval are determined. It is they who create the channel lines.
Trading in the channel is one of the most popular Forex strategies; its simplicity allows even be

JUPITER it is a Secure Automated Software for trade Forex market and indices.
The architecture is a Fully Automatic Autonomous Robot Expert capable of
Independently analyzing the market and making trading decisions
JUPITER It is an advanced trading system. This is a fully automatic Expert Advisor.
JUPITER . It is a 100% automatic system, The system is self-sufficient, performing all the work. Is a revolution in the customization of the trading. You can download t

O indicador de regressão mostra a direção da tendência. O gráfico mostra até 3 linhas de regressão com diferentes períodos de tempo. A linha reta é construída como a média dentro do canal de ondas do movimento de preços (mostrado em um ScreenShot).
Nesse caso, você pode desativar qualquer uma das linhas. Além disso, o indicador permite alterar a cor de cada linha. É interessante calcular o ângulo relativo em graus. A exibição do ângulo também pode ser desligada.
Graças a esse indicador, voc

The indicator draws support and resistance lines on an important part of the chart for making decisions. After the trend line appears, you can trade for a breakout or rebound from it, as well as place orders near it. Outdated trend lines are deleted automatically. Thus, we always deal with the most up-to-date lines. The indicator is not redrawn .
Settings:
Size_History - the size of the calculated history. Num_Candles_extremum - the number of candles on each side of the extremum. Type_Ar
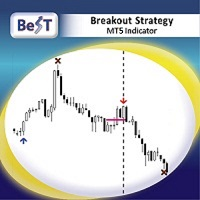
BeST_Breakout Strategy MT5 is an Metatrader Indicator based on a proprietary algorithm implementing a very powerful tool that can exploit every breakout leading to huge market movements.It timely locates the most likely points for Entering the Market as well as the most suitable Exit points and can be used successfully as a standalone Trading System which performance is often accompanied by very impressive statistics of % Success Ratio and Profit Factor . The BeST_Breakout Strategy is a non-rep

Each bar graph is a brick, take buy a bill now as an example, the brick that is in lowest position at the moment, go to the left, when the brick with the 3rd highest is in existence, take the height of this brick as a benchmark, when the price exceeds the height of this brick, can establish buy a bill, when appear opposite circumstance closes a position, establish empty order at the same time. This is a simple rule, need each friend grope by oneself.
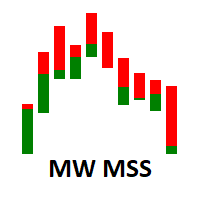
O indicador de força dos lados do mercado da Martinware mostra o gráfico de velas de uma maneira diferente, permitindo uma visão mais clara de qual lado, de alta ou de baixa, está dominando o ativo no período atual. Como bônus, ele também pode mostrar uma área interna que pode ser usada para visualizar dois níveis de retração de Fibonacci dentro das barras.
A configuração padrão mostra as barras MSS com 4 cores principais, duas representando a força de alta e duas representando a de baixa.

Você utiliza o volume na sua leitura do mercado?
Certamente muitos traders usam, e não se imaginam operando sem ele.
O indicador Color Candle Volume Set permite que o usuário escolha o valor que ele considera interessante para monitorar.
Ao ultrapassar este você terá a confirmação visual no gráfico de preços e se quiser terá também o alerta sonoro que é dado pelo indicador.
Claro que existem outras maneiras de tentar encontrar um volume elevado, como avaliar se o volume está ac

Você utiliza o volume na sua leitura do mercado?
Certamente muitos traders usam, e não se imaginam operando sem ele.
O indicador Color Histogram Volume Set permite que o usuário escolha o valor que ele considera interessante para monitorar. Ao ultrapassar este você terá a confirmação visual e se quiser terá também o alerta sonoro que é dado pelo indicador.
Claro que existem outras maneiras de tentar encontrar um volume elevado, como avaliar se o v olume está acima da média, se é o maior vo

NetWorker сеточный советник подойдет как профессионалам так и новичкам прост в настройке. Работает с любыми валютными парами,товарами, индексами. EURUSD,GOLD,OIL BRENT,OIL WTI,S&P 500,Crypto currency Bitcoin ВНИМАНИЕ ПЕРЕД НАЧАЛОМ ТОРГОВЛИ НА РЕАЛЬНОМ СЧЕТЕ ВОСПОЛЬЗУЙТЕСЬ ТЕСТЕРОМ СТРАТЕГИЙ ДЛЯ ПОИСКА ЛУЧШЕЙ НАСТРОЙКИ ОПТИМИЗИРУЙТЕ НАСТРОЙКИ С ПОМОЩЬЮ ОПТИМИЗАТОРА ПРОВЕРЯЙТЕ ВАШИ НАСТРОЙКИ НА ДЕМО СЧЕТЕ

Currency Strength Meter is the easiest way to identify strong and weak currencies. This indicator shows the relative strength of 8 major currencies + Gold: AUD, CAD, CHF, EUR, GBP, JPY, NZD, USD, XAU. Gold symbol can be changed to other symbols like XAG, XAU etc.
By default the strength value is normalised to the range from 0 to 100 for RSI algorithm: The value above 60 means strong currency; The value below 40 means weak currency;
This indicator needs the history data of all 28 major curre

The indicator detects important peaks and troughs (extremes) on the chart. These points can be used to plot support/resistance levels and trend lines, as well as any other graphical analysis. These points can serve as reference points for setting trading orders. The indicator does not redraw .
Settings:
Size_History - the size of the calculated history. Num_Candles_Right - number of candles to the right of the peak or trough.
Num_Candles_Left - number of candles to the left of the pea

MACD Master Our MACD Master is the Expert Advisor you were searching for. It is easy to set up and brings Money Management such as automated or fixed Stop loss, risk management with fixed amount or percentage on the Account Balance or Account Equity and the most important for a solid system, the definition of the risk ratio - CRV.
How does the system work? The system is based on the original idea of the MACD. Whenever the fast EMA and the slow EMA of the MACD are crossing a sell or buy signal

The Laguerre VIX Trend Extrema (LVTE) indicator detects market tops and bottoms. As its name suggests, LVTE is a percentage price oscillator that identifies extreme ranges in market price. How to use: Buy when the indicator was in the lower "blue" range for more than 2 candles, and then moves up into grey. Sell when the indicator was in the upper "red" range, and then moves down into orange. Please see screenshots for examples! To make it simple, the indicator can show this by painting "dots
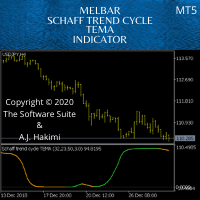
Schaff Trend: A Faster And More Accurate Indicator In Combination With The TEMA MACD - Scalping Systems Advantage
The Schaff Trend Cycle (STC) is a charting indicator that is commonly used to identify market trends and provide buy and sell signals to traders. Developed in 1999 by noted currency trader Doug Schaff, STC is a type of oscillator and is based on the assumption that, regardless of time frame, currency trends accelerate and decelerate in cyclical patterns. https://www.investopedia.
Chart Slice is a very convenient multi-timeframe indicator, with which you can see market information at once on several time slices. This will allow the trader to learn quickly and most importantly understand the vibrant market . The author himself went this way and this indicator helped incredibly. You probably have often wanted to see in detail why at a given point in time the price was rapidly moving away from a certain level or, on the contrary, stopping there. And for this you had to chan

Esse indicador calcula a VWAP Diária e projeta as Bands em 3 níveis superiores e 3 níveis inferiores (Suportes e Resistências), deslocados pelo Desvio Padrão selecionado pelo usuário.
Como configurar: Escolha o símbolo e o tempo gráfico desejado; Escolha o tipo de preço que seja mais adequado para efetuar o cálculo da VWAP Desejada; Escolha se deseja ou não que as Bands sejam plotadas; Escolha o tipo de Volume que deseja usar (Ticks ou Real); Escolha o tipo de Cálculo das Bands (Desvio dos Pre

Este indicador a finalidade de monitorar e correlacionar percentualmente vários ativos simultaneamente. Utilizando a técnica de leitura operacional baseada em Multimercados, o usuário consegue observar o comportamento de outros ativos vis à vis o ativo atual que está operando. Com isso, a capacidade do usuário de tomar decisões se torna mais robusta e embasada. O indicador tem a capacidade de relacionar até 4 ativos, tendo a possibilidade, também, de alterar o tipo de cotação a ser utilizada tan

PROMOTIONAL PERIOD - ONLY 2 COPIES LEFT OF FIRST 10 BUYERS AT PRICE 300,00$!!!
CHECK SCREENSHOTS AND COMMENTS FOR OUR STRATEGY RULES AND LIVE TRADES SIGNALS PULL IT BACK is a revolutionary trading system and a complete strategy with advanced algorithm developed to detect the trend direction after a PULLBACK , a RETREACEMENT or a KEY LEVEL BOUNCE . The goal of this indicator is to get as many pips as possible from market trend. Following strictly the rules of the strategy, you can become a

The 9-5 Count is designed to track a very powerful cycle that runs through all freely traded markets. This is not a time cycle but a price cycle. The time spent between two points is not as important as the price traveled between them. The 9-5 Count is called that because one complete upward cycle consists of measurement of 9 units plus 5 units of cycle time. This tool takes into account price and pattern together, so it’s more than just a simple cycle. The 9-5 theory classifies market movemen
5 Advantages of Using a Forex Expert Advisor It can trade while you sleep! ... It is not vulnerable to emotions. ... You can run backtests quickly. ... It reacts to quick market movements instantly. ... It isn't prone to human error.
MelBar Take10P AJH Expert Advisor RoboTrade Software MT5 - TEST RESULTS by Independent 3rd. Party
Leverage : 1-500 Initial Deposit US$150-US$300
Timeframe : M30
Period : March 1, 2020 - April 29, 2020
Profit Returns Percentage in 59 DAYS : 50+%-10

O indicador de Larry Wiliams chamado WillSpread considera a influência do ativo secundário (símbolo) no ativo atual (em negociação). A essência do indicador é transformar a correlação entre ativos dos dados do histórico acumulado, oferecendo uma oportunidade para detectar várias peculiaridades e padrões na dinâmica dos preços que são invisíveis a olho nu. Com base nessas informações, os traders podem assumir mais movimentos de preços e ajustar sua estratégia de acordo. Em poucas palavras, o Will

through this indicator you can make analysis and also can to distinguish possible weakness or continuous strength on price, it is an indicator initially developed by David Weis. This version is for the meta trader 5 platform. The Weis Waves indicator is based on volume and is aligned with the price, being able to find not only possible strenght and weakness, but also possible divergences between price and volume, bringing an interesting analysis between both.
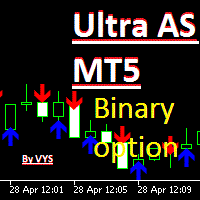
the indicator is intended for trading binary options period parameter, you can adjust the indicator to your strategy and select the required number and quality of signals red arrow down to sell signal blue arrow up to buy signal Recommended time for one candle You can enter the deal when a signal appears or on the next candle ATTENTION on the current candle the signal may sometimes disappear accuracy of about 70%

The strategy which is applied in finance market all around the world is known as CTA strategy. A successful CTA always includes multi-strategies, multi-instruments and multi-timeframe. The series of Multi Instruments TrendSystem (MITS) provide a profitable strategy which can be used in different instruments with different timeframe. Multi Instruments TrendSystem 6 CP (Central Power ) MT5 is a fully automated multi-instrument Expert Advisor. This EA is one of our trend strategies EA, it can be

The strategy which is applied in finance market all around the world is known as CTA strategy. A successful CTA always includes multi-strategies, multi-instruments and multi-timeframe. The series of Multi Instruments TrendSystem (MITS) provide a profitable strategy which can be used in different instruments with different timeframe.
Multi Instruments TrendSystem 5 RA MT5 (Rapier) is a fully automated multi-instrument Expert Advisor. This EA is one of our trend strategies EA, it can be used
The strategy which is applied in finance market all around the world is known as CTA strategy. A successful CTA always includes multi-strategies, multi-instruments and multi-timeframe. The series of Multi Instruments TrendSystem (MITS) provide a profitable strategy which can be used in different instruments with different timeframe.
Multi Instruments TrendSystem 4 M4A1 MT5 is a fully automated multi-instrument Expert Advisor. This EA is one of our trend strategies EA, it can be used on lots o

Gossamer is a moving average ribbon indicator that uses a novel approach to identify breakout trades in trending markets. By applying a progressive period shift to each moving average, levels of consolidation become visible. Enter trades when price breaks out in the direction of the prevailing trend. Stoploss should be located on the other side of the consolidation from the breakout. Profits can be taken at the next consolidation or the stoploss trailed and the position built. Applicable to a

The strategy which is applied in finance market all around the world is known as CTA strategy. A successful CTA always includes multi-strategies, multi-instruments and multi-timeframe. The series of Multi Instruments TrendSystem (MITS) provide a profitable strategy which can be used in different instruments with different timeframe.
Multi Instruments TrendSystem 3 BS MT5 (Blood Sword) is a fully automated multi-instrument Expert Advisor. This EA is one of our trend strategies EA, it can be u

Idealizado por Fábio Trevisan, VolumeCapacitor é um indicador que, além de mostrar a quantidade de volume, mostra sua direção, tendo como principal característica, marcar possíveis topos e fundos dos preços, ou áreas de pullback. Com sua maneira de cálculo simples, mas não simplista, consegue determinar áreas onde a defesa das posições compradas e vendidas pode ser avaliada com uma simples observação. VolumeCapacitor utiliza em sua fórmula única o OBV (Saldo de Volume, ou On-Balance Volume) ide

The strategy which is applied in finance market all around the world is known as CTA strategy. A successful CTA always includes multi-strategies, multi-instruments and multi-timeframe. The series of Multi Instruments TrendSystem (MITS) provide a profitable strategy which can be used in different instruments with different timeframe. Multi Instruments TrendSystem 2 DM (Dual Moving) MT5 is a fully automated multi-instrument Expert Advisor. This EA is one of our trend strategies EA, it can be used

The strategy which is applied in finance market all around the world is known as CTA strategy. A successful CTA always includes multi-strategies, multi-instruments and multi-timeframe. The series of Multi Instruments TrendSystem (MITS) provide a profitable strategy which can be used in different instruments with different timeframe.
Multi Instruments TrendSystem 1 MT5 (Multi-Moving Strategy) is a fully automated multi-instrument Expert Advisor. This EA is one of our trend strategies EA, it ca

Sun Storm MT5 - it is a Secure Automated Software for trade Forex market and indices.
ONLY RECO M ENDED FOR GBPUSD AND EURUSD Can used this EA whit 100$ in your account
The architecture is a Fully Automatic Autonomous Robot Expert capable of independently analyzing the market and making trading decisions
Sun Storm MT5 It is an advanced trading system. This is a fully automatic Expert Advisor. It is a 100% automatic system, the system controls bot
Chart Reverse Point is based on moving average, volumes, and a priceaction logic to find the points in which the currency will probably go in a defined direction. Inputs: Alarm ON/OFF: turn on or off alarm on screen. The indicator draws an arrow pointing the direction to follow based on when a specific pattern of bars is found near the moving average and the volumes are higher than a minumun defined by the indicator. Chart Reverse Point can help you to choose the moment to do your trades in a sp
MA Break Point is based on moving average and a priceaction logic to find the points in which the currency will probably go in a defined direction. Inputs: Alarm ON/OFF: turn on or off alarm on screen. The indicator draws an arrow pointing the direction to follow based on when the currency cross a moving average and verify the trend with another ma. MA Break Point can help you to choose the moment to do your trades in a specific direction, strengthening your trading strategy.

Retracement Trend is based on a priceaction logic and volume of the lasts bars. Inputs: Alarm ON/OFF: turn on or off alarm on screen. The indicator draws an arrow pointing the direction to follow based on when a specific pattern of bar's volume is found and the price has a specific direction. Retracement Trend can help you to choose the moment to do your trades in a specific direction, strengthening your trading strategy.

Support Resistance Inversion is based on supports and resistance to find the points in which the currency will probably go in a defined direction. Inputs: Alarm ON/OFF: turn on or off alarm on screen. The indicator draws an arrow pointing the direction to follow based on when the price cross or bounce on a support or a resistance. Support Resistance Inversion can help you to choose the moment to do your trades in a specific direction, strengthening your trading strategy.
Support Resistance Pattern is based on supports and resistance to find the points in which the currency will probably go in a defined direction. Inputs: Alarm ON/OFF: turn on or off alarm on screen. The indicator draws an arrow pointing the direction to follow based on when a specific pattern of bars is found near a support or a resistance. Support Resistance Pattern can help you to choose the moment to do your trades in a specific direction, strengthening your trading strategy.
Stochastic Break Point is based on the stochastic oscillator and moving average to find the points in which the currency will probably go in a defined direction. Inputs: Alarm ON/OFF: turn on or off alarm on screen. The indicator draws an arrow pointing the direction to follow based on when the stochastic line cross the signal line and in which direction it does it, filtered by the moving average direction. Stochastic Break Point can help you to choose the moment to do your trades in a specific

Trend Lines View draws trend lines in the current chart in the timeframe you choose, taking account of the last two maximum and minimum. Inputs are: Timeframe: timeframe for calculation. Period of calculation Max/Min: Integer that indicates the number of bars to define a minimum or a maximum; 1 means minimum/maximum have to be the lower/higher value of 1 bar previous and 1 bar after, 2 means a the minimum/maximum have to be the lower/higher value of 2 bar previous and 2 bar after, etc. Color hi

The Lomb algorithm is designed to find the dominant cycle length in noisy data. It is used commonly in the field of astronomy and is very good at extracting cycle out of really noisy data sets. The Lomb phase plot is very similar to the Stochastics indicator. It has two threshold levels. When it crosses above the lower level it’s a buy signal. When it crosses the upper level it’s a sell signal. This is cycle-based indicator, the nicer waves look, the better the signal. Caution Also It’s really i

HCM MT5 the new generation EA. The basic concept is trend following. The EA will detect short-term trend following my research about Price Action signals, basing on the 1-hour bars. Base on my research on history data (big data), the EA operate really good on EUR/USD pair only . Please take it for your information.
BE SIMPLE - BE EFFECTIVE The EA is really easy to use with 2 parameters: Maximun Lot = 0.5 : This is the value of maximum lots that the EA can trade automatically.
% of SL

Основная цель индикатора заключается в определении наиболее оптимальных точек входа в сделку и выхода из нее. Индикатор состоит из трех частей. Первая – это стрелки, показывающие оптимальные точки входа в сделку и выхода из нее. Стрелка вверх – сигнал на покупку, стрелка вниз – на продажу. В индикаторе заложен алгоритм аналитического анализа, который включает в себя множество показаний стандартных индикаторов, а также авторский алгоритм. Вторая часть – это информация в правом верхнем углу (работ

Essa ferramenta desenha candles em diferentes TIMEFRAME do 'padrão' exibido na tela... ...No 'Gráfico Padrão' M1, ele desenha os Candles em M15. Por exemplo: O 'Gráfico Padrão' em M1, o 'OHLC' em M15 são desenhados os Candles (caixas) de M15 por trás dos candles de M1.
Baixe a versão demo...
...veja como ele pode ajudar a observar pontos de Suporte/Resistência, bem como bons movimentos com máximas e mínimas nos 15M.

O utilitário TELEGRAM BROADCAST ajuda você a publicar instantaneamente sua negociação no canal do Telegram. Se há muito você deseja criar seu próprio canal de Telegram com sinais FOREX, então é disso que você precisa.
TELEGRAM BROADCAST pode enviar mensagens: Abertura e fechamento de negócios; Colocação e exclusão de pedidos pendentes; Modificação de stop loss e take provision (último pedido); Stop loss e take prov acionados; Ativação e exclusão de um pedido pendente: Envio de relatórios de n
Moving Average 2 Простой советник работающий на пересечении скользящих средних если быстрая ma пересекает медленную ma снизу вверх будет открыт ордер buy, если быстрая ма пересекает медленную ма сверху вниз откроется ордер sell. Работает с любыми валютными парами,товарами, индексами. EURUSD,GOLD,OIL BRENT,OIL WTI,S&P 500 настройки по умолчанию для EURUSD Введение Moving Average 2 Простой советник работающий на пересечении скользящих средних MA если быстрая ма пересекает медленную ма с

Gold News Reloaded Gold News Reloaded
Expert dedicated to trading based on index movements detecting movements in Gold (XAUUSD). Operative
The EA It has multiple options and I have been testing it for months the signals are published in my profile, It is a Martin Gala very controlled plus the filter by movement of Indices that triggers the order of Buy or Sell, any query does not bother, If you want to rent before buying, we set up a configuration and Broker is recommended to operate.

This Expert Advisor is based on ForexMiracle System (MA,BB,MACD,ADX,STO). Follow the trend...no Martingale.. . need technical analysis skill Input Parameters : - Magics = 1234; - Lots = 0.01; - maxStopLevel = 700; - autoTPbyATR = true; - TP = 100; - autoSLbyBollinger = true; - SL = 50; - trailingStop = 0; - CutByEngulf = true; - Friday_Rest = true; - Indicator_Setting = "| ^_^ | ^3^ | ^v^ |"; - MAmega_Setting = "----------------------------"; - MA_Setting = "----------------------------"; - B

This indicator signals significant price movements compared to the average over a defined period, making it easy to spot potential trading opportunities. It takes into account not only price movements but also the spread value of each symbol, providing a more accurate picture. You can use this indicator for multiple symbols, up to 8 pairs, as specified in the input parameters. With its flexible settings, traders can easily customize it to suit their individual preferences and trading styles. It'

The Netsrac Correlation Trade Indicator (NCTI) was created to trade correlations between different assets. NCTI offers five different strategies to do this. Five different correlation trading strategies with two or three assets Fast access your assets with one click via asset buttons Your profit/loss at a glance Configurable alerts via screen or mobile You can use the indicator with every timeframe. Higher timeframes give fewer but better signals. If you have some questions or suggestions - pl

MMHelper - инструмент для удобной работы с ордерами. Позволяет рассчитать и выставить ордер, в зависимости от выбранного риска. Интерфейс продуман для максимального удобства. Нет лишних элементов на графике.
В параметрах возможно указать: порог безубытка (по прохождении какого количества пунктов выставить безубыток); размер безубытка в пунктах; закрывать ли половину позиции при достижении уровня безубытка; размер максимального риска по всем позициям в процентах.

Turn Over is a direction indicator for determining the trend.
The Turn Over indicator visually “unloads” the price chart and saves analysis time: there is no signal - there is no deal, if a return signal appears, then the current deal should be closed.
The indicator implements a strategy for trend trading, filtering and all the necessary functions built into one tool! The principle of the indicator is that when placed on a chart, it automatically determines the current state of the market,
***Please Give Some Feedback and Reviews*** This is an indicator which shows the direction and the strength of the selected Symbol based on the two outputs, Signal and Value. The Signal indicates the directions as Buy equals 2(Blue) and Sell equals 1(Red). The Value output indicates the strength of the signal between -100 to 100. This indicator is both trend and fast preliminary indicator by choosing appropriate parameters. Indicator uses the Tick Volume as the hitting catalyst, which by choosi

ORION it is a Secure Automated Software for trade Forex market and indices.
The architecture is a Fully Automatic Autonomous Robot Expert capable of
Independently analyzing the market and making trading decisions
ORION It is an advanced trading system. This is a fully automatic Expert Advisor.
ORION . It is a 100% automatic system, The system is self-sufficient, performing all the work. Is a revolution in the customization of the trading. You can download the demo and

Robot de scalpings curtos em simbolos de alta volatilidade. Amplamente testado no Mini índice no tempo M1. Resultados consistentes e expressivos em curto período de tempo. Configurações recomendadas para o mini índice já estão nos parâmetros de entrada dos sistema. Não recomendada a utilização em tempos gráficos maiores. Mais informações dos resultados do sistema no tester, encontram-se nas imagens.

Quieres ser rentable y que un indicador haga los análisis por ti.. este es la indicado tener mas seguridad en tus operaciones si respetas los parámetros este indicador fue diseñada y modificado por mas de 6 meses, escogiendo y modificando la para tener un mejor resultado y entradas mas precisas. que te ayudara a asegurar tu entrada y poder sacarle muchas ganancias. los parametros: Entrada cuando La linea roja o verde cruce hacia arriba Puede entrar apenas comencé a cruzar Compra o venta Observa

VR MultiPrice Analysis é um indicador que determina a força de uma moeda num par cambial. Por exemplo, vamos dar uma olhada no par EUR/USD. Como descobrir qual moeda nesse par atualmente é fraca, e qual é forte? A maneira mais simples e confiável de fazer isso é comparar a moeda EUR (euro) em relação a outras moedas, excluindo a moeda USD (dólar americano). Distribuição de forças: Se o euro (EUR) está crescendo em comparação com outras moedas, então isso significa que essa moeda se tornou mais a

An indicator to fetch the market shocks from the economic events directly to the chart. It indicates the surprise factor (actual published data minus the expected value) exactly on the right candlestick! The bigger the value of the indicator, the higher price gap will be. The indicator's value and sign gives a great opportunity to forecast the amount and direction of the price gap. Do not miss any opportunity by setting an Expert Advisor to place buy or sell orders based on this indicator's valu

The Market Momentum indicator is based on the Volume Zone Oscillator (VZO), presented by Waleed Aly Khalil in the 2009 edition of the International Federation of Technical Analysts journal, and presents a fresh view of this market valuable data that is oftenly misunderstood and neglected: VOLUME. With this new approach of "seeing" Volume data, traders can infer more properly market behavior and increase their odds in a winning trade.
"The VZO is a leading volume oscillator; its basic usefulnes
Candle Info
For selected candle:
OHLC prices Open Time Bar shift body size in points
upper shadow in points
Lower shadow in points
Candle length in points Tick volume For current candle: Remaining time Ticks/sec For the chart: Price at mouse position Time at mouse position Draw Lines
For selected candle you can draw a projected line forward, backward or both ways. You can hide/show/delete all lines created.
A Boleta-Lira é uma ferramenta fundamental focado para usuários iniciantes e avançado para que possam entrar nas operações com os principais sinais de entrada como:
- Tendencia do Mercado: Alta ou Baixa, sempre levando em conta a média móvel pré definida no setup. - Força Agressora por Candle: Analise com base no book de ofertas no momento que as ordens são enviadas num determinado período do candle do timeframe; - Correlação entre 2 ativos: No caso na B3 brasileira podemos utilizar a Boleta-

Reversible indicator.
You need to understand that any indicator is just a visual waveform. Currency pairs never rise or fall in a straight line. Their rises and falls are alternated by pullbacks and turns.
The Reversible indicator contains an entire trading system, processes information from several technical instruments and the appearance of its signals is the final calculation result. The indicator itself evaluates how strong a signal appears in the market and when to change direction, si
O Mercado MetaTrader contém robôs de negociação e indicadores técnicos para traders, disponíveis diretamente no terminal.
O sistema de pagamento MQL5.community está disponível para todos os usuários registrados do site do MQL5.com para transações em todos os Serviços MetaTrader. Você pode depositar e sacar dinheiro usando WebMoney, PayPal ou um cartão de banco.
Você está perdendo oportunidades de negociação:
- Aplicativos de negociação gratuitos
- 8 000+ sinais para cópia
- Notícias econômicas para análise dos mercados financeiros
Registro
Login
Se você não tem uma conta, por favor registre-se
Para login e uso do site MQL5.com, você deve ativar o uso de cookies.
Ative esta opção no seu navegador, caso contrário você não poderá fazer login.