Conheça o Mercado MQL5 no YouTube, assista aos vídeos tutoriais
Como comprar um robô de negociação ou indicador?
Execute seu EA na
hospedagem virtual
hospedagem virtual
Teste indicadores/robôs de negociação antes de comprá-los
Quer ganhar dinheiro no Mercado?
Como apresentar um produto para o consumidor final?
Pagamento de Expert Advisors e Indicadores para MetaTrader 5 - 61

O Indicador Market Steps foi projetado e construído baseado nas correlações de Preço/Tempo de Gann, e otimizado por regras específicas de Price Action do Mercado Forex. Ele usa o conceito de fluxo de ordens de mercado para prever as zonas de preços potenciais que terão um alto volume de ordens.
Os níveis apresentados pelo Indicador podem ser usados para negociação, e/ou também para filtro de sinais de outras estratégias ou indicadores. Todo Trader precisa desta poderosa ferramenta para ter ao

Optimize EA before test and buying. Euro King is for trading EUR/USD on 15 min time frames. Optimize to find the best stop loss and take profit for your risk management. This EA does not trade hundreds of times a day. In the test it traded 100 times in a year. Try other time frames to see if there optimizations for different results. The EA uses Bollinger bands, moving averages and RSI for logic in the entry and exits. Martingales are not used and all trades have a stop loss and a take pr

66% discount only for the first 5 buyers (4 left), main price: 300 $ Show the signal as a line graph Prediction of 10 future candles and advanced display Prediction of individual candles graphically Can be used in the gold symbol Can be used in 15 minutes time frame Can be used only in gold symbol and only 15 minutes time frame
How the indicator works:
Using complex mathematical calculations, it predicts the future 10 candles. The predictions of this indicator are based on price. Theref

O indicador irá plotar no grafico uma linha que corresponde ao preço de fechamento do dia anterior, e baseado nisso, ele irá plotar os niveis percentuais de variacao do preco do ativo em questao. Poderá ser usado em qualquer ativo. Periodo: Determinar se o preco de fechamento devera ser o diario, semanal ou mensal Percentagem minima: Determinar qual a percentagem para que o indicador plote no grafico os niveis e subniveis, ex: 0.5 ele ira plotar no grafico uma linha a cada 0.5% de variacao e os

Write this EA for my own use. but decided to sell it as well . The EA has a wide variety of uses. Can be set as you wish. But please understand that profits depend on the capabilities of EA users. Not just the EA alone. I try to reduce the difficulty of use. Make EA easier to use and more friendly to investors. I want everyone to try the demo before actually buying it. To make sure this EA is right for you or not. ... About setting up my EA click that youtube link.

Fundamentação teórica
A VWAP é uma média móvel ponderada pelo volume, trazendo maior relevância para os preços. O cálculo base da VWAP segue a fórmula clássica descrita no Investopedia ( https://www.investopedia.com/terms/v/vwap.asp ). VWAP = sum(typical price[i]*volume[i]) / sum(volume[i]) Funcionalidades
A VWAP Orion inova ao permitir que o usuário escolha dentre os convencionais períodos Diário, Semanal e Mensal, tendo também a opção de cálculo do indicador Intraday, como utilizado em out

Fundamentação teórica A VWAP é uma média móvel ajustada pelo volume, ou seja, o peso de cada preço corresponde ao volume de ações negociadas no período, dando mais importância ao período em que se tenha mais negociações. A Orion Vwap Bands permite que o usuário use plote 8 bandas que podem ser utilizadas como suportes e resistências para o preço. Cada banda é calculada a partir da Vwap Tradicional:
Ex.: Se escolhermos o valor 0.25 para a plotagem da Banda 1, pega-se o preço da Vwap e acrescen

TRAILINATOR is a unique Solution to use different Trailing-Stop Variants and change your Tradesetup via Remotecontrol. You configure your Tradesetup for a specified Symbol only once. This setting will be used for all your Positions of the same Symbol. Currently we support these Features: different Trailing-Stops: Standard: works like you use in Metatrader Terminal, starts trailing if your profit is greater than trailing stop Start after points: trailing stop will start after your defined poin
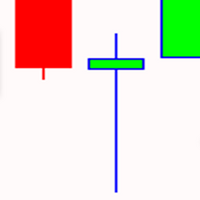
OPTMIZE EA BEFORE BACKTEST AND USE. Gold Pin Bar trade XAU/USD on 1HR charts using moving averages and pin bars. Pin bars are used to pick higher probable trades that can occur. The price is pushed up or down forming the pin bar signaling who has control over the price. Optimize for the best settings for stop loss and take profits and don't forget to account for spreads and slippage in optimization. . All order have money management and the EA doesn't use dangerous trading strategies. Rest as

Hello;
This product generates buy and sell signals from the intersection of two moving averages. It uses all the capabilities of the moving averages. To generate a scalping strategy, a take profit level is determined after the signal level. To stop the loss, it uses the reverse signal. The system can increase the lot amount according to the fibonacci ratios after each loss .To disable this margintale feature, you will need to enter the low lot and high lot amounts the same. So you can work wi

OPTMIZE EA BEFORE BACKTEST AND USE. United States Stock Market Index US500 trades the 5 minute charts. The EA uses RSI and Stochastics for entries and ATR for exits. The building period was From 2021-03-19 to 2022-08-18. Continually optimize the EA to find best settings and don't forget to account for spreads and slippage in optimization . The EA does not use martingale and has a sl and tp on each trade with a fixed lot input. Try it out in the back test, optimize for settings.
Risk Di

O indicador Danko Trend Color é na verdade uma coloração de candles para trazer praticidade, facilidade e informação aos seus gráficos.
O Danko Trend Color combina indicadores de PREÇO E VOLUME para definir a tendência predominante, assim as cores são: Azul (indica tendência de alta)
Laranja (indica tendência de baixa)
Branco (indica indefinição de tendência)
Não gosto de prometer nada com meus indicadores, peço que baixem , testem grátis (para uso em backteste) e vejam se o indicador p

É um indicador utilizado para identificar pontos de suporte e resistência a partir da VWAP diária e é possível usá-lo para verificar os melhores pontos de entrada e saída de posição.
O valor calculado da distancia do canal pode ser calculado de varias formas:
- Manual Definindo o valor a ser projetado para calcular a distancia dos canais.
- Automatico Selecione o tempo grafico a ser utilizado. Independente do tempo grafico que esta na tela se for mudado o parametro para H1(
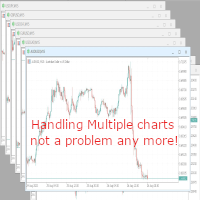
With this script you can open or close multiple charts with just one click. Please follow the instructions below; Set your desired symbols in the market watch window. Open one chart. Attach the script to the chart In the input values just select the time frame of your chart. Set open chart value to true. Click ok. To close the charts follow step 3 and 7. In input values set open chart value to false and close chart value to true

Turn Stock Manager into Your New Business Opportunity – You can sell Stock Manager to your customers as a service by selling License. – The Licenses is managed in a Web Admin dashboard. – Highly flexibility structure that allows customers to host their database in Cloud or Self-hosted. – Admin/Staffs can create unlimited number of license for selling. please test me now

V Band is a technical analysis tool that helps smooth out price action by filtering out the “noise” from random price fluctuations. It is calculated by taking the average of a market’s price over a set period of time.
It can be applied to stocks equity indices, commodities and Forex . V Bands is used to identify trends or support and resistance levels.
They can also be used to generate buy and sell signals.
Choose a trading style and start trading!

https://www.youtube.com/watch?v=0T8Mge39Xsk&t=9s
Youtube Sell only EA here.
These EAs trade macd divergence only if there is a parabolic sar change at the same time.
Buy bullish macd divergence & parabolic sar crosses below price Macd settings Threshhold is how far above / below zero divergence must occur. Timeframe used Parabolic sar settings
Only one trade in that direction can be opened at once. Trades on open bar Alerts , mt5 and mobile Stop loss and target points Stop loss is set

Waterstrider Cash Register
A High Risk trade with Martingale grid
The trend is based on the h1 chart, and scalping in m1-m15 chart.
Pair EURJPY, USDJPY, AUDUSD
8 position will open if against the position, and when the 8 position reach, a hedge position will open to increase the equity balance with small tp and re entry every 10% DD. after that the ea will calculate the open position and the hedge position and will close all in profits. No guarante for profit, you can try this with you
This EA utility does not trade on its own, but it only modifies the open trades to add take profit and stop loss that was opened manually or by any other expert advisors.
The distance is based on Average True Range Indicator(ATR).
How Does It Work?
If Symbol to modify is set to "All Symbol" simply attach it to one chart, and all open trades in the entire terminal will set the take profit and stop loss with the distance of Average True Range value of their corresponding symbol.
If

The indicator calculates intraday levels based on the average daily price range, builds support and resistance levels that may be reversal.
Parameters Period ATR - period of the ATR indicator Shift time - time offset for the opening of the day Color opening of day - color of the opening line of the day Color 1AR, -1AS - line color 1AR, -1AS Color AR 1/2, AS -1/2 - line color AR 1/2, AS Color AR 1/4, AS -1/4 - line color AR 1/4, AS -1/4 Color AR 3/4, AS -3/4 - line color AR 3/4, AS -3/4 Colo

Telegram Utility EA link para qualquer bot privado/público e pode ajudá-lo a: Feche todos os pedidos instantaneamente por comando. O comando é codificado com sua senha personalizada e só você sabe. O bot do Telegram informará quando todos os pedidos forem fechados e até mesmo pausará todos os outros EAs em execução no seu terminal MT5. Pause/Retome quaisquer outros EAs em execução no Terminal com apenas um clique! Exportar relatório de comércio por formulário de pips ou formulário de dinheiro.

The indicator calculates the correlation coefficient of 2 instruments, shifts the chart of the 2nd instrument relative to the 1st and displays the charts of both instruments on the current chart. The maximum positive and negative deltas and the current delta as a percentage of the maximum are calculated. It is possible for signals to set a delta for entry and exit with displaying the direction of entry into trade for each instrument. The space between the charts is also filled with different col

DESCRIÇÃO O indicador EasyFollowerTrader Bot1 DayTrade opera apenas a favor da tendência majoritária. Assim, o indicador, em primeiro momento, observar a tendência do gráfico diário para operar a favor deste. Em seguida, o indicador observar a tendência do gráfico atual. Quando estes dois gráficos estiverem se movimentando na mesma direção, teremos a maior probabilidade de ganhos. Chamaremos esta região como região de alta probabilidade de ganho. Na região de alta probabilidade de ganho, o indic

An arrow technical indicator without redrawing Signal Breakthrough in the Forex market is able to give tips with the least errors.
Every rise and fall is reflected in your emotional state: hope is replaced by fear, and when it passes, hope appears again. The market uses your fear to prevent you from taking advantage of a strong position. At such moments you are most vulnerable. Currency pairs never rise or fall in a straight line. Their ups and downs are interspersed with rollbacks and revers
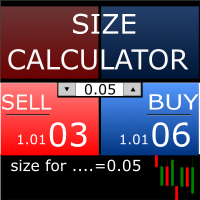
Size Calculator allow you to calculate the size you need for your position giving two parametres: the number of pips risked and the money risked, for example if you want to risk 20 USD on 200 pips, then you will need to input 200 in the case reserved for pips and 20 in the case reserved for risk, the size will appear in left top carner of the chart in your metatrader 4 platform, Size Calculator support the following symbols : EURUSD GBPUSD AUDUSD NZDUSD GOLD WTI EURJPY GBPJPY USDJPY AUDJP

The Active Trend indicator helps to analyze the market on the selected time interval. It defines the mainstream. Used in trading. You can use so basic to determine the trend. The indicator works well on both short and longer trend sections. In flat it is recommended to use filters of your choice. It can accompany the position with a stop, it is recommended to set the stop at a fixed distance from the point formed by the indicator. The simplest way to use the indicator is to open a trade in the

Inventory Retracement Trade it is designed based on one of the most popular tradingview indicator. This is mostly combined with other popurlar trend indicator to confirm the strength of the movement. Definition Inventory Retracement Trade is quickly becoming one of the most popular ways to identify where short-term counter trend institutional inventory has subsided and when it’s time to re-enter into a trade’s original trend direction.

SINAIS DE ESTÁGIO ENGUIFANDO ESS
Este indicador detecta velas do tipo envelope às quais é aplicado um filtro, este filtro é composto por 3 estratégias em conjunto, com as quais é possível identificar a maior eficácia possível dentro dos parâmetros mensuráveis.
Os sinais são indicados por setas para cima e para baixo para cada uma das direções, e você também pode ativar ou desativar alertas, e-mails e mensagens push para o celular.
Vale ressaltar que nenhum indicador é 100% eficaz, por iss

Top indicator for MT5 providing accurate signals to enter Trades.
This Indicator will provide pretty accurate trading signals and tell you when it's best to open a trade by giving alerts to buy or sell. Mainly was created to target Volatility Index on Deriv broker however, the Spot Detector Arrow Indicator can be applied to any financial assets(Forex, Crypto, Indices, Volatilities) on MT5 Brokers.
HOW TO BUY Wait for signal Alert to Buy will be sent to your MT5 Terminal Blue arrow facin
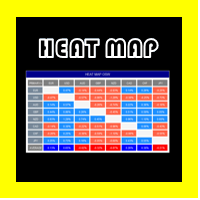
OSW DO MAPA PRINCIPAL
Este indicador é ideal para conhecer o estado atual de todas as combinações de moedas e conhecer sua variação.
A variação é calculada pelo movimento percentual do preço desde o preço atual até 24 horas atrás, ou o que estiver configurado no menu.
Para saber a variação de uma moeda, basta olhar para a moeda principal, exemplo:
no EUR você tem que olhar verticalmente para comparar com outras moedas e no final de tudo, você encontra a média de todos esses valores de v

В основу алгоритма этого трендового индикатора положен анализ веера сигнальных линий универсального мувинга I . Алгоритм вычисления сигнальных линий выглядит следующим образом. В качестве исходных данных имеем входные параметры индикатора: StartLength - минимальное стартовое значение первой сигнальной линии; Step - шаг изменения периода; StepsTotal - количество изменений периода. Любое значение периода из множества сигнальных линий вычисляется по формуле арифметической прогрессии: SignalPeriod(

PRESENTATION
This EA uses several non-directional strategies that allows it to generate profits regardless of price trends. It manages a pool of positions ("session") in a totally autonomous way To avoid risks related to this strategy, several recovery functions have been implemented. This makes it a reliable and secure EA, its DD remains low.
RECOVERY MODE This EA is designed to run on several pairs simultaneously on an account. When the DD of a session exceeds a defined value, all positions

Wink IND is an indicator that tell you: -when MACD is saying buy or sell -when RSI is saying buy or sell -work on multi timeframes MT4 Version
by Wink IND: you don't need to have Knowledge about MACD or RSI don't need to check and compare MACD and RSI respectly don't need to check all of timeframes and compare the resaults don't lose time, save more time for your decisions in trading
Wink IND: multi timeframe indicator multi currency indicator show the positions by graphic shapes, arrows an

Индикатор iVeles_Perfect_Oscilator является опережающим и одним из самых лучших осциляторов на сегодняшний день, использует специализированный расчет текущих цен графика. Очень качественно и своевременно показывает смену направления, очень точный подход к уровням перекупленности и перепроданности, что позволяет своевременно принять решение по сделке. Работает качественно на любом ТФ и с любым инструментом. Параметры: Period - период расчетов Average - усреднение МА Method - применяемый мето

How it works? This EA trades with Stochastic Signal line Cross over low and high levels. Only allows one open trade at a time on the currency you have attached this EA. if Reverse Logic is FALSE will open BUY if Stocha Signal Line Cross below Low Level will open SELL if Stocha Signal Line Cross Above High Level if Reverse Logic is TRUE will open SELL if Stocha Signal Line Cross below Low Level will open BUY if Stocha Signal Line Cross Above High Level Key difference with my other EA " Maste

В основу алгоритма этого осциллятора положен анализ веера сигнальных линий технического индикатора RSI . Алгоритм вычисления сигнальных линий выглядит следующим образом. В качестве исходных данных имеем входные параметры индикатора: StartLength - минимальное стартовое значение первой сигнальной линии; Step - шаг изменения периода; StepsTotal - количество изменений периода. Любое значение периода из множества сигнальных линий вычисляется по формуле арифметической прогрессии: SignalPeriod(Number)

Accelerator Oscillator by Bill Williams with the ability to fine-tune and replace the averaging algorithms of the indicator, which significantly expands the possibilities of using this oscillator in algorithmic trading and brings it closer in its properties to such an indicator as MACD.
To reduce price noise, the final indicator is processed with an additional Smooth averaging. The indicator has the ability to give alerts, send mail messages and push signals when the direction of movement
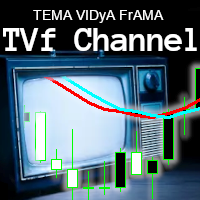
I really like this indicator. But I made it, so of course I would.. NOW FREE. But please consider supporting me by buying my 2 for sale indicators. You can multiply the weight of each indicator used to give more emphasis on it's value when averaging between the 3. Boost fast TEMA and it can move the indicator faster. Boost slow FrAMA and watch it smooth out. I like to use them as open/close lines and set them up so they move quick, but have the FrAMA smooth it out more.
Check out my other ind
Este utilitário mostra o nome do ativo, tempo de vela e descritivo como uma maca d´água no gráfico. O tamanho do texto se ajusta automaticamente quando o gráfico é redimensionado. É útil para identificar o gráfico correto quando vários gráficos são exibidos na tela. A versão Premium permite alterar o tipo e tamanho da fonte de forma independente para o nome do ativo e descritivo, e definição a posição na tela para a exibição do texto. Veja o video demonstrativo abaixo!
Parâmetros do Nome do At
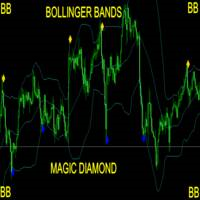
Take Your Trading Experience To the Next Level ! and get the Magic Bollinger Bands Diamond Indicator MagicBB Diamond Indicator is MT5 Indicator which can suggest signals for you while on MT5. The indicator is created with Non Lag Bollinger Bands strategy for the best entries. This is a system to target 10 to 20 pips per trade. The indicator will give alerts on the pair where signal was originated including timeframe. If signal sent, you then enter your trade and set the recommended pips targ

OPTIMIZE EA BEFORE BACKTEST AND USE In times of high inflation, hedging with gold is valid. Trade this EA on the XAU/USD 5 minute chart. It is important to optimize sl a tp before use if out of date. This was built on this years data 2022. Also continual optimization of tp and sl is required for any EA. The strategy uses Williams Percent Range and ADX for entries and Standard Deviation and Moving Averages for exits. The lots are fixed and every trade has a stop loss and a take profit.

Awesome Oscillator by Bill Williams with the ability to fine-tune and replace the averaging algorithms of the indicator, which significantly expands the possibilities of using this oscillator in algorithmic trading and brings it closer in its properties to such an indicator as the MACD. To reduce price noise, the final indicator is processed with an additional Smooth averaging. The indicator has the ability to give alerts, send mail messages and push signals when the direction of movement of th
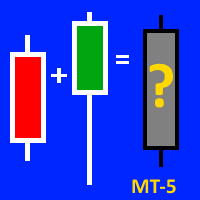
This indicator will be VERY USEFUL for anyone who works with candlestick patterns. This indicator is designed to display the average figure from two adjacent candles (current and previous). Accordingly, it shows IN CONTEXT the strength or weakness of bulls / bears (!). But please, don't forget about the classical basics of technical analysis (!). All indicators are just an auxiliary tool for reading a chart (!). A demo version on the example of mt-4 can be found here: https://www.mql5.com/ru/ma

The Black Dragon robot embodies my core concept used in many different robots developed by me, which is a minimalist UI design. The robot can be used on different symbols with default settings, eliminating the need for additional user intervention. When applied exclusively to a single currency pair, no adjustments are required. However, for those who want to deploy the robot on different currency pairs (see the list below), each symbol must have a unique ID or magic number. It is highly recommen

This robot features a simple user interface design. But underneath, it holds a lot of advanced features that allow you to do various things with the system. You can choose to only buy or sell. Also, you can create different types of orders, such as market, stop, and limit orders. Or you can choose automatic mode and let the system decide the order type. The strategy can also be adjusted according to your preferences. You can also select the method of calculation for all exit levels. This means

UR Front-EndBack-End
UR FrontEndBackEnd é minha fórmula favorita para encontrar os níveis mais precisos de suporte e resistência. Eu também os dividi em diferentes categorias (linhas tracejadas, linhas sólidas e áreas) para marcar o quão fortes eles são. Tudo é armazenado em buffers para que sejam fáceis de acessar e implementar em outras ferramentas.
Acréscimo: A ferramenta pode necessitar de ser ajustada ao ativo sobre o qual é aplicada - os ativos diferem em termos de nr de dígitos no

Indicadores Quânticos rápidos baseados no modelo SSC inovador e rastreamento em tempo real buscam os níveis de suporte e resistência. É uma iniciativa inovadora negociada em todos os tipos de mercados. Fast Quantum Indicators is a innovate initiate SSC model Real time tracking pursuit trend , based on innovate SSC model and Real time tracking pursuit the breakouts of support and resistance levels. It's a innovate initiate traded on all types of markets. Fast Quantum AI Expert Tradin

Indicadores Quânticos rápidos baseados no modelo SSC inovador e rastreamento em tempo real buscam os níveis de suporte e resistência. É uma iniciativa inovadora negociada em todos os tipos de mercados. Fast Quantum Indicators is a innovate initiate SSC model Real time tracking pursuit trend , based on innovate SSC model and Real time tracking pursuit the breakouts of support and resistance levels. It's a innovate initiate traded on all types of markets. Fast Quantum AI Expert Tradi

Smart Market Scanner and Dashboard The trend is very important when trading a financial instrument. The trend can be identified by checking various of structures and indicators. Trend shifts can be identified by trendline breakouts and horizontal support/resistance levels. Scanner will scan the selected symbols and show you the direction/trend on selected timeframes. Algo is based on: Price Cycles, Fractals, Order Blocks, Hi-Lo
Advantages: Multi timeframe Multi instruments including Currencies

Three Triple Exponential Average oscillators merged into one. Fast period will pull on the slower period, and the slower will smooth out the faster and avoid early positions. You can use 2 fast and 1 slow, or Fibonacci range or 2 slow, 1 fast. NOW FREE. But please consider supporting me by buying my 2 for sale indicators.
You can use this as an entry indicator and exit indicator. Open when the tripleTRIX line crosses the zero line and close when it starts to reverse. When the peaks get bigger,
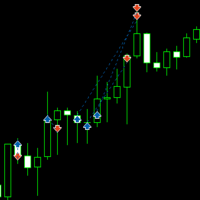
This robot is based on an MACD strategy for trending markets. The description of the strategy can be found on the attached youtube video. The video explains the strategy and shows a basic backtest and optimisation on a few symbols. It is advised to carry out a a backetst and optimisation of your own before using the robot. The video can be found at >> https://www.youtube.com/watch?v=wU_XCM_kV0Y  ;

Две простых симметричных пробойных трендовых системы для лонгов и шортов, которые работают абсолютно независимо друг от друга. В основе алгоритма открытия позиций пробой ценой по тренду мувинга, сдвинутого по вертикали на фиксированное в настройках эксперта количество пунктов. Входные параметры эксперта разбиты на две большие группы: Для лонгов с префиксом "L";
Для шортов с префиксом "S". Поскольку в данном эксперте две торговые системы, то оптимизировать и тестировать их сперва следует отдель

OPTIMIZE For settings. SL and TP should Start with 50000 Important to get the optimization before backrest and use. I optimized on the last month option in the strategy tester. BTC Miner was build for trading BTCUSD on 1 hour time frames. About the EA and strategy: It uses ADX and Envelopes to enter trades and uses Momentum and Moving Average crossovers for exits. There is a fixed lot size and all trades have a SL and TP. The EA does not use martingale or hedging as its strategy, it is based

O Weis Wave Chart para MT5 é um um indicador de Preço e Volume.
A leitura de Preço e Volume foi amplamente divulgada através de Richard Demille Wyckoff com base nas três leis criadas por ele: Oferta e Demanda, Causa e Efeito e Esforço x Resultado.
Em 1900 R.Wyckoff já utilizava o gráfico de Ondas em suas análises.
Muitos anos depois, por volta de 1990 , David Weis Automatizou o gráfico de ondas de R. Wyckoff e hoje nós trazemos a evolução do gráfico de ondas de David Weis.
Ele most

O Weis Wave Chart Forex para MT 5 é um um indicador de Preço e Volume.
A leitura de Preço e Volume foi amplamente divulgada através de Richard Demille Wyckoff com base nas três leis criadas por ele: Oferta e Demanda, Causa e Efeito e Esforço x Resultado.
Em 1900 R.Wyckoff já utilizava o gráfico de Ondas em suas análises.
Muitos anos depois, por volta de 1990 , David Weis Automatizou o gráfico de ondas de R. Wyckoff e hoje nós trazemos a evolução do gráfico de ondas de David Weis.
Ele mo

This product generates signals at closing bars thanks to channel scaling. It visualizes these signals with an arrow. The color of the arrow indicates the direction of the trade. The default settings are valid for the H1 period. You can backtest for each period and product. The code content of the indicator has been applied in accordance with price movements as much as possible. For this reason, it detects trend beginnings and ends well.
Parameter descriptions:
PER: Indicates the number of b

Archi-construído sobre indicadores, no futuro, seu número aumentará. Você pode usar " Trailing Stop "com" Trailing Position "e"Step Trailing". Existe a possibilidade de aumentar o volume da transação subsequente, com uma corrente perdedora, tanto multiplicando quanto adicionando. Depois de alcançar a superioridade das transações positivas sobre as perdas, o volume retorna ao original. Archi BasicSettings:
Magic number é o número único de todas as transações abertas. Atenção!!! o conselheiro

Uma das sequências numéricas é chamada de "Forest Fire Sequence". Foi reconhecida como uma das mais belas novas sequências. Sua principal característica é que essa sequência evita tendências lineares, mesmo as mais curtas. É esta propriedade que formou a base deste indicador. Ao analisar uma série temporal financeira, este indicador tenta rejeitar todas as opções de tendência possíveis. E somente se ele falhar, ele reconhece a presença de uma tendência e dá o sinal apropriado. Esta abordagem pe

NEW: A Fully Automated strategy using price action and candle patterns to trade Gold (XAUUSD).
This EA can be used on any currency but recommended for XAUUSD, EURUSD and BTCUSD Safe stop loss option for FTMO and other funded accounts. REAL BACKTEST DATA - no manipulation or backtest conditioning like other EAs! 100% Modelling Quality Backtest! USE: Default settings on XAUUSD & XAUAUD on the M15 timeframe. Use ECN account for best results.
MAIN SETTINGS Setting Value Description
A basic tool for traders to trade percentile of the value. It indicates both values in the for of digits appeared on the left corner of the screen.
Instructions Manual : First choose your desired symbol and then select this tool. Please be remined that this tool is just a helping tool. its upon trader what he chooses. The function of this tool is just to provide a help in trading.

Momentador UR
O UR Momenter calcula perfeitamente o momento do preço em correlação com o esgotamento do movimento do preço representado como um oscilador. Portanto, isso nos dá sinais realmente iniciais de possíveis reversões ou retrações. Esta fórmula foi descoberta em 2018 após o estouro da bolha do mercado.
Vantagens de usar o UR Momenter:
Sem parâmetros Você tem 2 linhas que descrevem o movimento do preço - Linha Branca que é o Momentum do preço em correlação com o desvio da média m

Best helping tool for Professional and Experienced traders. A best Tool To find the trend. Instruction Manual: First Select your desired Symbol. Then attach this tool and wait till it identify the trend for you. Then it will be more feasible to trade.
Once again best tool to trade. Demo version is available you can fully test its functionality. More importantly there are always trend breaks Once Trend break is observed un-attach this tool and then re-attach to get the fresh trend. Precautions

A value indicator for experienced and professional traders. It is helping tool to indicate the direction value gain. A best helping tool to trade value. This indicator is equipped with a colored line and a digital tool to indicate value numerically .
This indicator also helps to indicate value during trends. A study based on this indicator shows value of trade significantly changes during trends best tool to cash the trends.
A technical Indicator Providing Price Convergence Signals along with value for experienced and professional traders. Easy to comprehend, Easy to understand.
This is a helping tool provides best signals. This indicator is designed based on the fundamentals of trade. A very good indicator you can customized its color. A best tool to find trade direction.
An adaptive indicator. It constantly adapts to the trade.

LAZY TRADER MT5
LIVE SIGNAL - CLICK HERE
SETTING FILES FROM LIVE SIGNAL - CLICK HERE
PRICE WILL INCREASE EVERY 1 TO 2 WEEKS. GETTING IT EARLY GETS YOU THE BEST PRICE.
Lazy Trader was designed to do all of the complex trading for you, so you can you relax on your couch, or sleep the night away. There is no reason to learn how to trade Forex when using Lazy Trader.
YOU DO NEED TO UNDERSTAND RISK AND MONEY MANAGEMENT HOWEVER...... Ok to Be Lazy and Smart, but PLEASE not Lazy a

Hello;
This indicator provides input and output signals of real volume levels with some mathematical calculations. It is simple and safe to use. As a result of the intersection of real volume levels with averages, it creates buy and count signals.
Indicator parameter descriptions:
A-PERIOD: Indicates the number of bars to be calculated.
B-GAMMA: A fixed Fibonacci trend average of 0.618 is used.
Use C-VOLUME TYPE:Tick volume as a constant.
D-HIGH LEVEL 2: Represents the level of the
30% OFF ONLY 10 COPIES HURRY UP! 8 LEFT COPIES Very precise patterns to detect High Accurate Order Blocks: It Draw zone after market Structure Breakout with a high Accuracy, institutional orders with the potential to change the price’s direction and keep moving towards it, have been placed. Features Auto Order Blocks Draw MTF Order Blocks Double Signal One Alert Signal Second Long Wick Rejection Signal Market Structure BOS LINE How to show MTF order Block Go on indicator setting at the en

Restam 10 cópias - o próximo preço é de US$ 600.
O preço aumentará até que $ 2500 seja alcançado.
Me mande uma mensagem após a compra se quiser receber um presente!
Bayraktar é um inovador EA de scalping noturno
O Expert Advisor foi projetado para negociar pares de moedas.
Descrição dos parâmetros:
START_LOT - lote inicial para N unidades de saldo (FROM_BALANCE). Se FROM_BALANCE = 0, então um lote inicial fixo é usado; STOPLOSS_PCT - perda máxima; TAKEPROFIT_PCT - obter

В основе индикатора EasyBands лежит тот же принцип, что и при построении Bollinger Band. Однако, данная модификация индикатора использует вместо стандартного отклонения средний торговый диапазон (Average True Range). Соответственно, с данныи индикатором абсолютно аналогично можно использовать все стратегии, которые применяются с Bollinger Band. В данной версии индикатора используется двенадцать уровней и средняя линия (белый цвет). Индикация тренда выполнена в виде окраски свечей в зависимости
TRACKINGLEVELS (SUPPORTS AND RESISTANCES)
TrackingLevels is a useful indicator that saves considerable time when a trader starts analyzing a chart. This indicator draw on the chart all the resistances and supports that the market is creating. The resistance and support levels are very important, this levels define areas where there can be a considerable accumulation of sell or buy orders. These are a key areas that every trader must know and keep in mind all the time. This indicator helps the
Saiba como comprar um robô de negociação na AppStore do MetaTrader, a loja de aplicativos para a plataforma MetaTrader.
O Sistema de Pagamento MQL5.community permite transações através WebMoney, PayPay, ePayments e sistemas de pagamento populares. Nós recomendamos que você teste o robô de negociação antes de comprá-lo para uma melhor experiência como cliente.
Você está perdendo oportunidades de negociação:
- Aplicativos de negociação gratuitos
- 8 000+ sinais para cópia
- Notícias econômicas para análise dos mercados financeiros
Registro
Login
Se você não tem uma conta, por favor registre-se
Para login e uso do site MQL5.com, você deve ativar o uso de cookies.
Ative esta opção no seu navegador, caso contrário você não poderá fazer login.