Conheça o Mercado MQL5 no YouTube, assista aos vídeos tutoriais
Como comprar um robô de negociação ou indicador?
Execute seu EA na
hospedagem virtual
hospedagem virtual
Teste indicadores/robôs de negociação antes de comprá-los
Quer ganhar dinheiro no Mercado?
Como apresentar um produto para o consumidor final?
Pagamento de Expert Advisors e Indicadores para MetaTrader 5 - 59

Indicator and Expert Adviser EA Available in the comments section of this product. Download with Indicator must have indicator installed for EA to work.
Mt5 indicator alerts for bollinger band and envelope extremes occurring at the same time. Buy signal alerts occur when A bullish candle has formed below both the lower bollinger band and the lower envelope Bar must open and close below both these indicators. Sell signal occur when A bear bar is formed above the upper bollinger band and upp

Varkis EA é um Expert Advisor profissional multi-moeda que usa uma variedade de estratégias de negociação no mercado de câmbio. Cada uma das estratégias individuais passou por muitos anos de desenvolvimento e testes em cotações com 100% de simulação. Cada transação é protegida por algoritmos de fechamento multinível . Sinal de negociação real: Arquivo de configurações reais: CLIQUE Prazo: M1 Pares de moedas: EURUSD, GBPUSD, USDCHF, EURGBP, USDCAD, AUDCAD, CHFJPY, EURCHF, USDJPY.
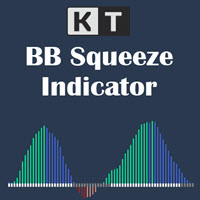
KT BB Squeeze measures the contraction and expansion of market volatility with a momentum oscillator, which can be used to decide a trading direction. It measures the squeeze in volatility by deducing the relationship between the Bollinger Bands and Keltner channels. Buy Trade: A white dot after the series of gray dots + Rising momentum above the zero line.
Sell Trade: A white dot after the series of gray dots + Rising momentum below the zero line. Markets tend to move from a period of low vol

KT Forex Volume shows the buying and selling volume of a currency pair in the form of a colored histogram. The volume is made of buying and selling transactions in an asset. In FX market: If the buying volume gets bigger than the selling volume, the price of a currency pair would go up. If the selling volume gets bigger than the buying volume, the price of a currency pair would go down.
Features Avoid the bad trades by confirming them using the tick volume data. It helps you to stay on the si

KT Fractal Channel Breakout draws a continuous channel by connecting the successive Up and Down fractals. It provides alerts and also plots the Up and Down arrows representing the bullish and bearish breakout of the fractal channel.
Features
If you use Bill Williams fractals in your technical analysis, you must also include it in your trading arsenal. It can be very effective and useful for stop-loss trailing. A new market trend often emerges after a fractal channel breakout in a new directi
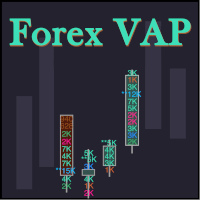
What do you see inside a candle? How to interpret the fight between bulls and bears? The candlestick chart brings a lot of information, but the volume is lacking in the candlestick body. This is where the Forex Volume At Price Expert Advisor comes in. This advisor searches for a set of recent trades, calculates the buy and sell attack volumes and prints on the candles, the volume value in each price range. You can also define up to ten colors to filter volumes and make it easier to
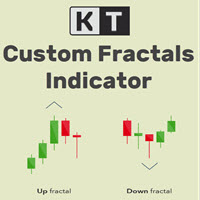
KT Custom Fractals is a personal implementation of the Fractal indicator first introduced by Bill Williams. With KT Custom Fractals you can choose a custom number of bars to allow to the left and right side of the fractal. For example, you can display the fractals that have "three" successive bars with the highest high in the middle and one lower high on both sides , or you can display the fractals that have "Eleven" consecutive bars with the lowest low in the middle and five higher lows on bot

The Vortex Indicator was first presented by Douglas Siepman and Etienne Botes in January 2010 edition of Technical Analysis of Stocks & Commodities. Despite its based on a complex implosion phenomenon, the vortex is quite simple to interpret. A bullish signal is generated when +VI line cross above the -VI line and vice versa. The indicator is mostly used as a confirmation for trend trading strategies. The Vortex was inspired by the work of Viktor Schauberger, who studied the flow of water in tur

Get a free complementary EA after your purchase! Contact me and ill provide it for you.
MT4 Version: https://www.mql5.com/en/market/product/79920
Time frame: M1
Leverage : Higher the better
Spread: Lower the better
Account type : All types
(EA may enter hedge positions, if you want to disable this feature deactivate either Buy, or Sell from the setting)
Please please do not take unnecessary r
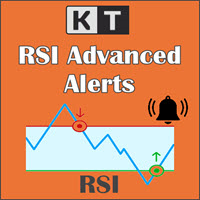
KT RSI Alerts is a personal implementation of the Relative Strength Index (RSI) oscillator that provide signals and alerts on four custom events: When RSI enter in an overbought zone. When RSI exit from an overbought zone. When RSI enter in an oversold zone. When RSI exit from an oversold zone.
Features A perfect choice for traders who speculate the RSI movements within an overbought/oversold zone. It's a lightly coded indicator without using extensive memory and resources. It implements all
KT CCI Alerts is a personal implementation of the Commodity Channel Index (CCI) oscillator that provide signals and alerts on four custom events: When CCI enter in an overbought zone. When CCI exit from an overbought zone. When CCI enter in an oversold zone. When CCI exit from an oversold zone.
Features A perfect choice for traders who speculate the CCI movements within an overbought/oversold zone. Lightly coded without using extensive memory and resources. It implements all Metatrader alerts

KT SuperTrend is a modified version of the classic SuperTrend indicator with new useful features. Whether its Equities, Futures, and Forex, the beginners' traders widely use the Supertrend indicator. Buy Signal: When price close above the supertrend line.
Sell Signal: When price close below the supertrend line.
Features
A multi-featured SuperTrend coded from scratch. Equipped with a multi-timeframe scanner. The last signal direction and entry price showed on the chart. All kinds of MetaTra
KT Bollinger Bands Alert is a modified version of the classic Bollinger Bands added with price touch alerts and visible price tags for each band separately.
Alert Events
When the current price touches the upper Bollinger band. When the current price touches the middle Bollinger band. When the current price touches the lower Bollinger band.
Features Separate alert events for each band. Ability to specify a custom interval between each alert to prevent repetitive and annoying alerts. Added
KT TRSI is an oscillator built using a combination of RSI (Relative Strength Index), EMA (Exponential Moving Average), and SMA (Simple Moving Average). Compared to the classic RSI, a TRSI is less susceptible to false signals due to the SMA's smoothing factor. Moreover, it is also equipped with all kinds of Metatrader alerts.
Simple Entry Rules
Buy: When the Blue line(RSI) crosses above the Red line(TRSI). Sell: When the Blue line(RSI) crosses below the Red line(TRSI).
Advance Entry Rules
KT Aroon oscillator is the modified version of the original Aroon oscillator initially developed by Tushar Chande in 1995. It measures the time interval between the ongoing highs and lows and uses this deduction to calculate the market trend's direction and strength. It works on the notion that the price will form new highs consecutively during an uptrend, and during a downtrend, new lows will be formed. Buy Signal: When Aroon Up line cross above the Aroon Down line.
Sell Signal: When Aroon Do

Market Momentum Alerter Market Momentum Alerter will inform you about danger to operate in the market.
Imagine you see a very nice setup (Forex, Stocks, Indices) and you decide to place your trade...
And you finally lose your trade and don't understand what happened.
This can happen due to big operations in the market carried out by banks and big institutions.
These operations are invisible for most people.
Now with the Market Momentum Alerter you will be able to detect those operation
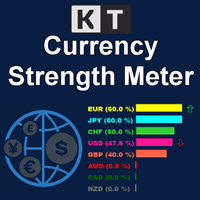
The KT Currency Strength Meter measures the individual currencies' strength and weakness by applying an aggregated mathematical formula over the major FX pairs. The strength is calculated using the bullish and bearish candles over a fixed period. After filling up the strength data, an algorithm sorts out the strongest and weakest currencies in a stack and updates their orders using the real-time incoming data.
Advantages
Improve your trading strategy instantly by filtering out the signals th
KT Bullish Bearish shows the bullish/bearish regime of the market in the form of a colored histogram representing both of the market states alternately. Bull Market (Blue Histogram): A bull market indicates an uptrend when an instrument price rises over a continued period like days, months, or years. Bear Market (Red Histogram): A bear market indicates a downtrend when an instrument price rises over a continued period like days, months, or years.
Applications
It prevents trading against the
KT Candle Timer shows the remaining time in the closing of the current bar. You can use the bar closing time for multiple purposes, including time and trade management during the trading hours.
Features
It also shows the Symbol spreads along with the remaining time. It offers two convenient timer display positions, i.e., chart corner or next to the current bar. From colors to text size, it offers full customization according to user preferences. It is optimized to work without using extensiv

Get a free complementary EA after your purchase! Contact me and ill provide it for you.
MT4 Version: https://www.mql5.com/en/market/product/67799
In this EA you will have two sources of income:
1- Direct trades
2- Rebates from your broker.
Thus insure to register under an IB that shares with you their revenues
Scalping! What a thrill!
Forex trading had been a source of income and thrill at the same time! (Forex is risky, you may loose all your capital)
With our new Expert Ad
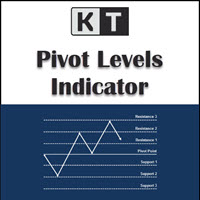
KT Pivot Points automatically plots the daily, weekly, and monthly pivot levels on a chart with the precise calculation based on the latest data. Pivot points is a widely used indicator in technical analysis, particularly in the Forex market.
Features
Send alerts when the price touches the pivot level. It offers complete customization for each kind of pivot level. Shows daily, weekly, and monthly pivot levels without any fuss. It uses minimum CPU resources for faster calculation. Compati
KT Pip Counter is a simple and informative indicator that shows some essential data and numbers on a real-time basis. Such critical information and data can benefit a trader during an intense trading session.
Features
Shows the current profit/loss in currency, pips, and percentage. Shows the current spreads. Shows the remaining time in the closing of the current bar. The different color schemes for profit/loss scenario. The text position and layout can be fully customized. It uses minimum

Утилита TemplateSwitcher позволяет автоматически переключать набор используемых на графике индикаторов и объектов в зависимости от текущего таймфрейма графика и/или символа. Часто бывает так, что на графике старшего таймфрейма используется индикатор с одним периодом расчета, а для младшего таймфрейма этот же индикатор необходим с увеличенным периодом расчета. Можно, конечно же, открыть два графика разных таймфреймов с нужными периодами индикатора. Но что, если мы не можем позволить себе дублиров

KT Heiken Ashi Alert plots the buy and sell arrows and generate alerts based on the standard Heiken Ashi candles. Its a must use tool for the traders who want to incorporate Heiken Ashi in their trading strategy. A buy arrow plotted when Heiken Ashi change to a bullish state from bearish state. A sell arrow plotted when Heiken Ashi change to a bearish state from bullish state. Mobile notifications, Email, Sound and Pop-up alerts included.
What exactly is Heiken Ashi? In Japanese, the term Hei
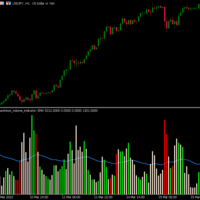
Hawkeye Volume Indicator contains a complex algorithm which executes over 300 calculations per bar in order to analyze the price action and associated volume, giving traders a tremendous advantage. Now Available in MT5 for U nlimited Use !
Volume is the only leading indicator which: .signals a price movement prior to it happening
.provides the fuel that drives the market Hawkeye Volume works in all markets and can be used in all timeframes for both tick and time charts – from longer term swing
KT Fisher Transform is an advanced version of the original Fisher Transform oscillator equipped with divergence detection, crossover alerts, and many more features. Originally it was developed by John F. Ehlers. It converts the asset's price into a Gaussian normal distribution to find the local extremes in a price wave.
Features
A light-weighted oscillator that efficiently identifies the upward and downward crossovers and marks them using vertical lines. It also finds regular and hidden div
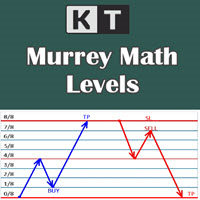
It shows the Murrey Math levels on chart and also provides an alert when price touch a particular level. T. Henning Murrey, in 1995, presented a trading system called Murrey Math Trading System, which is based on the observations made by W.D Gann.
Applications
For Murrey Math lovers, this is a must-have indicator in their arsenal. There is no need to be present on the screen all the time. Whenever the price touches a level, it will send an alert. Spot upcoming reversals in advance by specula

Get a free complementary EA after your purchase! Contact me and ill provide it for you.
MT4 Version: https://www.mql5.com/en/market/product/79770
Time frame: M1
Leverage : Higher the better
Spread: Lower the better
Account type : All types
(EA may enter hedge positions, if you want to disable this feature deactivate either Buy, or Sell from the setting)
Please please do not take unnecessary ris

The market eagle - it is a Secure Automated Software for trade Forex market and indices.This EA takes perspective of the market looking like an eagle. From a distance, observe the entire market amphitheater detecting the entry points and the best points to implement the algorithm based on the set that we indicate in the input.This system allows us to use the key points of the market to adapt them to our algorithms, trend and countertrend. The system uses multiple lot depending on the algorithm

PriceRunner MT5 The PriceRunner indicator is based on pure relative power. It gives promising results even in M1 timeframes in currency pairs and M2 in commodities and cryptos. The indicator is designed with user-friendly and simple settings. It is very suitable even for beginners who are interested in indicators and strategies. I am ready to make improvements on the indicator in line with the needs of those who buy or rent. However, even in its current state, you can see very promising results

KT MACD Alerts is a personal implementation of the standard MACD indicator available in Metatrader. It provides alerts and also draws vertical lines for the below two events: When MACD crosses above the zero line. When MACD crosses below the zero line.
Features It comes with an inbuilt MTF scanner, which shows the MACD direction on every time frame. A perfect choice for traders who speculate the MACD crossovers above/below the zero line. Along with the alerts, it also draws the vertical line
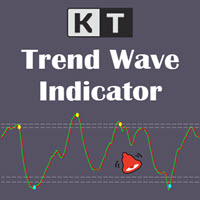
KT Trend Wave is an oscillator based on the combination of Price, Exponential, and Simple moving averages. It usually works great to catch the short term price reversals during the ongoing trending market. The bullish and bearish crossovers of the main and signal lines can be used as buy/sell signals (blue and yellow dot). It can also be used to find the overbought and oversold market. The buy and sell signals that appear within the overbought and oversold region are usually stronger.
Feature

Get a free complementary EA after your purchase! Contact me and ill provide it for you.
MT4 Version: https://www.mql5.com/en/market/product/79738
Time frame: M1
Leverage : Higher the better
Spread: Lower the better
Account type : All types
(EA may enter hedge positions, if you want to disable this feature deactivate either Buy, or Sell from the setting)
Please please do not take unnecessary ris

show live chart spot All symbol binance If you want to get this product with a 99% discount, send a message to my Telegram admin and rent this product for 1 $ per month or 10 $ per year. Even if you do not like the way the chart is displayed, you can tell the admin in Telegram how to display it so that your own expert is ready. https://t.me/Bella_ciao1997 https://t.me/Binance_to_mql5
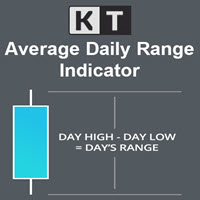
KT Average Daily Range(ADR) shows the upper and lower levels using the average daily range covered by the currency pair or the instrument. The average daily range is calculated using the chosen period in the input settings. ADR High: ADR upper level is found by adding the average daily range value to the current day's low.
ADR Low: ADR lower level is found by subtracting the ADR value from the current day's high.
Features
It shows the ADR levels with several other helpful information bene

Get a free complementary EA after your purchase! Contact me and ill provide it for you.
MT4 Version: https://www.mql5.com/en/market/product/79715 Minimum deposit is 1000$ , or 1000 Cent = 10$. (Recommended 1500$) Every 1000$ = 0.01 Lot. Please stick to the rules, as we want you to win, win and win! (Trading is risky, and there are no guarantees for winning)
Time frame: M1
Leverage : Higher the bette
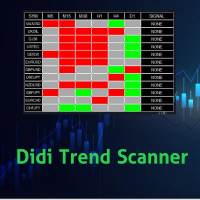
Didi Trend Scanner is an indicator for scanning market watch and detect market direction for each Time Frames and give signals for each pair
You can make decision of making trades by this scanner that specify market trend direction for you For each time frame you can add and remove any pairs you want to scan the scanner send alert via push notifications and email

A deep learning neural network specially designed for the Forex market. It works on EURUSD, GBPUSD, AUDUSD, NZDUSD, USDCHF, USDCAD, USDJPY pairs. Everything is already set up. To start trading, simply set the Expert on the EURUSD H1 chart. The minimum deposit, when trading all currency pairs, is $ 150. User-friendly interface.
Monitoring of real accounts: Our products undergo mandatory testing on real accounts. At the moment, this is the only way to reliably check trading robots. Real account

Best indicator for MT5 providing accurate and sniper signals to enter a trade without repainting!
It can be applied to any financial assets: forex, synthetic, cryptocurrencies, metals, stocks, indices . It will provide pretty accurate trading signals and tell you when it's best to open a trade and close it. Most traders improve their trading results during the first trading week with the help of the Power Indicator Pro.
Benefits of the Power Indicator Pro
Entry signals without repa

Get a free complementary EA after your purchase! Contact me and ill provide it for you.
MT4 Version: https://www.mql5.com/en/market/product/79684 Minimum deposit is 1000$ , or 1000 Cent = 10$. (Recommended 1500$) Every 1000$ = 0.01 Lot. Please stick to the rules, as we want you to win, win and win! (Trading is risky, and there are no guarantees for winning)
Time frame: M1
Leverage : Higher the bette

Petani Uanx MT5 - is a Integrated Pair Expert Advisor. this is Multi-Currency(MultiPair) EA, Dynamic Trading Logic, and has a profit or loss security Only for purchase now for$199! Next price --> $499
The main strategy uses scalping at the speed of candles per second, the system only focuses on Small and Stable Profits. EA can use Hedging, Martingale, or and not use other dangerous strategies. It uses a fixed stop loss for each position or closed orders integrated with all open
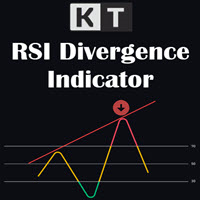
KT RSI Divergence shows the regular and hidden divergences built between the price and Relative Strength Index (RSI) oscillator. Divergence can depict the upcoming price reversal, but manually spotting the divergence between price and oscillator is not an easy task.
Features
Ability to choose the alerts only for the divergences that occur within an overbought/oversold level. Unsymmetrical divergences are discarded for better accuracy and lesser clutter. Support trading strategies for trend r

KT ROC divergence shows the regular and hidden divergences build between the price and Rate of change oscillator. Rate of change (ROC) is a pure momentum oscillator that calculates the change of percentage in price from one period to another. It compares the current price with the price "n" periods ago. ROC = [(Close - Close n periods ago) / (Close n periods ago)] * 100 There is an interesting phenomenon associated with ROC oscillator. In ROC territory there is no upward limit, but there is a do

KT Inside Bar plots the famous inside bar pattern in which the bar carries a lower high and higher low compared to the previous bar. The last bar is also known as the mother bar. On smaller time-frames, the inside bar sometimes appears similar to a triangle pattern.
Features
Also plots entry, stop-loss, and take-profit levels with the inside bar pattern. No complex inputs and settings. Erase unwanted levels when the price reaches the entry line in either direction. All Metatrader alerts incl

KT Auto Trendline draws the upper and lower trendlines automatically using the last two significant swing highs/lows. Trendline anchor points are found by plotting the ZigZag over X number of bars.
Features
No guesswork requires. It instantly draws the notable trendlines without any uncertainty. Each trendline is extended with its corresponding rays, which helps determine the area of breakout/reversal. It can draw two separate upper and lower trendlines simultaneously. It works on all timefr
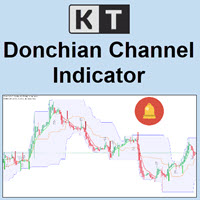
KT Donchian Channel is an advanced version of the famous Donchian channel first developed by Richard Donchian. It consists of three bands based on the moving average of last high and low prices. Upper Band: Highest price over last n period. Lower Band: Lowest price over last n period. Middle Band: The average of upper and lower band (Upper Band + Lower Band) / 2. Where n is 20 or a custom period value is chosen by the trader.
Features
A straightforward implementation of the Donchian channel
Por favor habilite esse site https://openexchangerates.org/ em webrequest em Ferramentas -> Opções -> Expert Advisors
esse utilitário tem como função atualizar o banco de dados com as cotações dia após dia de todos os pares de moedas. os meus robôs e indicadores que calculam lote utilizam esses dados para se guiarem com relação a conta em uma moeda e ativo em outra. Exemplo conta em USD e EURJPY em outra moeda base que não seja o USD. Eu utilizo o feed de dados pago para atualização em mult

KT Custom High Low shows the most recent highs/lows by fetching the data points from multi-timeframes and then projecting them on a single chart. If two or more highs/lows are found at the same price, they are merged into a single level to declutter the charts.
Features
It is built with a sorting algorithm that declutters the charts by merging the duplicate values into a single value. Get Highs/Lows from multiple timeframes on a single chart without any fuss. Provide alerts when the current

KT Absolute Strength measures and plots the absolute strength of the instrument's price action in a histogram form. It combines the moving average and histogram for a meaningful illustration. It supports two modes for the histogram calculation, i.e., it can be calculated using RSI and Stochastic both. However, for more dynamic analysis, RSI mode is always preferred.
Buy Entry
When the Absolute Strength histogram turns green and also it's higher than the previous red column.
Sell Entry
W

The indicator is a trading system for AUDUSD or NZDUSD currency pairs.
The indicator was developed for time periods: M15, M30.
At the same time, it is possible to use it on other tools and time periods after testing.
"Kangaroo Forex" helps to determine the direction of the transaction, shows entry points and has an alert system.
When the price moves in the direction of the transaction, the maximum length of the movement in points is displayed.
The indicator does not redraw, all actio
KT Forex Session shows the different Forex market sessions using meaningful illustration and real-time alerts. Forex is one of the world's largest financial market, which is open 24 hours a day, 5 days a week. However, that doesn't mean it operates uniformly throughout the day.
Features
Lightly coded indicator to show the forex market sessions without using massive resources. It provides all kinds of Metatrader alerts when a new session starts. Fully customizable.
Forex Session Timings I
Be sure to consult with me before buying.
The robot trades based on support and resistance levels. You can use weekly and monthly times for less risk. More risk in daily and 4-hour times. Be sure to disable the robot at news times.Works on all currency pairs, indices, commodities and metals. Only observing the trade at the time of news will make this robot profitable. Automatic news management will be added in future versions.
benefits:
Works on all instruments and time series,

Only 5 copies of the EA at $30! Next price --> $45 This robot works on the basis of bowling band and has stepped entrances at safe points.
benefits:
Works on all instruments and time series,
It has excellent inputs for position management that can avoid a lot of risk.
Input settings:
Volume: Selects a fixed volume for the trade that uses its own risk management if it is zero.
Risk for all positions: The amount of risk for all positions in one direction,

KT Risk Reward shows the risk-reward ratio by comparing the distance between the stop-loss/take-profit level to the entry-level. The risk-reward ratio, also known as the R/R ratio, is a measure that compares the potential trade profit with loss and depicts as a ratio. It assesses the reward (take-profit) of a trade by comparing the risk (stop loss) involved in it. The relationship between the risk-reward values yields another value that determines if it is worth taking a trade or not.
Featur

Trend Direction Up Down Indicator Trend Direction Up Down is part of a series of indicators used to characterize market conditions.
Almost any strategy only works under certain market conditions.
Therefore it is important to be able to characterize market conditions at any time: trend direction, trend strength, volatility.
Trend Direction Up Down is an indicator to be used to characterize trend direction (medium term trend):
trending up trending down ranging Trend Direction Up Down is ba

Trend Strength MA indicator Trend Strength MA is a part of a series of indicators used to characterize market conditions.
Almost any strategy only works under certain market conditions.
Therefore, it is important to be able to characterize market conditions at any time: trend direction, trend strength, volatility, etc.
Trend Strength MA is an indicator to be used to characterize trend strength:
Up extremely strong Up very strong Up strong No trend Down strong Down very strong Down extrem

Trend Direction ADX indicator Trend Direction ADX is part of a serie of indicators used to characterize market conditions.
Almost any strategy only work under certain market conditions.
Therefore it is important to be able to characterize market conditions at any time: trend direction, trend strength, volatility, etc..
Trend Direction ADX is an indicator to be used to characterize trend direction:
trending up trending down ranging Trend Direction ADX is based on ADX standard indicator.
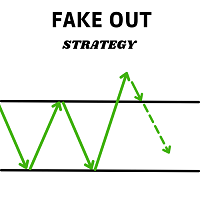
This expert advisor finds and operates the Fake out pattern, the search algorithm and its management can be adjusted from the Bot's configuration parameters.
Features: - Designed to operate with any type of asset.
- It is possible to set the time range in which the expert advisor will operate.
- Trailing stop managed internally by the algorithm.
- Partial position closing (partial profit taking), when the price has moved in favour of the position.
- Take profit automatically adjusted

The Analytical cover trend indicator is a revolutionary trend trading and filtering solution with all the important features of a trend tool built into one tool! The Analytical cover indicator is good for any trader, suitable for any trader for both forex and binary options. You don’t need to configure anything, everything is perfected by time and experience, it works great during a flat and in a trend.
The Analytical cover trend indicator is a tool for technical analysis of financial markets

According to Sir Isaac Newton's 3rd law, every action has its reaction and every movement must be compensated by an opposite movement of equal magnitude. The market cannot be oblivious to this physical principle, so when the force of gravity in the market of the big sharks hides like the sun behind the horizon, the night session allows us to see this law in all its splendor. This EA takes advantage of this movement to trade in the night session . Newton´s third law is designed to operate in the
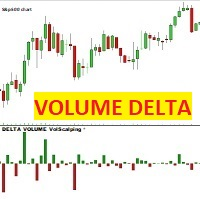
VOLUME DELTA Volscalping Este indicador, para cada vela de preço, desenha uma vela Delta, que é a diferença entre os contratos comprados e vendidos. A vela será vermelha e negativa se os contratos negociados na oferta (vendidos) excederem os da venda, ao contrário, a vela será verde e positiva se os contratos negociados em ASK (comprados) excederem os da oferta.
ATENÇÃO: O indicador só funciona com corretoras que fornecem fluxo real de dados do mercado, e que dividem os contratos firmados em
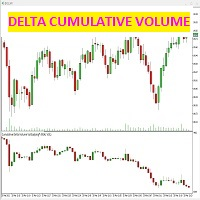
este indicador detecta a diferença entre os contratos atingidos no bid e no ask (agressão) para cada vela.
o indicador mostra na janela dedicada abaixo do gráfico de preços, velas dadas precisamente pela diferença entre os contratos vendidos e comprados, que geram a força volumétrica do mercado.
é possível (veja nas capturas de tela) como selecionar apenas o gráfico delta de velas cumulativas, ou mesmo com uma linha de tendência das próprias velas: selecionando a segunda caixa u "NONE" nenh
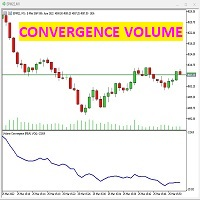
este indicador mostra a força do volume real em relação ao preço. se o gráfico de preços e a tendência de volume tiverem a mesma tendência, significa que tudo está regular. se o indicador divergir do gráfico de preços, significa que a reversão está próxima. quando o preço sobe e o gráfico de "convergência de volume" desce, significa que o dinheiro está saindo do mercado, os vendedores estão vendendo em alta e o preço deve começar a cair em breve. inversamente, se o gráfico de "convergência de v
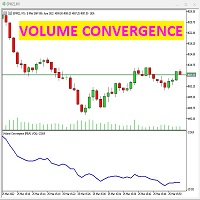
este indicador mostra a força do volume real em relação ao preço. se o gráfico de preços e a tendência de volume tiverem a mesma tendência, significa que tudo está regular. se o indicador divergir do gráfico de preços, significa que a reversão está próxima. quando o preço sobe e o gráfico de "convergência de volume" desce, significa que o dinheiro está saindo do mercado, os vendedores estão vendendo em alta e o preço deve começar a cair em breve. inversamente, se o gráfico de "convergência de v

DreamlinerEA Live Results: https://www.mql5.com/en/signals/1459431
DreamlinerEA MT4 version: https://www.mql5.com/en/market/product/72691 DreamlinerEA is a fully automated Expert Advisor based on the author's trading strategy. During a period of low market volatility, when liquidity is not enough for the formation of a trend and breakdown of important levels, the system trades in the Channel and use small TP values (scalping) to quickly fix profit and re-enter the market, which sign
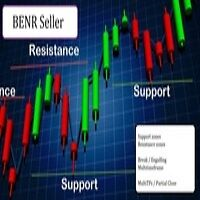
This EA allows you to manage support and resistance zones on MetaTrader 5…but not only: To your buying and selling zones (you can configure 2 sellings zones and 2 buyings zones),
you can add 3 options (2 with multiframes) to enter a position:
Option 1: this is the option that enters a position without a signal: as soon as the price reaches the zone, the robot sends a trade.
Option 2: here the robot will wait for a break in the selected timeframe. Example: you put your zones on an H4 graph
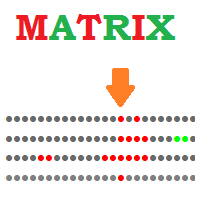
Matrix Indicator Matrix Indicator is a simple but effective indicator.
Matrix indicator displays usual oscillators indicators in a user friendly color coded indicator.
This makes it easy to identify when all indicators are aligned and spot high probability entries.
Inputs of indicator are:
Indicator: RSI, Stochastic, CCI, Bollinger Bands Param1/Param2/Param3: usual settings for the indicator ValueMin: Oversold level for oscillator ValueMax: Overbought level for oscillator The indicator
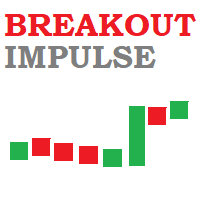
Breakout Impulse Indicator Breakout Impulse Indicator is a pattern recognition indicator for Forex, Stocks, Indices, Futures, Commodities and Cryptos.
The Breakout Impulse is a multi-bar pattern.
The purpose of the pattern is to identify a fast change in momentum.
This type of change can announce the start of a big directional move.
Inputs of the indicator are:
Distance : distance in pixel relative to top or bottom of candle to display the arrow symbol MaxBars : number of bars back u
Smart Moving Averages Indicator Smart Moving Averages is an exclusive indicator for Metatrader platform.
Instead of calculating moving averages for the selected chart time frame, the Smart Moving Averages indicator gives you the opportunity to calculate moving averages independently from the chart time frame.
For instance you can display a 200 days moving average in a H1 chart.
Inputs of the indicator are:
Timeframe : timeframe to be used for the calculation of the moving average Perio
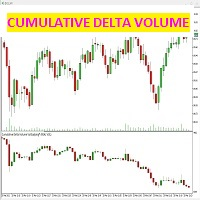
este indicador detecta a diferença entre os contratos atingidos no bid e no ask (agressão) para cada vela.
o indicador mostra na janela dedicada abaixo do gráfico de preços, velas dadas precisamente pela diferença entre os contratos vendidos e comprados, que geram a força volumétrica do mercado.
é possível (veja nas capturas de tela) como selecionar apenas o gráfico delta de velas cumulativas, ou mesmo com uma linha de tendência das próprias velas: selecionando a segunda caixa u "NONE" nenh
O Mercado MetaTrader é um site simples e prático, onde os desenvolvedores podem vender seus aplicativos de negociação.
Nós iremos ajudá-lo a postar e explicar como descrever o seu produto para o mercado. Todos os aplicativos no Mercado são protegidos por criptografia e somente podem ser executados no computador de um comprador. Cópia ilegal é impossível.
Você está perdendo oportunidades de negociação:
- Aplicativos de negociação gratuitos
- 8 000+ sinais para cópia
- Notícias econômicas para análise dos mercados financeiros
Registro
Login
Se você não tem uma conta, por favor registre-se
Para login e uso do site MQL5.com, você deve ativar o uso de cookies.
Ative esta opção no seu navegador, caso contrário você não poderá fazer login.