Conheça o Mercado MQL5 no YouTube, assista aos vídeos tutoriais
Como comprar um robô de negociação ou indicador?
Execute seu EA na
hospedagem virtual
hospedagem virtual
Teste indicadores/robôs de negociação antes de comprá-los
Quer ganhar dinheiro no Mercado?
Como apresentar um produto para o consumidor final?
Novos Expert Advisors e Indicadores para MetaTrader 5 - 179

The indicator displays the "Morning star" and "Evening star" patterns on a chart.
The Evening star is displayed in red or rose. The Morning star is displayed in blue or light blue.
Input Parameters: Max Bars – number of bars calculated on the chart. Make Signal Alert – use alerts. Send Push Notification - send notification to a mobile terminal Type of rules pattern – type of the model of pattern determination (Hard – with the control of length of shadows of the second bar). If Soft is select
Tails is an indicator that predicts where the price will rebound and reach in a day candle. This indicator does not repaint and is to be used in time frames below D1. By default, the indicator will plot two support and two resistance lines. If needed, you can set the extended levels to "true" to show three support and three resistance lines. Input Parameters Extended_Levels - show extended levels in the chart; Clr_Support - color for the support lines; Clr_Resistance - color for the resistance

tO indicador é destinado ao reconhecimento e marcação dos padrões 1-2-3 comprar e vende de um gráfico. O indicador vai ajudar um negócio para determinar o início e o sinal de fractais, e especificar os possíveis pontos de entrada em todos os tempos do МetaTrader 5. Linhas de Fibonacci são desenhados no gráfico para indicar supostos alvos de movimento sobre a base da teoria ondulatória. As formações 1-2-3 parecem ser especialmente importante como as divergências (convergências) são formados em to
This indicator is used to compare the relative strength of the trade on the chart against the other several selected symbols.
By comparing the price movement of each traded variety based on the same base day, several trend lines of different directions can be seen, reflecting the strong and weak relationship between the several different traded varieties, so that we can have a clearer understanding of the market trend. For example, you can apply this indicator on a EurUSD chart and compare it

MACD ponderado por volume Volume Weighted MACD (VW-MACD) foi criado por Buff Dormeier e descrito em seu livro Investing With Volume Analysis. Representa a convergência e a divergência das tendências de preços ponderadas por volume.
A inclusão de volume permite que o VW-MACD seja geralmente mais responsivo e confiável do que o MACD tradicional.
O que é MACD (Moving Average Convergence Divergence)?
A divergência de convergência média móvel foi criada por Gerald Appel em 1979. O MACD pad
Spearman Rank Correlation indicator featuring enhanced entry and reverse signals Any overbought or oversold zone can be adjusted using Cross Buy or Cross Sell levels (Option 1 = true; Cross Buy and Cross Sell are set by user, if Option 1 = false, it means that this option of generating signals is not applicable). The signals can be generated by crossing over the 0 level, this is Option 2. Please note that there are no reverse levels attached to this option. This option is set up as supplementary

This version of Stochastic evaluates the probability of taking the specified profit in points. The appropriate value is set in the parameters, and the product automatically shows possible options for the market it is currently applied to. There are much more options and the information is more extensive compared to conventional Stochastic (see the screenshots). Signals: The yellow channel is absent (flat movement, market entry is not recommended). The yellow channel is narrowing (trend is formin

Informer for VPS - report on the state of your account via e-mail. Useful for controlling your Expert Advisors that run on a VPS or a dedicated computer. Information about open positions and last deals for a day, week, month or year grouped by currency pairs. Adjustable periodicity of reports and depth of deals included in the report. A possibility to add own comment to each report. You will receive reports on e-mail with specified periodicity: from 15 minutes to once a day. The reports are sen

This indicator shows Pin Bar candlestick pattern on the chart.
The bearish pin bars have red color, the bullish pin bars have blue color. The indicator shows alert when Pin Bar candlestick pattern is formed. It's recommended to use it at timeframes H1 and higher. The best moment (strong signal) is when Pin Bar is formed close to the support/resistance level.

The Period separators indicator separates time periods, specified by user.
It supports all timeframes, greater or aliquot to current timeframe. In case of the incorect timeframe, the indicator modifies it to closest correct value. Additional bonus - the separation of non-standard time periods - MOON, MOON/2, MOON/4 (moon phases). The separators are plotted using the indicator's buffers. The indicator uses one graphic object for information about the progress and current bar properties. The grap
FREE
This indicator is based on a classic Commodity Channel Index (CCI) indicator. Multi TimeFrame indicator MTF-CCI shows CCI data from the 4 timeframes by your choice. By default this indicator has external parameters: TF1 = 1; TimeFrame2b = true; TF2 = 5; TimeFrame3b = true; TF3 = 15; TimeFrame4b = true; TF4 = 60; InpPeriod = 13; InpPRICE = 5; You can change TF1-TF4 in the next limits: TF1 from M1 (1) to H4 (240) TF2 from M5 (5) to D1 (1440) TF3 from M15 (15) to W1 (10080) TF4 from M30 (30) to MN1
This indicator is based on a classic Momentum indicator. Multi TimeFrame indicator MTF-Momentum shows data from the 4 timeframes by your choice. By default this indicator has external parameters: TF1 = 1; TimeFrame2b = true; TF2 = 5; TimeFrame3b = true; TF3 = 15; TimeFrame4b = true; TF4 = 60; InpPeriod = 14; InpappPRICE = 0; You can change TF1-TF4 in the next limits: TF1 from M1 (1) to H4 (240) TF2 from M5 (5) to D1 (1440) TF3 from M15 (15) to W1 (10080) TF4 from M30 (30) to MN1 (43200) All chos
This indicator is based on a classic DeMarker indicator. Multi TimeFrame indicator MTF-DeMarker shows data from the 4 timeframes by your choice. By default this indicator has external parameters: TF1 = 1; TimeFrame2b = true; TF2 = 5; TimeFrame3b = true; TF3 = 15; TimeFrame4b = true; TF4 = 60; InpPeriod = 14; You can change TF1-TF4 in the next limits: TF1 from M1 (1) to H4 (240) TF2 from M5 (5) to D1 (1440) TF3 from M15 (15) to W1 (10080) TF4 from M30 (30) to MN1 (43200) All chosen TFs should be
This indicator is based on a classic Moving Average indicator. Moving averages help us to first define the trend and second, to recognize changes in the trend. Multi TimeFrame indicator MTF-MA shows MA data from the 4 timeframes by your choice. By default this indicator has external parameters: TF1 = 1; TimeFrame2b = true; TF2 = 5; TimeFrame3b = true; TF3 = 15; TimeFrame4b = true; TF4 = 60; InpPSARStep = 0.02; InpPSARMaximum = 0.2; You can change TF1-TF4 in the next limits: TF1 from M1 (1) to H4
This product is used to check the foreign exchange market history datas. Good quality historical datas is important for traders to perform market analysis or back testing. But the quality of historical datas provided by various foreign exchange brokers is uneven. Sometimes we notice missing k-line sequences, but sometimes it is not easy to detect them. This product helps users locate these missing locations.If there are many gaps in a given period of time on a chart, you need to be careful about

Panel for simplify trade operations. It contains tabs: InfoRisk - helps to estimate the current risks of open positions and orders;
StopToProfit - allows to change the Stop Loss and Take Profit levels;
Traling - Trailing Stop of the opened position;
PositionClosing - Closure of several positions;
OrdersDeleting - Removes a group of pending orders;
PositionAdding - Used to add (open) to the opened position.

This is a trend indicator, as you can see here. When the white line is above the red, it means a bull market. Conversely, the white line below the red line is a bear market. This index is suitable for long - term trading and is suitable for most trading varieties. --------------------------------------------------------------------------------------------
This indicator let user clearly see Buy/Sell signals. When a bar is closed and conditions meet, arrow signal will come up at Close Price, up is Buy and down is Sell. It works on all Timeframes. And you can set sound alert when signals come up.

。。。。。。。。。。。。。。。。。。。。。。。。。。。。。。。。。。。。。。。。。。。 This indicator is based on Bollinger Bands indicator. It helps user clearly know the Band is expand or contract.
The method of use is the same as the traditional Brin channel index. Users can use different color areas to distribute forest channel indicators in expansion or contraction stage. -------------------------------------------------------------------------------------------
FREE
Painel de negociação para negociação em 1 clique. Trabalhando com posições e pedidos! Negociar a partir do gráfico ou do teclado. Com nosso painel de negociação, você pode executar negociações com um único clique diretamente no gráfico e realizar operações de negociação 30 vezes mais rápido do que com o controle MetaTrader padrão. Cálculos automáticos de parâmetros e funções tornam a negociação mais rápida e conveniente para os traders. Dicas gráficas, rótulos informativos e informações completa

The Expert Advisor for increasing (or opening) market positions. Allows specifying the desired risk, target and searching for the best open price and trade volume. It is included in the ActivePanel product.
Configurable Parameters:
lots - directly the volume of the position increase. % equity - the amount of growth as a percentage of the amount of funds. stop loss - directly the level of the stop loss order. loss - the level of the stop loss order depending on the allowable loss. take profit
This script allows traders to easily close positions if their profit/loss reaches or exceeds a value specified in pips.
The script allows users to easily close positions if their profit/loss reaches or exceeds a value specified in pips. Please set slippage value first. Sometimes some positions do not close due to high volatility of the market. Please set larger slippage or restart the script.
............................................................................................

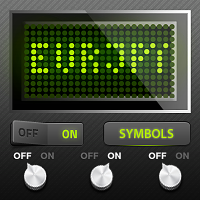
This script alerts a user via sounds and alert box at the end of a countdown. It is like an alarm clock. There are 2 ways to start counting down: Set a value of remaining minutes. Example: if you need an alert after 1 hour, set it to 60. Set countdown end time. If you like to use a custom sound for the alert, copy your sound files to "terminal_path\Sounds" folder and set the exact file name in the input parameters. The sound file must be in *.wav format.

Este indicador scalper mostra os momentos, quando você pode ganhar com segurança 10 pontos de lucro e risco de apenas 2 pontos. Ele permite aumentar consideravelmente o depósito durante o dia, se a gestão do dinheiro for propriamente usada.
O indicador tem apenas um parâmetro de entrada - número de barras, utilizado para o cálculo da tendência. Quando o sinal aparecer, coloque a ordem pendente no preço, dois pontos a mais que o preço atual (para comprar) ou 2 pontos menor para o preço atual de

This utility is used to visually choose an indicator for trailing stop and select its parameters. The Expert Advisor modifies the Stop Loss order position opened for the instrument of the current chart based on indicator values. Uses indicators Parabolic SAR , NRTR (Nick Rypock Trailing Reverse) , Moving Average or linear regression channel. The indicators are added to or removed from the chart using the 'show' checkbox.
The following options are available: Parabolic - trailing stop based on t

Custom Panel allows you to gather all kind of important information and display it as one handy table in the upper right corner of the chart.
You can choose the contents of the panel yourself. Every row will show your own customized condition or value. Every column shows a different timeframe. The panel may contain up to 10 rows and up to 8 columns. Sample usage Row : Price > EMA(30)
Mode : YES_NO
Meaning : is current price above EMA(30)
Row : Ask < Bands[L]
Mode : YES_NO
Meaning : is cur
FREE

Expert Advisor removes a group of pending orders. Orders are grouped by type. Orders are grouped by entry.
It is possible to form groups arbitrarily directly in the table. Эксперт удаляет группы отложенных ордеров. Ордера группируются по типам. Ордера группируются по направлениям.
Есть возможность формировать группы произвольно непосредственно в таблице.

MACD Histogram tracks the difference between the MACD line and the Signal line (which is the exponential moving average of the first line). For better visibility, when plotting the lines and the histogram in the same window, we scale up the histogram by a factor of 2. Furthermore, we use two separate plots for the histogram, which allows us to color-code the bars for upticks and downticks. The MACD Combo overlays MACD lines on MACD Histogram. Putting both plots in the same window enables you to

Expert Advisor to change the Stop Loss and Take Profit levels. It is possible to set stop levels according to the specified profit/loss. You can set the price level directly. Эксперт для изменения уровней Stop Loss и Take Profit открытой позиции. Есть возможность задавать уровни стопов в соответствии с заданной прибылью/убытком. Можно задать непосредственно ценовой уровень ордеров Stop Loss и Take Profit.

The Expert Advisor performs closure of several positions. Positions are grouped by type. You can select the position of largest profit(losses). It is possible to form groups at random. Эксперт выполняет торговые операции группового закрытия позиций. Позиции группируются по типу. Можно выбрать один из трех параметров: filter Off. Buy only. Sell only.
Можно отбирать позиции по величине прибыли(убыткам). filter Off. Wins only. Losses only. и/или задать порог по достигнутой прибыли(убыткам). Есть

The MACD XOver indicator was developed by John Bruns to predict the price point at which MACD Histogram will reverse the direction of its slope.
The indicator is plotted one day ahead into the future, allowing, if your strategy depends on MACD Histogram, to predict its reversal point for tomorrow (or the next bar in any timeframe). If the closing price tomorrow is above the value of this indicator, then MACD Histogram will tick up. If the closing price tomorrow is below the value of this indica

The Market Thermometer is described in "Come into my Trading Room" book. It measures the degree of volatility, as reflected in greater or smaller intraday ranges. When the Market Temperature spikes above its average or stays below its average for a number of days, it gives trading signals, as described in the book. Parameters: Thermometer_EMA_Length (22) – The length of the moving average of the Market Temperature. The default 22, the average number of trading days in a month. Spike_Alert_Facto

SafeZone is a method for setting stops on the basis of recent volatility, outside the level of market noise. It is described in "Come into my Trading Room" book. In an uptrend, SafeZone defines noise as that portion of the current bar that extends below the low of the previous bar, going against the prevailing trend. It averages the noise level over a period of time and multiplies it by a trader-selected factor.
For long trades, SafeZone subtracts the average noise level, multiplied by a facto

One of the key rules in trading is never move your stops in such a way that your risk increases. Our stop sequence shows the automatic tightening of stops. They appear as a series of decreasing risk points until the trade is eventually stopped out.
The problem is that if you enter a trade at any other point than the initial dot of the sequence, you may be placing the stop too close. Stop-entry plots show you the initial value for the stop for each bar. You can use them when you put on a trade,

SafeZone is a method for setting stops on the basis of recent volatility, outside the level of market noise. It is described in "Come into my Trading Room" book.
In a downtrend, SafeZone defines noise as the portion of the current bar that extends above the high of the previous bar, against the downtrend. It averages the noise level over a period of time and multiplies it by a trader-selected factor. For short trades, it adds the average noise level, multiplied by a factor, to the latest high

One of the key rules in trading is never move your stops in such a way that your risk increases. Our stop sequence shows the automatic tightening of stops. They appear as a series of decreasing risk points until the trade is eventually stopped out.
The problem is that if you enter a trade at any other point than the initial dot of the sequence, you may be placing the stop too close. Stop-entry plots show you the initial value for the stop for each bar. You can use them when you put on a trade,

The Reverse Bar indicator paints the reversal bars according to trade strategy, described by Bill Williams in "Trading Chaos. Maximize Profits with Proven Technical Techniques" book. The bearish reversal bar has red or pink color (red-stronger signal) The bullish reversal bar has blue or light blue color(blue - stronger signal) It is recommended to use it on hourly timeframe (H1) and higher.

O Impulse System foi descrito pela primeira vez no livro "Come into my Trading Room". Ele usa a direção do histograma MACD e uma média móvel exponencial (MME) de preço para definir um impulso. A regra é nunca negociar contra o impulso.
Seu código de cores fornece vários sinais: Quando a MME e o histograma MACD estão subindo, as cores do sistema Impulse a cor da barra é verde (curto-circuito não é permitido). Quando a MME e o histograma MACD estão caindo, as cores do sistema Impulse a cor da b

Elder-Ray is made of both Bulls Power and Bears Power as described in "Come into my Trading Room" book. It is tracking the relative power of bulls and bears by measuring how far the high and the low of each bar get away from the average price. Elder-ray is an indicator developed by Dr. Elder and named for its similarity to x-rays. It shows the structure of bullish and bearish power below the surface of the markets. Elder-ray combines a trendfollowing moving average with two oscillators to show w

The Chandelier Exit, introduced by Charles LeBeau, is described in "Come into My Trading Room" book.
It calculates each stop on a long position in an uptrend from the highest point reached during that rally, and gets its name from the chandelier, which hangs from the highest point in the room. The Chandelier Exit uses a multiple of the Average True Range (ATR), subtracting it from the highest high since the trade was entered. It creates a new trade whenever the previous trade is stopped out. Ch

One of the key rules in trading is never move your stops in such a way that your risk increases. Our stop sequence shows the automatic tightening of stops. They appear as a series of decreasing risk points until the trade is eventually stopped out.
The problem is that if you enter a trade at any other point than the initial dot of the sequence, you may be placing the stop too close. Stop-entry plots show you the initial value for the stop for each bar. You can use them when you put on a trade,

The Chandelier Exit, introduced by Charles LeBeau, is described in "Come into My Trading Room" book. It calculates each stop on a short position in a downtrend from the lowest point reached during that decline. The Chandelier Exit uses a multiple of the Average True Range (ATR), adding it to the lowest low since the trade was entered. It creates a new trade whenever the previous trade is stopped out. Chandelier Stops differ from traditional stops by having the ability to move against you if the

One of the key rules in trading is never move your stops in such a way that your risk increases. Our stop sequence shows the automatic tightening of stops. They appear as a series of decreasing risk points until the trade is eventually stopped out.
The problem is that if you enter a trade at any other point than the initial dot of the sequence, you may be placing the stop too close. Stop-entry plots show you the initial value for the stop for each bar. You can use them when you put on a trade,

The purpose of Impulse Release is to prevent trading in the wrong direction. While the Impulse System operates in a single timeframe, Impulse Release is based on two timeframes. It tracks both the longer and the shorter timeframes to find when the Impulse points in the same direction on both. Its color bar flashes several signals: If one timeframe is in a buy mode and the other in a sell mode, the signal is "No Trade Allowed", a black bar. If both are neutral, then any trades are allowed, showi

The Smoothed ROC indicator, developed by Fred Schutzman, is described in "Trading for a Living" book. It is created by calculating the rate of change for an exponential moving average of closing prices. When it changes direction, it helps identify and confirm trend changes. Parameters Smoothing_EMA_Length (13) – The length of the EMA used for smoothing; ROC_Period (21) – The length of the rate of change calculation.

This indicator allows to display Renko charts in the indicator window. Renko charts show only price movements that are bigger than the specified box size. It helps to eliminate noise and allows to focus on main trends.
Time is not a factor here. Only price movements are taken into account. That's why Renko chart is not synchronized with the main chart it is attached to. Indicator works in two modes: CLOSE - only close prices are taken into account while building the chart HIGH_LOW - only high/
FREE

TimeFilter indicator allows to select visually bit masks (GoodHourOfDay, BadHoursOfDay, GoodDayOfWeek, BadDaysOfWeek), used in the Intraday Time Filter module of the Standard Library. The use of time filters allows to take into account the details of trade sessions. Parameters: GoodHourOfDay Number of the only hour of day (from 0 to 23) when trade signals will be enabled. If the value is -1, the signals will be enabled through the whole day. BadHoursOfDay The bit field. Each bit of this field c

Info tool helps to estimate the current risks of open positions and orders. It allows to analyze open positions or/and pending orders, also there are USD/Percentage modes. Expands the margin load and the share of profit participation for individual positions. Информационная панель помогает оценить текущие риски по открытым позициям и ордерам. Есть возможность отдельного анализа рисков по позициям/отложенным ордерам, а также в режимах USD/Percentage. Раскладывает маржинальную нагрузку и долю учас
This script notifies a user about different events by playing sounds, sending emails and text messages to a mobile device. The following events are supported: New deals (in/in out/out). Expiration of Pending orders. The terminal disconnected. The terminal or the script closed. Please set a notification type for each event separately. If you need notifications via Email, please make sure that the settings on the Email tab are correct. If you need to receive notifications on a mobile device, pleas

The script creates account summary report in a separate window. The report can be created for all deals and on deals for selected financial instruments.
It is possible to specify a time interval of calculation and save report to htm-file.
The script creates account summary report in a separate window. The report can be created for all deals and for deals of the selected financial instruments. It is possible to specify a time interval of calculation and save report to htm-file.
Input paramet

The Synchronized Charts script allows comparing bars of different symbols or different periods of the same symbol. Attach the script to a chart and move bars or change the scale, all opened charts will move synchronously with the current one. The bars on different charts aligned to the border according to their open time. Please be sure the relevant history datas have been downloaded before synchronize charts.
Some trading strategies are suitable for the quiet market with less volatility, while others are suitable for the volatile and violent market. Either way, traders should have a clear measure of how hot or cold the market is. This product is convenient for traders to compare the degree of cold heat of different trading varieties, or the trading heat of the same trading variety in different time periods. You can put it on different charts to get the intuition. It's easy to see which is more hot an
The script shows statistics of trades for the specified period. For example, if you want to know the details of trades of the ATC2010 Winner ( bobsley ): Login with his account using the investor (read-only) password (MetaTrader5); Open the chart of his trading symbol (EURUSD); Run this script on the chart; Specify 2010.10.1 in "date from", and the diagram will be shown.
Painting Deals on active chart. It allows analyzing trade history on an account to which you have an investor (read only) password. Type of the arrow displayed indicated the deal type: Right Arrow means In and In/Out deals Arrow Left Left means Out deals. Blue arrows are for Buy deals and Red arrows are for Sell deals. The indicator displays deals in the real time mode, it also displays their Stop Loss and Take Profit levels. Put the mouse over the arrows to see the details of deals including op

Script to Delete Pending Orders
Sometimes you placed many Pending Orders and then you want delete certain kind of these orders, this script can help you! Usage:
Download and drag and drop this script to the chart. Check "Allow AutoTrading" in "Common" tab and set input parameters in "Inputs" tab. Input Parameters: TypeOfPending: which type Order you would delete. mySymbol: which Symbol you would delete. The input format of the Symbol is such as "EURUSD" or "eurusd".

The script allows to easily watch the date and time of several cities selected by the user from more than 30 important cities all over the world. It also shows GMT, Server time and Local time. The cities on the screen are automatically sorted by the date and time. You can save your setting on the Inputs tab and use them in future. Notice: Daylight saving time is not considered.

A ideia do sistema é a identificação de padrões de reversão utilizando o cálculo de candles compostos. Os padrões de reversão são semelhantes aos padrões "Martelo" e o " Homem Enforcado " da análise candlestick Japonesa, porém ele usa candles compostos em vez de uma única barra e não precisa do pequeno corpo numa composição para confirmar a reversão.
Os parâmetros de entrada: Range - número máximo de barras, utilizada no cálculo de composição dos candles compostos . Minimum - tamanho mínimo d
FREE

A estratégia de negociação baseada em três médias móveis. Para determinar a tendência, ele usa três médias móveis exponencialmente: FastEMA, MediumEMA e SlowEMA.
Sinais de negociação:
Sinal para COMPRAR: FastEMA>MediumEMA>SlowEMA (tendência de alta). Sinal para VENDER: FastEMA<MediumEMA<SlowEMA (tendência de baixa). Os parâmetros de entrada:
Inp_Signal_ThreeEMA_FastPeriod = 8; Inp_Signal_ThreeEMA_MediumPeriod = 38; Inp_Signal_ThreeEMA_SlowPeriod = 48; Inp_Signal_ThreeEMA_StopLoss = 400; I
FREE

A estratégia baseia-se no cruzamento de preços com o indicador Moving Average, confirmado pelo indicador ADX. Os sinais de negociação: Comprar: fechamento de preço da última barra completada é maior do que a média móvel que esta aumentando com as últimas barras fechadas. Venda: fechamento de preço da última barra completada é menor do que a média móvel que esta diminuindo com as últimas barras fechadas. Para filtrar o sinal falso, ele verifica o poder da tendência (ADX>ADXmin) e a direção de t
FREE

A estratégia baseia-se no indicador técnico Alligator, descrita por Bill Williams em "Trading Chaos".
O sistema é baseado em três médias móveis (linhas dos Lábios, Dentes e Mandíbula) e osciladores calculados usando a diferença entre eles. Os sinais de negociação são gerados após o cruzamento das linhas do Alligator, dependendo datendência e determinado pela ordem destas linhas. No caso da tendência ascendente, a linha dos Lábios (com período mínimo) está mais alta, a próxima é a linha de de
FREE

Indicador de volatilidade de Chaikin que calcula o spread entre o preço máximo e mínimo. Ele julga o valor de volatilidade baseando-se na amplitude entre a máxima e a mínima. Ao contrário do indicador Average True Range , o Indicador de Chaikin não leva em conta os gaps. Segundo a interpretação de Chaikin, um crescimento do indicador de volume em um espaço relativamente curto de tempo significa que os preços se aproximam de seu mínimo (como quando os títulos são vendidos em pânico), enquanto que
FREE

O indicador colorline mostra a linha do preço da média móvel no gráfico. A linha tem cores diferentes (100 barras têm a mesma cor). As configurações de cores da linha muda a cada 5 ticks, há 3 esquemas de cores. Indicador para demonstrar o estilo DRAW_COLOR_LINE. Desenha uma linha nos preços de fechamento em peças coloridas de 20 barras. A espessura, estilo e cor das seções de linha são alterados aleatoriamente. O código do indicador é publicado na documentação MQL5 na seção Estilos de indicado
FREE

O indicador ColorCandlesDaily desenha candles com cores diferentes, dependendo do dia da semana.
FREE

The script SphereSample.mq5 illustrates control of graphic objects using the classes from the Standard Library (Base class of objects array CArrayObj , CChartObjectText ).
FREE

The script illustrates the usage of the OBJPROP_XOFFSET and OBJPROP_YOFFSET properties. It displays the specified fragment of the .BMP image.
FREE

The ColorBars Indicator paints bars with different colors depending on the volume changes. If the volume has increased, the color is green, overwise the color is red.
FREE
The script ObjChartSample.mql5 illustrates control of chart properties using the classes from the Standard Library .
FREE
Saiba como comprar um robô de negociação na AppStore do MetaTrader, a loja de aplicativos para a plataforma MetaTrader.
O Sistema de Pagamento MQL5.community permite transações através WebMoney, PayPay, ePayments e sistemas de pagamento populares. Nós recomendamos que você teste o robô de negociação antes de comprá-lo para uma melhor experiência como cliente.
Você está perdendo oportunidades de negociação:
- Aplicativos de negociação gratuitos
- 8 000+ sinais para cópia
- Notícias econômicas para análise dos mercados financeiros
Registro
Login
Você concorda com a política do site e com os termos de uso
Se você não tem uma conta, por favor registre-se