Conheça o Mercado MQL5 no YouTube, assista aos vídeos tutoriais
Como comprar um robô de negociação ou indicador?
Execute seu EA na
hospedagem virtual
hospedagem virtual
Teste indicadores/robôs de negociação antes de comprá-los
Quer ganhar dinheiro no Mercado?
Como apresentar um produto para o consumidor final?
Indicadores Técnicos para MetaTrader 5 - 15

This indicator will show a vertical representation of the volume distribution within a selected user range.
This is a free version of the full product. It is limited to use on a week old data or older. Find the full product at https://www.mql5.com/en/market/product/42234 .
Main features: This Indicator will create an image that will allow viewing the tick volume per price level in a graphical form. The indicator will work on any range size in any time-frame, limited only by your computer m
FREE

This is the demo version of "All Harmonics 26" indicator . "All Harmonics 26" searches for 26 types of harmonic patterns and outputs them in a convenient way. You can check out the documentation here . This demo version has the following limitations: The indicator searches only for one type of harmonic patterns out of 26:- Gartley. The indicator outputs new patterns with a lag of 10 bars.
FREE

The Relative Equilibrium index (REi) is a technical analysis indicator that shows the direction and strength of a trend and indicates the probability of its change. It shows the ratio of the average price increase to the average fall over a certain period of time. The value of the index allows you to assess whether buyers or sellers had a stronger influence on the price over a set period of time and to assume further developments. The indicator is characterized by simplicity of interpretation an
FREE

Contador de Candle Este produto faz a contagem dos candles e mostra o resultado conforme a configuração definida pelo usuário. Traders profissionais usam para enfatizar um candle específico.
Configuração Posição - Escolher se os números serão apresentados acima ou abaixo do candle Distância - A distância que o número terá do candle, referente a mínima ou máxima Tamanho da Fonte - Tamanho da fonte Cor - Cor da Fonte
FREE

O indicador Martinware Manual Trading Helper (Auxiliar de Negociação Manual) tem por objetivo ajudar as pessoas a iniciar suas vidas na especulação manual. Ele pode ser usado para exibir tanto algumas imagens genéricas no lado direito do gráfico, onde observações operacionais personalizadas podem ser exibidas, quanto apenas um retângulo em branco que oculta o gráfico durante o backtest. Além disso, pode reproduzir periodicamente uma lista de sons. Para mostrar um retângulo em branco, deixe o pr
FREE

Trap Play refers to a market situation where price initially makes a new high or low, luring traders into believing a strong trend is forming. However, the price quickly reverses and invalidates the breakout, trapping those traders who entered positions based on the initial move. This sudden reversal often results in a rapid exit of positions, leading to significant price movement in the opposite direction. Trap plays can occur in various financial markets and timeframes and are characterized
The indicator displays support and resistance levels based on fibonacci level in multi period Creates lines indicating the latest support and resistance levels.
These lines are updated whenever there is a change in support or resistance levels. Labels are removed if the corresponding conditions are not met.
the period is availble in setting and level fibonacci
FREE

O Indicador de Médias Móveis Exponenciais (Duplas ou Triplas) Envelopes é uma ferramenta de análise técnica projetada para ajudá-lo a identificar tendências e possíveis pontos de reversão no mercado financeiro. Este indicador oferece aos traders a flexibilidade de escolher entre dois tipos de médias móveis exponenciais: a Média Móvel Exponencial Dupla (DEMA) ou a Média Móvel Exponencial Tripla (TEMA).
Recursos Principais:
Duplas ou Triplas Exponenciais: Alterne entre DEMA e TEMA com base em
FREE
The "Cycle Extraction" indicator for MetaTrader 5 uses the Fast Fourier Transform (FFT) to discern cycles in financial time series. It facilitates the configuration of parameters such as the maximum number of bars, moving average settings, and specification of frequency thresholds, optimizing the analysis of repetitive market phenomena. Instructions Input Settings : Adjust variables such as Bar Count, Period, Method, and Applied to Price to customize the analysis to the user's needs. Data Visual
FREE

Value Chart indicator presents the Price evolution in a new form. This indicator, Price Momentum , was developed taking all the calculations presented in the book " Dynamic Trading Indicators " by Mark W. Helweg and David Stendahl (2002). The technique involves de-trended Prices from a user-defined Period of analysis and the addition of a Volatility index correction. The result is an Oscillator with 3 zones: Fair Price Value, Overbought/Oversold and Extremely Overbought/Oversold zones. Adding th
FREE

The "Moving Average Range Painter" is a robust MetaTrader 5 (MT5) indicator meticulously crafted to illustrate the fluctuating range between an exponential moving average (EMA) and a simple moving average (SMA) on any financial chart. This tool offers traders a comprehensive visual depiction of the price range within which an asset is oscillating. Here's a succinct interpretation of what this range signifies for technical analysis: Trend Dynamics : The range delineated by the EMA and SMA unveils
FREE

Indicador gratuito para detectar rapidamente quebras de linha de tendência e alta ou baixa de uma faixa de preço. Ele exibe linhas com base nas altas e baixas dos preços e também encontra e exibe linhas de tendência inclinadas. Assim que o preço ultrapassa a linha e o candle fecha, o indicador sinaliza isso com uma seta (você também pode ativar um alerta). Este indicador é fácil de usar e também gratuito. O número de velas para definir as linhas de tendência, bem como o máximo e o mínimo da fai
FREE

The market is unfair if only because 10% of participants manage 90% of funds. An ordinary trader has slim changes to stand against these "vultures". This problem can be solved. You just need to be among these 10%, learn to predict their intentions and move with them. Volume is the only preemptive factor that faultlessly works on any timeframe and symbol. First, the volume appears and is accumulated, and only then the price moves. The price moves from one volume to another. Areas of volume accumu

The Fisher Transform is a technical indicator created by John F. Ehlers that converts prices into a Gaussian normal distribution. The indicator highlights when prices have moved to an extreme, based on recent prices. This may help in spotting turning points in the price of an asset. It also helps show the trend and isolate the price waves within a trend. The Fisher Transform is a technical indicator that normalizes asset prices, thus making turning points in price clearer. Takeaways Turning poi
FREE
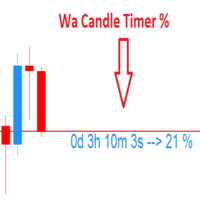
Wa Candle Timer Percentage MT5 is an indicator which shows the user how much time is remaining until the next candle will form. The percentage of the evolution of the current candle is also displayed. The user can set the percentage that the candle timer will change the color. These are the settings: 1- The percentage that the candle timer will change the color. 2- Color of Candle Timer when it's BELOW the percentage set by the user. 3- Color of Candle Timer when it's ABOVE the percentage set b
FREE

Indicador de pião real
Ele detecta o pião preciso no gráfico com corpo equilibrado e proporção de altura do pavio, que é o verdadeiro significado do pião, que o difere de Hammers e Doji ou Null Candlestick.
Este indicador traça um ícone de asas no número de piões encontrados no gráfico.
As configurações incluem
Número de compassos: Para ajustar a pesquisa no número de compassos
Cor do ícone: mude a cor do ícone
Código do ícone: altere o código de wingdings para o ícone
FREE

Cores geradas de acordo com o volume de negociações e direção do mercado.
As analise sao feitas seguindo a direção do preço e volume negociado se o valor negociado for superior a base de calculo o sistema muda a cor para verde, informando que a direção do preco e forte para compra, se o valor negociado for menor que a base de calculo o sistema muda para vermelho, indicando que o preço e forte para venda.
FREE

SDivergence Indicator calculates and shows regular divergences and hidden divergences for MACD and Stochastic(for now). The benefit of this indicator is multiple input variables. Using these inputs you can modify to get more adaptive RD and HD's to your strategy. Guide : 1- First put your desired oscillator (MACD or Stochastic or Both) on the chart. 2- Run SDivergence indicator and set corresponding sub-window index of previously put oscillator in SDivergence input window. -Note: the chart sub-w
FREE
This indicator is unstoppable when combined with our other indicator called Katana . After purchase, send us a message and you could get Katana for FREE as a BONUS!
PROMO FOR THE MT5 version: $55 for a very limited time! Next price is $105. The Trend Forecasting indicator is a very unique & easy tool that is able to make prediction about future price movement based on the signals generated by MACD. It helps you have an estimation on the areas that the price may develop in

Mostra o saldo de agressão (trades de compra - trades de venda) em um histograma. A agressao é calculado sobre todos os ticks de um candle e é a soma do volume de todos os trades à mercado de compra menos o volume de todos os trade à mercado de vendo. Caso o ativo nao tenha volume real é usado o volume de ticks no lugar.
Útil para determinar se um candle foi dominado pelos compradores ou vendedores .
Se faz necessario que o provedor de dados tenha lista de trades (times & sales) bem como o d
FREE

A very useful Price Action point is the previous day Closing VWAP. We call it Big Players Last Fight . This indicator will draw a line showing on your chart what was the last VWAP price of the previous trading session. Simple and effective. As an additional bonus, this indicator saves the VWAP value on the Public Terminal Variables, so you EA could read easily its value! Just for the "Prefix + Symbol name" on the variables list and you will see!
SETTINGS How many past days back do you want to
FREE

Bem-vindo ao HiperCube VIX
Este indicador fornece uma informação real de mercado de volume de sp500 / us500
Definição O HiperCube VIX, conhecido como Índice de Volatilidade CBOE, é uma medida amplamente reconhecida do medo ou do stress do mercado. Assinala o nível de incerteza e volatilidade no mercado bolsista, utilizando o índice S&P 500 como proxy para o mercado alargado. O Índice VIX é calculado com base nos preços dos contratos de opções no índice S&P 500.
Funcionalidades: Cores p
FREE
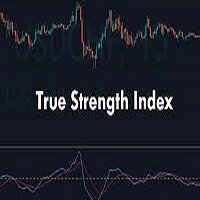
The true strength index is a technical indicator used in the analysis of financial markets that attempts to show both trend direction and overbought/oversold conditions. It was first published William Blau in 1991. The indicator uses moving averages of the underlying momentum of a financial instrument. The True Strength Index (TSI) is a momentum oscillator that ranges between limits of -100 and +100 and has a base value of 0.
FREE

An indicator for visualizing time ranges of key trading sessions: Asian, European, and American. The indicator features functionality for setting the start and end times of each trading session, as well as an adjustable timezone of the trading server. The main advantages of the indicator include the ability to operate with minimal CPU load and memory usage. Moreover, it offers the option to specify the number of displayed historical days, providing the user with flexible market dynamics analysis
FREE

Nadaraya-Watson Envelope Indicator convert to MT5 Nadaraya Watson Envelope Indicator is one of the monst popular indicator in TradingView. TradingView(Chrome, Edge) eats a huge of CPU, so I convert this to MT5 version.
As you can see the screenshot, it's good with Schaff trend RSI Indicator (or others) If you want to get Schaff trend RSI Indicator , Link: https://www.mql5.com/en/market/product/98011
Window Size - determines the window size for calculating smoothed values. A larger window

Ever wanted to use StochRSI on MetaTrader5 Terminal which you see and use on TradingView? Now you can use same StochRSI indicator in your MetaTrader5 and enjoy more time in Trading.. You can change StochRSI settings if you want to change and it will be ready to use for you... Now you will not go anywhere to use only indicator there... Open charts , load Indicator this Indicator and you are ready to do analysis in MetaTrader5 and Put Trades when you feel okay with your analysis.
FREE

Sentimento de Mercado é um indicador que usa os dados do nosso principal indicador: Market Strength Radar.: https://www.mql5.com/pt/market/product/114568?source=Site +Profile+Seller Ele imprime um gráfico de linhas que deve ser comparado com o gráfico de preço para entendermos o sentimento do mercado. As divergencias são pontos importantes de inflexão. As convergências mostram força da tendência atual.
FREE

Introduction Poppsir is a trend-range indicator for metatrader 5 (for now), which distinguishes sideways phases from trend phases.
With this tool it is possible to design a trend following-, meanreversion-, as well as a breakout strategy.
This indicator does not repaint!
The signal of the Poppsir indicator is quite easy to determine. As soon as the RSI and Popsir change their respective color to gray, a breakout takes place or in other words, the sideways phase has ended.
Interpret
FREE

Se você é (ou foi) um fã do indicador RSI, vai adorar o indicador Dynamic Momentum Index de Tushar Chande, que, em termos simples, é um RSI de comprimento variável dinâmico, tornando-o mais poderoso. O indicador DMI usa internamente um número variável de barras em seus cálculos, levando em consideração os níveis de volatilidade do mercado atual que você está analisando. Dessa forma, o indicador DMI usará mais barras conforme a volatilidade diminui e menos barras quando a volatilidade aumenta, pr
FREE

FRB Saldo de Agressão
- Indicador mostra o Saldo da Agressão do TIMEFRAMES escolhido pelo usuário através de um histograma numa nova janela. - Este indicador só pode ser usado se a corretora informa os dados sobre os Volumes. As corretoras do mercado forex não informam esses dados. - B3 (Bovespa) informa os dados e com isso é possível usar nas corretoras brasileiras.
Configurações Cor - Definir a cor que será mostrada no histograma. Usar Dados Históricos - Define se o indicador irá calc
FREE

Modificação multimoeda e multitimeframe do indicador Fractals. Exibe os dois últimos fractais — sua sequência (e qual está quebrada) ou a distância entre eles. Você pode especificar quaisquer moedas e prazos desejados nos parâmetros. Além disso, o painel pode enviar notificações sobre o rompimento de um fractal. Ao clicar em uma célula com ponto final, este símbolo e ponto final serão abertos. Este é o scanner MTF.
A chave para ocultar o painel do gráfico é “D” por padrão.
Parâmetros Cal

The indicator shows the current timeframe and symbol name. It is also possible to turn on the indication of time until the end of the current bar. In the settings, you can specify: - the location of the indicator in relation to the terminal window, top left, top right, bottom left and bottom right - a row of text display arrangements so that the inscriptions do not overlap each other - color - font - font size.
FREE
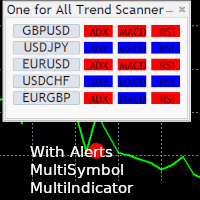
One for All Trend Scanner is a trend following multi-symbol indicator that can be used with any input: forex, stocks, commodities,... The panel shows three indicators and six symbols with the trend for every pair (symbol/indicator): up, down or no trend. The indicators are: Average Directional Movement Index (ADX) Moving Average Convergence Divergence (MACD) Relative Strength Index (RSI) You can choose which indicators will use for entry/exit and can adjust the parameters of each indicator sepa
FREE

Was: $49 Now: $34 Blahtech Better Volume provides an enhanced version of the vertical volume bars. Each bar is compared to the previous 20 bars. Depending on its volume, range and volume density it will be assigned a state and colour. Low Volume – Minimum volume High Churn – Significant volume with limited movement Climax Neutral – High volume with unclear direction
Climax Up – High volume with bullish direction Climax Dn – High volume with bearish direction Climax Churn – High vol

Moving Average 4 TimeFrames
Exiba 4 médias móveis de 4 timeframes diferentes no mesmo gráfico. Para não poluir o gráfico, o indicador vai plotar a média completa somente no tempo gráfico corrente de uma das 4 médias cadastradas, para os outros tempos gráficos de médias cadastradas o indicador exibe apenas uma parte da média para que você saiba onde ela está naquele tempo gráfico. Exemplo:
Exiba no gráfico de 5 minutos onde está passando a média móvel aritimética de 200 períodos dos 5 min
FREE

Apply to the 5 minute timeframe against the major USD forex pairs. AUDUSD EURUSD GBPUSD USDCAD USDCHF USDJPY Highlights the PropSense Book Levels Turn on/off for Sydney, Asia, London and New York Sessions Shows the Tokyo and London Fixes Turn on/off for Tokyo and London Configure how many historical fixes to show Shows the Sessions Turn on/off visible indication for sessions (supports 4 sessions) Visibly shows the sessions (out of the box configuration for Sydney, Tokyo, London and New York) Hig
FREE

Description : Rainbow MT5 is a technical indicator based on Moving Average with period 34 and very easy to use. When price crosses above MA and MA changes color to green, then this is a signal to buy. When price crosses below MA and MA changes color to red, then this is a signal to sell. The Expert advisor ( Rainbow EA MT5 ) based on Rainbow MT5 indicator is now available here .
MT4 version is available here .
FREE

This indicator is an automated version of the Fibonacci retracement (Fib) indicator. Deciding the best areas to use when drawing the fib can be tricky and this indicator was made with that in mind. When you drop it on the chart it will automatically choose the best points to draw the fib with, but in case you aren't satisfied with those regions, you can adjust it as you wish.
FREE

Having trouble marking where the various forex sessions start and end? Or perhaps your strategy requires you trade only in a specific session, then this is for you.
The session indicator shades the session you require in a certain color so that you can identify it easily. The sessions shown include: London session, New York session, Asian Session, Asian - London overlap and London - New York Overlap.
Difference source give varying time ranges for the various session, mostly differing by not
FREE

Momentum Reversal é uma ferramenta poderosa para detectar possíveis pontos de reversão e iniciar a correção, com base na análise da intensidade dos movimentos de preços e nas formações de barras.
_________________________________
Como usar os sinais indicadores:
O indicador forma um sinal após o aparecimento de uma nova barra de preços. Recomenda-se usar o sinal gerado após o preço romper o ponto crítico na direção especificada. O indicador não redesenha seus sinais.
___________________
FREE

High of the Day and Low of the day Time and Price Fractal Studies is an indicator that will help you identify certain patterns that tend to repeat themseleves at certail times of the day or at certain prices.
It is used to study Daily Highs ad Lows in relation to time and price.
You will get to answer certail questions like:
At what time of day does this market usually turn around. At what price does the market turn. Is it at round numbers etc
FREE

Candle com coloração de Volume Price Analysis (VPA) segundo as definições da Anna Coulling, é possível configurar períodos de climax e rising, fator de extreme e fator de rising.
Pode-se usar volume real ou volume de ticks. O VPA considera a variação de preço por volume do período, indicando se um movimento está recebendo ignição, está em seu climax ou se já não existe mais interesse.
FREE

Santa Donchian Indicator is an efficient way to detect support, resistence and break outs in any market.
The Donchian channel measures the high and the low of a previously defined range. Typically, a trader would look for a well-defined range and then wait for the price to break out to either one side for a trade entry trigger. Advantages Never repaints, never backpaints, never recalculates. Works in all symbols and all timeframes. Perfect trend filter for any strategy or expert advisor. Fu
FREE

The technical indicator Trend Strength Analyzer measures the deviation of the price of an instrument from average values over a specific period of time. A comparative analysis of the relative strength of bulls and bears underlies the indicator. If bulls prevail, an upward trend. If bears are stronger - a downward trend.
Settings:
Strike Energy (2 solid lines) = 14.
Influence Power (2 dotted lines) = 50. The TSA oscillator is effective in an active market. The most commonly used indica
FREE

This tool is useful for indicating resistance and support levels It bases on zone in setting to identify top/bottom of candles and and draw rectangle according to those resistance/support level Beside user can edit the zone via dialog on specific timeframe and that value will be saved and loaded automatically. User can determine what strong resistance and support and make the order reasonably.
FREE

Please check the " What's new " tab regularly for a complete and up-to-date list of all improvements + parameters. FREE indicator for my trading utility Take a Break . This indicator allows you to manage multiple other EAs with just one Take a Break EA instance. Simply specify the corresponding Chart Group in the indicator(s) and Take a Break EA settings and you are good to go.
Setup examples (Indicator + EA)
As a prerequisite, add the URL https://trading.custom-solutions.it to the list of
FREE

Description :
Combination MT5 is a professional indicator based on the Stochastic Oscillator and Average True Range (ATR) technical indicators, thus, you can use it with any currency pair and any timeframe.Trade signals from Combination MT5 are drawn on the main chart in the form of arrows. When a blue arrow appears, then this is a signal to buy, when the red one appears then this is a signal to sell. You can set the alerts on/off. The Stochastic Oscillator and Average True Range (ATR) technic
FREE

O indicador de volume da Martinware desenha uma média móvel colorida sobre as barras de volume. A coloração usa três cores e pode ser feita de diferentes maneiras, escolhidas pelo usuário e aplicada tanto à média quanto às barras de volume.
São possíveis três tipos de coloração: Nenhuma: nenhuma coloração é feita Aumentando ou diminuindo: muda a cor dependendo do valor atual ser maior ou menor que o valor anterior Volume relativo à média: as cores variam se o volume atual for maior ou menor
FREE

QuantumAlert CCI Navigator is a free indicator available for MT4/MT5 platforms, its work is to provide "alerts" when the market is inside "overbought and oversold" regions in the form of "buy or sell" signals. This indicator comes with many customization options mentioned in the parameter section below, user can customise these parameters as needful. Join our MQL5 group , where we share important news and updates. You are also welcome to join our private channel as well, contact me for the pri
FREE

Indicador desenvolvido com o intuito de notificar ao usuário quando o RSI entrar e sair das regiões de sobrecompra e sobrevenda, as informações são mostradas em forma de alertas sonoros e textos. A qualquer momento as notificações podem ser desativadas. O período do indicador pode ser alterado pelo usuário, e é possível inserir o indicador RSI no gráfico através dos alertas.
FREE

Nós da Minions Labs adoramos estudar, desafiar e descobrir novos comportamentos do Preço nos mercados atuais. Nós NÃO chamaríamos isso de Price Action porque hoje essa palavra é totalmente usada com total exagero e significa, graças aos Falsos Profetas por aí, absolutamente NADA.
A hipótese de estudo que propomos é a seguinte: Alguns Ativos, em determinados Tempos Gráficos, apresentam um comportamento de Continuidade de Preço quando as velas fecham SEM um pavio ...
Portanto, o objetivo des
FREE

O indicador imprime a linha da média longa quando as médias media e curta estão confinadas dentro dos limites de 1 ATR (average tru range) da média longa. Após períodos de congestão os preços se movimentam fortemente em uma direção. Este indicador não fornece pontos de entrada, apenas mostra que as médias estão bastante próximas. Parâmetros: Periodmalongo: Período da média longa. Periodmamedio: Período da segunda média. Periodmamedio2:Período da terceira média. Periodmacurto: Período da média cu
FREE

This indicator draws the high intraday price and the low intraday price of the first n minutes of the day. The chart shows the days with vertical lines and two horizontal lines to indicate the max and the min close price of the n first minutes of the day. The max/min lines start and end with the day calculated. With this indicator you can see how starts the day compared with the previous days. It is valid for any market inasmuch as the start time is calculated with the data received.
Paramete
FREE

I present the well-known Fractal indicator.
Levels have been added to this indicator.
At the extreme points, you can see the continuation of the price line, which changes when the values of the Fractal indicator change.
The indicator is easy to use. The basic Fractal settings have been saved.
FractalLevels Parameters:
LeftBars - the number of bars on the left
RightBars - the number of bars on the right
FREE

This indicator automatically draws horizontal lines at 00s, 20s, 50s and 80s levels. If you trade ICT concepts and are an ICT Student, then you know that these levels are used as institutional support/resistance levels and/or fibonacci retracement anchor points. Features
Draws horizontal lines at 00, 20, 50 and 80 levels above and below current market price . Choose the amount of levels to show on chart Customizable line colors Recommended for forex currency pairs. Saves time looking for the
FREE

Se você gosta deste projeto, deixe uma revisão de 5 estrelas. Seguir em instagram: borelatech Negociar grandes volumes exige que nós olhemos para vários instrumentos /
gráficos para
encontrar novas oportunidades, este indicador irá ajudá-lo traçando específicas
níveis pelo múltiplo de um número ou seu sufixo e atualizá-los automaticamente
como o preço muda, uma tarefa que seria tedioso. Por exemplo, no GBPUSD, você pode ter 4 instâncias do indicador no
gráfico para plotar: Cada intervalo d
FREE

Positions panel
This is a panel for counting current icon holdings. Convenient traders at any time to view the position and profit and loss situation. Perfect for traders who like to hold multiple orders at the same time. Main functions: Position statistics Total profit Average price calculation TP price calculation ST price calculation Positions valume
FREE

The indicator automatically plots significant trend lines and displays buy and sell signals. Signals are generated for reflection and breakdown from support and resistance lines. When a signal appears, the indicator displays it as an arrow of the specified color and also sends the message type specified in the input parameters. In the indicator settings, you can set the signal type, the maximum distance to the trend line, the type of notifications, as well as the settings for lines and ar
FREE

The TradeQL Indicator is a customizable tool that highlights specific trading patterns on candlestick charts. Users can define patterns through TradeQL queries, which the indicator then applies to the chart, visually representing matches and captured groups. Ideal for identifying complex trade setups in real-time.
TradeQL queries are specified using the TradeQL Language. See https://github.com/abdielou/tradeql for more details. This language is expressed as a regular expression. The language a
FREE

This indicator is based on Volumes standard indicator, calculates the average of Volumes based on the last N bars set by users, and if the value of the volume is bigger then a set % respect the average a different color will be used. The indicator is shown in a separate indicator window. This version has now a limitation in setting the % about the threshold.
If you are interested to set threshold consider to buy the PRO version ( https://www.mql5.com/en/market/product/35925 ) If you want to use
FREE

This is addition of Effective SV squeeze momentum that add bolliger band and Keltner channel to chart window. Squeeze momentum introduced by “John Carter”, the squeeze indicator for MT5 represents a volatility-based tool. Regardless, we can also consider the squeeze indicator as a momentum indicator, as many traders use it to identify the direction and strength of price moves. In fact, the Tradingview squeeze indicator shows when a financial instrument is willing to change from a trending ma
FREE

Фрактальная дивергенция - это скрытая дивергенция, построенная на фракталах Билла Вильямса. Бычья фрактальная дивергенция представляет собой комбинацию из двух нижних фракталов, последний из которых расположен ниже предыдущего, и при этом две свечи справа от минимума последнего фрактала имеют минимумы выше уровня предыдущего фрактала (см. скриншот 1). Медвежья фрактальная дивергенция - это комбинация из двух соседних верхних фракталов, последний из которых расположен выше, чем предыдущий верхн
FREE

The market price usually falls between the borders of the channel .
If the price is out of range , it is a trading signal or trading opportunity .
Basically , Fit Channel can be used to help determine overbought and oversold conditions in the market. When the market price is close to the upper limit, the market is considered overbought (sell zone). Conversely, when the market price is close to the bottom range, the market is considered oversold (buy zone).
However, the research can
King Binary Profit System
1 minute candle
3-4 minute expire
Alright. This indicator works on MT5 and is very easy to use. When you receive a signal from it, you wait for that candle with the signal to close and you enter your trade at the beginning of the next new candle. A red arrow means sell and a green arrow means buy. All arrows comes with a long dotted like for easy identification of trade signal. Are you okay with that?

The indicator is designed to detect range market or consolidation areas on the chart. It does this by using the market volatility and price momentum. The indicator signals the start and stop of the range with icons on the chart and various type of alerts options provided in the input settings. Usage: The indicator can be used to check the state of the market i.e. trending or ranging to make appropriate decision and use strategies designed for specific market state. Please see the attached video

"Five Minute Drive" indicator that is designed to be used in the 5 minute timeframe only. One of its most important advantages is that it shows the general trend in the upper time frames when looking at the 5-minute timeframe. Therefore, when opening positions in the 5 minute timeframe, when it is in line with the trends in the upper timeframes, you are less likely to be upside down. If you can interpret the curvilinear and linear lines drawn by this indicator on the graphic screen with your geo
FREE

Sinais de compra e venda baseados na estratégia do Setup da Onda, popularizada no Brasil pelo Palex, para entradas em correções pós-reversão.
Como o indicador funciona? O indicador ativa o sinal de compra ou venda quando suas respectivas condições são atendidas. Para uma tendência de alta, precisamos de uma reversão para alta na MME9 seguida por preços acima da MM21 ascendente realizando uma correção e toque nela. Para uma tendência de baixa, precisamos de uma reversão para baixa na MME9 se

KT Stochastic Alerts is a personal implementation of the Stochastic oscillator that provide signals and alerts based on six custom events: Bullish Crossover: When Stochastic main line cross above the signal line. Bearish Crossover: When Stochastic main line cross below the signal line. When Stochastic enter in an overbought zone. When Stochastic exit from an overbought zone. When Stochastic enter in an oversold zone. When Stochastic exit from an oversold zone.
Features
A perfect choice for

This indicator provides common shapes as drawing object options. The shapes are rotatable, resizable, draggable, and will keep their proportions (according to their handle trendline) across different chart scales. Multiple drawings are supported.
Shapes: Square Rhombus
Triangle (quadrilateral & isosceles) Circle (grid, overlapped grid, flexi grid, rotatable grid, concentric circles) Features: rays (all object edges will be rays) show/hide each individual drawing type, or all delete last drawn
FREE

This is MT5 version, MT4 on this link: Alert Line Pro MT4 Alert line pro allows to make alert when price cross these objects: Horizontal lines Trendline Price Zone (Rectangle) Alert when close current bar (have new bar) When the price crosses the alert lines, the software will sound an alarm and send a notification to the MetaTrader 5 mobile application. You need to settings your MetaQuotes ID of MT5 apps to MetaTrader5 software to get notification to the mobile phone. Sound files must be pl
O Mercado MetaTrader é um site simples e prático, onde os desenvolvedores podem vender seus aplicativos de negociação.
Nós iremos ajudá-lo a postar e explicar como descrever o seu produto para o mercado. Todos os aplicativos no Mercado são protegidos por criptografia e somente podem ser executados no computador de um comprador. Cópia ilegal é impossível.
Você está perdendo oportunidades de negociação:
- Aplicativos de negociação gratuitos
- 8 000+ sinais para cópia
- Notícias econômicas para análise dos mercados financeiros
Registro
Login
Se você não tem uma conta, por favor registre-se
Para login e uso do site MQL5.com, você deve ativar o uso de cookies.
Ative esta opção no seu navegador, caso contrário você não poderá fazer login.