Conheça o Mercado MQL5 no YouTube, assista aos vídeos tutoriais
Como comprar um robô de negociação ou indicador?
Execute seu EA na
hospedagem virtual
hospedagem virtual
Teste indicadores/robôs de negociação antes de comprá-los
Quer ganhar dinheiro no Mercado?
Como apresentar um produto para o consumidor final?
Novos Indicadores Técnicos para MetaTrader 5 - 6

This variant of the ZigZag indicator is recalculated at each tick only at the bars that were not calculated yet and, therefore, it does not overload CPU at all which is different from the standard indicator. Besides, in this indicator drawing of a line is executed exactly in ZIGZAG style and, therefore, the indicator correctly and simultaneously displays two of its extreme points (High and Low) at the same bar!
Depth is a minimum number of bars without the second ma
FREE
The indicator displays support and resistance levels based on fibonacci level in multi period Creates lines indicating the latest support and resistance levels.
These lines are updated whenever there is a change in support or resistance levels. Labels are removed if the corresponding conditions are not met.
the period is availble in setting and level fibonacci
FREE

Pivot Points are used by Forex traders to find support and resistance levels based on the previous day's price action. There are various ways to calculate pivot points, including averaging the open, high, low, and close of the previous day's chart price.
Forex Traders use a combination of pivot points with moving averages to find trading opportunities in the currency markets.
Pivot points are very useful tools that use the previous bars' highs, lows and closings to project support and re
FREE

Trend reversal identification: The K-line countdown indicator helps traders capture trend reversal signals by identifying excessive buying and selling behavior in the market. This indicator is particularly effective when the market is in extreme states. Risk management: This indicator can help traders identify potential risks in the market before the trend reverses and adjust positions in time to avoid losses. For example, you might consider reducing your long position when a bullish countdown c

Price update indicator — can issue any type of alert when the price reaches certain levels set by a trader. There are three types of price levels: the first one is used when the price rises above certain level (displayed with the green line on the chart), the second one is used when the price falls below certain level (displayed with the red line on the chart), and the third one is used when the price reaches the certain level exactly (displayed with the yellow line). Three alert types include

Avalie a viabilidade operacional em cada período e em qualquer instrumento, de acordo com seu respectivo spread e volatilidade percentual, que são essenciais para o gerenciamento correto do risco em suas negociações.
Este indicador é essencial tanto para Day Traders quanto para Swing Traders, pois além de avaliar a viabilidade operacional em cada período, também é possível identificar a parada mínima justa para cada período e instrumento.
Exemplo no Swing Trade: seu corretor cobra um spread

Essa ferramenta poderosa identifica automaticamente as linhas de tendência, ajudando você a simplificar sua estratégia de negociação e tomar decisões mais informadas. mt4 versão
Recursos -chave Detecção automática de linha de tendência : o indicador "Basic TrendLine" digitaliza o mercado em busca de linhas de tendência em potencial e as exibe instantaneamente no seu gráfico.Isso economiza tempo valioso e garante que você nunca perca uma tendência importante. Painel amigável : Nosso indicad

Introducing our exciting new Price Retest indicator! Get instant alerts when the price retests, giving you a powerful edge in your trading strategy. Remember to do your own analysis before making any moves in the market. MT4 Version - https://www.mql5.com/en/market/product/118031 Here’s a detailed explanation of how the Price Retest indicator works, its components, and how you can incorporate it into your trading strategy: The Price Retest indicator is designed to notify traders when the price
FREE
Engulfing Candle Signal Alert: Elevate Your Trading Strategy Unlock the full potential of your trading with the Engulfing Candle Signal Alert, the ultimate tool for identifying market reversals and enhancing your trading precision. Designed specifically for traders who value accuracy and timely alerts, this powerful indicator detects engulfing candle patterns, a key signal in technical analysis that often indicates a potential shift in market direction. What is an Engulfing Candle? An engu
FREE
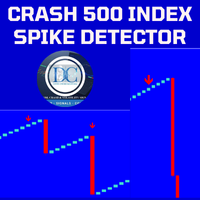
Spike Detector for Boom and Crash Indices
The Spike Detector is specifically designed to cater to the unique needs of traders in the Boom and Crash indices markets. Optimized for M1 (1-minute) and M5 (5-minute) timeframes, this tool ensures you receive timely and actionable insights. Below, you'll find a comprehensive guide on its key features, advantages, installation process, and how to use it effectively.
Key Features and Advantages
1. Non-Repainting: The Spike Detector guarantees accu

Otimize suas estratégias de trading com o indicador RAR (Relative Adaptive RSI)! Este avançado indicador de análise técnica combina o poder do Índice de Força Relativa (RSI) com técnicas adaptativas, fornecendo sinais mais precisos e confiáveis do que um oscilador comum. O que é o Indicador RAR? O RAR é um indicador projetado para MetaTrader 5 que utiliza Médias Móveis Exponenciais (EMA) e Médias Móveis Adaptativas (AMA) para suavizar o RSI e ajustá-lo dinamicamente às condições do mercado. Essa

Bienvenido al futuro del trading con KMeans Price Zones Detector, un innovador indicador de MetaTrader que aprovecha el poder del aprendizaje automático para identificar zonas clave de precios. Esta herramienta utiliza el algoritmo de agrupamiento KMeans para detectar dinámicamente los centroides en los datos de precios, destacando áreas donde es más probable que los precios encuentren soporte, resistencia o consolidación. Algoritmo innovador KMeans KMeans Price Zones Detector se destaca por su
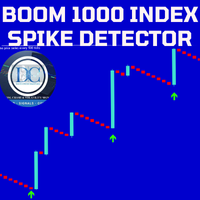
Our Spike Detector is specifically engineered to cater to the unique needs of traders in the Boom and Crash indices markets. This tool is optimized for M1 (1-minute) and M5 (5-minute) timeframes, ensuring you receive timely and actionable insights.
Key Features: 1. **Non-Repainting**: Our detector guarantees accuracy with non-repainting signals, ensuring your data remains consistent and reliable. 2. **Push Notifications**: Stay updated with real-time push notifications, so you never miss a cr
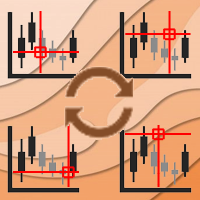
Async Charts is an indicator to synchronize charts and display a customized crosshair (cursor) on all selected charts. This is a useful utility for traders using multiple timeframes of analyzing multiple symbols for trade entry or exit.
Main Features : Real time Crosshair Synchronization on All Selected Charts
Supports Multiple Timeframes and Multiple Symbols at the same time
Auto Scroll Option
Graphical Adjustment of Color, Font, Size, ...
Locking All or Locking Specific Charts
More and
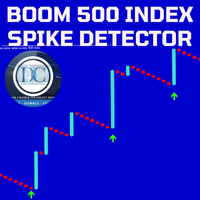
Our Spike Detector is specifically engineered to cater to the unique needs of traders in the Boom and Crash indices markets. This tool is optimized for M1 (1-minute) and M5 (5-minute) timeframes, ensuring you receive timely and actionable insights.
Key Features:
1. Non-Repainting**: Our detector guarantees accuracy with non-repainting signals, ensuring your data remains consistent and reliable. 2. Push Notifications**: Stay updated with real-time push notifications, so you never miss a cr

Probability emerges to record higher prices when RVi breaks out oscillator historical resistance level. It's strongly encouraged to confirm price breakout with oscillator breakout since they have comparable effects to price breaking support and resistance levels; surely, short trades will have the same perception. As advantage, a lot of times oscillator breakout precedes price breakout as early alert to upcoming event as illustrated by last screenshot. Furthermore, divergence is confirmed in
FREE
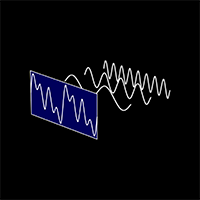
The "Cycle Extraction" indicator for MetaTrader 5 uses the Fast Fourier Transform (FFT) to discern cycles in financial time series. It facilitates the configuration of parameters such as the maximum number of bars, moving average settings, and specification of frequency thresholds, optimizing the analysis of repetitive market phenomena. Instructions Input Settings : Adjust variables such as Bar Count, Period, Method, and Applied to Price to customize the analysis to the user's needs. Data Visual
FREE

Our Spike Detector is specifically engineered to cater to the unique needs of traders in the Boom and Crash indices markets. This tool is optimized for M1 (1-minute) and M5 (5-minute) timeframes, ensuring you receive timely and actionable insights.
Key Features:
1. **Non-Repainting**: Our detector guarantees accuracy with non-repainting signals, ensuring your data remains consistent and reliable. 2. **Push Notifications**: Stay updated with real-time push notifications, so you never miss a
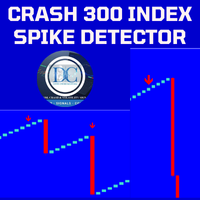
Spike Detector for Boom and Crash Indices
The Spike Detector is specifically designed to cater to the unique needs of traders in the Boom and Crash indices markets. Optimized for M1 (1-minute) and M5 (5-minute) timeframes, this tool ensures you receive timely and actionable insights. Below, you'll find a comprehensive guide on its key features, advantages, installation process, and how to use it effectively.
Key Features and Advantages
1. Non-Repainting: The Spike Detector guarantees accu

Este indicador pode ser usado para ajudar a aprender o 'sistema de contagem de barras' de Al Brooks. Ele encontra e marca as barras 'H', 'L', Micro Gap '=', Externa 'E' e Interna '+'. Você pode escolher plotar "H" e "L" na barra de sinal ou na barra de entrada. (não conta barras/pernas... você terá que fazer sua própria contagem para L1, L2... H1, H2, etc.) A barra interna só é marcada quando for selecionado plotar os rótulos na barra de entrada.
FREE

Probability emerges to record higher prices when RVi breaks out oscillator historical resistance level. It's strongly encouraged to confirm price breakout with oscillator breakout since they have comparable effects to price breaking support and resistance levels; surely, short trades will have the same perception. As advantage, a lot of times oscillator breakout precedes price breakout as early alert to upcoming event as illustrated by last screenshot. Furthermore, divergence is confirmed in
FREE

Sync Cursor MT5 | MT4 Sync Cursor MT4 https://www.mql5.com/en/market/product/118067 MT5 Tool will It make the Horizontal Line + Vertical Line in the Screen That it is always present on the screen and that it moves along with the candle (with the price). I am sure that something so simple will be a Treasure in the hands of many people.
Some of my personal trades are posted voluntary and free of charge in this Public channel https://t.me/FXScalpingPro
Contact: https://t.me/TuanNguyenTrader
FREE

Introducing the Raymond Cloudy Day indicator, a groundbreaking tool conceived by Raymond and brought to life on the MT5 platform by my coding expertise. This state-of-the-art indicator revolutionizes trading strategies by combining the robustness of an innovative calculation method that goes beyond traditional Pivot Points, with the precision of advanced algorithms. Source Code for EA: View Key Features: Innovative Calculation Method : At the heart of the Raymond Cloudy Day indicator
FREE

Индикатор тиковых объемов представляет собой инструмент технического анализа, используемый для оценки активности трейдеров на рынке. Этот индикатор отображает количество тиков (изменений цен) за определенный временной период и показывает преобладание тиков, направленных на покупку или продажу.
Основные характеристики и функции индикатора тиковых объемов: Гистограмма объемов:
Белый цвет: Означает преобладание тиков, направленных на покупку. Когда количество покупок превышает количество прода
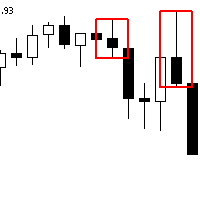
The Advanced Order Block Indicator for MetaTrader 5 is designed to enhance technical analysis by identifying significant order blocks that sweep liquidity and create Fair Value Gaps (FVG) when pushing away. This indicator is ideal for traders who focus on institutional trading concepts and wish to incorporate advanced order flow and price action strategies into their trading routine. Overview Order Block Identification : An order block represents a price area where a substantial number of orders
FREE

Description of the Indicator The indicator "BullsBearsPulse" is designed for MetaTrader 5 and provides a visual representation of the Bulls Power and Bears Power indicators. These indicators are useful tools for technical analysis, particularly for the EUR/USD currency pair, to help traders identify potential trading opportunities. Functionality Bulls Power : This indicator measures the strength of the bulls (buyers) in the market. It calculates the difference between the highest price and a 20
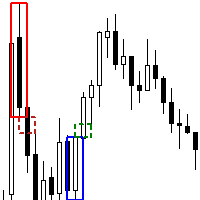
The Order Block FVG Box indicator for MetaTrader 5 is a powerful tool designed for discerning traders looking to identify and capitalize on high-probability trading opportunities. This indicator excels at pinpointing valid Order Blocks that are immediately followed by Fair Value Gaps (FVG), enhancing your trading strategy with precise visual cues. Key Features: Order Block Identification : Detects valid Order Blocks, which are significant areas where institutional buying or selling has occurred,
FREE

Ultimate Pivot Levels indicator for MetaTrader 5 Ultimate_Pivot_Levels is versatile tool designed to enhance your trading experience by accurately plotting pivot levels on your charts. It allows entering your desired values manually or using well known pivot calculation methods to create pivot levels. It draws the levels in the background and allows you to customize levels, size and colors of areas, and it keeps your adjustments while extending the levels to every new bar. Whether you are a novi
FREE

O Multi Asset Monitor Panel é uma ferramenta revolucionária para traders que precisam monitorar vários mercados simultaneamente. Este painel inovador permite que você acompanhe qualquer símbolo e qualquer timeframe de que precisar, tudo em uma única interface organizada. Com até três listas de símbolos e templates personalizáveis do MT5, você pode adaptar sua configuração de monitoramento para se ajustar à sua estratégia de negociação específica. O que diferencia o Multi Asset Monitor Panel é su

The purpose of the remaining time indicator on the K-line is to assist traders in gaining a deeper understanding of market dynamics and making more precise trading decisions, particularly in the realm of forex and binary short-term trading. The significance of this indicator and its application to various trading strategies will be thoroughly examined below: Enhancement of Trading Timing Accuracy - Precision: By displaying the remaining time of the current K-line cycle, traders can achieve great
FREE
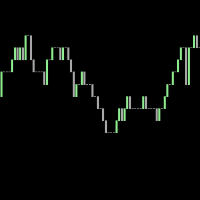
This is a tick indicator which compares the current bid price with the previous bid directly before it, and draws candles based on a comparison of the current ticks. It does not use historical ticks. Everything happens in real time, data moves from right to left, and the newest data arrives at the right. A trend line can be added which points in the direction of the price shifts.
FREE

Product Description: Adaptive Y-Axis Scaling is a powerful MT5 indicator designed to enhance your trading experience by providing precise control over the Y-axis (price) scaling of your charts. This innovative tool allows you to customize the price scaling by specifying the number of pips from the visible chart's highs and lows. The calculated price range from this input is then used to set the maximum and minimum prices for the open chart, ensuring an optimized and comprehensive view of market
FREE

The Engulf Seeker indicator is a powerful tool designed to detect engulfing candlestick patterns with precision and reliability. Built on advanced logic and customizable parameters, it offers traders valuable insights into market trends and potential reversal points.
Key Features and Benefits: Utilizes revised logic to analyze previous candles and identify strong bullish and bearish engulfing patterns. Convenient arrow-based alert system notifies traders of pattern occurrences on specific symb

O LIVRO VISUAL é uma ferramenta que auxilia na identificação de escoras e renovação de ordens, para quem opera Tape Reading ou fluxo no gráfico é uma excelente ferramenta. Porem ele funciona somente em Mercados Centralizados ou com profundidade nível 2. É de fundamental importância você saber que ele não funciona em Mercado de FOREX. Porem pode ser utilizado no Mercado da B3.

This spread indicator displays the actual spread of each candle. It highlights the maximum spread and the minimum spread of the chosen symbol. This indicator is very helpful to see in real time the spread evolution helping to avoid taking a trade when the spread is too high.
Inputs:
Print value in Points: if true displays the spread as a whole number
D isplay minimum and maximum spread of the past N days: select the number of days to consider the maximum and minimum spread
Automatically
FREE
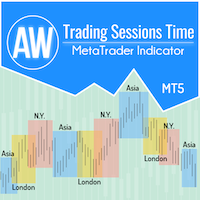
Para comodidade dos traders na obtenção de dados sobre o desempenho dos mercados e na melhor formulação de estratégias de negociação, desenvolvemos um indicador de sessão de negociação. O horário de funcionamento de várias bolsas afeta as negociações, pois afeta a atividade do mercado e os volumes de negociação. Estes factores determinam a volatilidade e as oportunidades de negociação de diferentes instrumentos. O indicador AW Trading Sessions Time exibe os horários de negociação dos mercados a
FREE

Fractals Dynamic Fractals Dynamic – é um indicador fractal livre modificado de Bill Williams, no qual você pode definir manualmente o número de barras à esquerda e à direita, construindo assim padrões exclusivos no gráfico. Agora, todas as estratégias de negociação baseadas ou baseadas no indicador Fractals Dynamic terão um sinal adicional.
Além disso, os fractais podem atuar como níveis de suporte e resistência. E em algumas estratégias de negociação para mostrar os níveis de liquidez. Pa
FREE

Course Crystal é um indicador que ajuda os traders a determinar a direção da tendência no mercado. Ele usa um algoritmo exclusivo para analisar os movimentos de preços e exibe os resultados em um gráfico como áreas coloridas. Azul indica uma oportunidade de compra, enquanto vermelho indica uma oportunidade de venda. Instruções de uso - https://www.mql5.com/en/blogs/post/757800 Sistema de negociação manual:
Determinação de tendência: O indicador Course Crystal analisa dados de preços atuais e
FREE
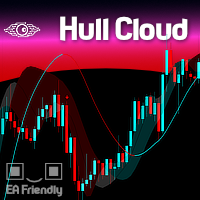
A Média Móvel de Hull é conhecida por sua capacidade de reduzir o atraso e fornecer uma representação mais clara e precisa das tendências do mercado. Ao suavizar os dados de preço de maneira mais eficaz do que as médias móveis tradicionais, ajuda os traders a identificar direções e reversões de tendência com maior precisão. O indicador Hull Cloud eleva isso usando quatro Médias Móveis de Hull que trabalham juntas como uma orquestra. Esta combinação cria um sistema dinâmico que destaca tendências

This indicator is the converted Metatrader 5 version of the TradingView indicator "ATR Based Trendlines - JD" by Duyck. This indicator works by automatically and continuously drawing trendlines not based exclusively on price, but also based on the volatility perceived by the ATR. So, the angle of the trendlines is determined by (a percentage of) the ATR. The angle of the trendlines follows the change in price, dictated by the ATR at the moment where the pivot point is detected. The ATR percentag
FREE
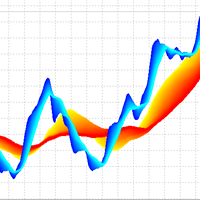
3D Trend Indicator is a non-repaint indicator using multiple moving averages with a 3D surface view. By using this indicator, you can remove uncertainties that can happen using a single and fixed moving average period. You can use a cloud area using a range of moving average periods. Also a wide range of visual settings are added to this indicator to have a better view from the cloud area. Alert and notification system added to the indicator to inform the trader about the action of candles on t

This indicator displays the remaining time of the current candle, providing a visual representation of the time left until the candle closes and a new one begins, helping traders to make more informed decisions and stay on top of market fluctuations with precise timing, enhancing their overall trading experience and strategy execution, and allowing them to optimize their trades and maximize their profits.
FREE

Introducing our state-of-the-art Wave Indicator, meticulously designed for the discerning traders of the MQL5 community! At the core of this innovative tool lies an unmatched sensitivity to capture even the slightest market movements. Our Wave Indicator serves as the foundational element for constructing comprehensive trading strategies, providing you with an unwavering edge in the dynamic world of finance. Whether you're aiming to refine short-term tactics or develop long-term systems, this ind
Apresentamos o Indicador de novo grafico - uma ferramenta poderosa para traders que buscam uma análise de preço suave e clara. Este indicador inovador calcula a média simples dos preços, oferecendo uma visão precisa e ajustada dos movimentos do mercado. Como Funciona : O Indicador de Média de Preços Simples (SMA) utiliza uma fórmula simples e eficaz: Ele soma o valor do último preço com o preço anterior. Em seguida, divide essa soma por 2 para obter a média. Fórmula : SMA = U ˊ ltimo Pre c ¸ o +

Os candles do tipo Heikin Ashi são uma ferramenta poderosa para os traders, oferecendo uma visualização clara e suave das tendências do mercado. Diferente dos candles tradicionais, eles filtram o ruído do mercado, proporcionando uma visão mais limpa da direção e força do mercado, ajudando os traders a tomar decisões mais informadas. O indicador Hull Heikin Ashi Smoothed da Minions Labs leva isso um passo além, integrando a Hull Moving Average para maior suavização e precisão. Este indicador não

Introduction
The "Smart Money Concept" transcends the realm of mere technical trading strategies to embody a comprehensive philosophy on the dynamics of market operations. It posits that key market participants engage in price manipulation, thereby complicating the trading landscape for smaller, retail traders.
Under this doctrine, retail traders are advised to tailor their strategies in alignment with the maneuvers of "Smart Money" - essentially, the capital operated by market makers
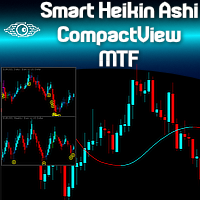
Você já é fã da ferramenta de análise de gráficos Minions Labs Smart Heikin Ashi ? Ou talvez esteja procurando um gráfico Heikin Ashi versátil que funcione em múltiplos períodos de tempo? Quer ver o panorama geral antes de se aprofundar nos detalhes para tomar decisões mais inteligentes de ENTRADA? Deseja construir seu próprio Painel de Ativos dentro de apenas um ÚNICO gráfico, sem lidar com a confusão das múltiplas janelas do MT5? Bem-vindo ao indicador Minions Labs Smart Heikin Ashi CompactVi

This is actually just a combination of 3 classic TTM_Squeeze indicators, nothing special. As I know exactly this is implemented in original TTM_Squeeze PRO indicator. It shows strong, middle and weak squeeze. If someone interested, TTM_Squeeze is not completely John Carter's invention. Concept of squeeze is commonly known as well as the method of squeeze search using Bollinger Bands and Kelthner Channels. How to use
As always there is a lot of variations. For example here is simple strategy Us
FREE

The indicator determines the ATR value (points) in a classic way (taking into calculation paranormal bars/candles) and more correctly - ignoring paranormal movements of the Instrument. Correctly it is excluding paranormal bars from the calculation, extremely small bars (less than 5%( customizable ) of the standard ATR) and extremely large bars (more than 150% ( customizable ) of the standard ATR) are ignored. This is a Extended version - allows you to set calculation parameters a
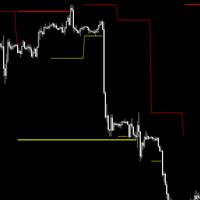
## Check screenshots to see proof that this indictor is a must! ##
Do you hate having to have a Monthly, Weekly, Daily chart when looking at your lower timeframes? I hated it too, so I made this. It will show you the High and Low of other timeframes on your chart, so you will always be aware where some support/resistance may be! Even on the 1 minute chart!
I recommend you use it 3 times, one with Day, Week and Month selected with different line widths.
I use this on every chart I look at
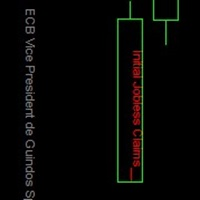
This is one of the most powerful indicators I've ever made.
I was tired of looking at other windows/websites for economical news, and regularly something would happen without me realising.
So I made this indicator which displays all news at the exact time of arrival, directly on the charts!
Now you too can just focus on the charts and know that you won't miss any news events.
There are options:
1. You can choose to display on the price line, or at the bottom of the chart. 2. You can
This is one of my most important indicators. Did you ever miss the session open/close? I did, which is why I made this indicator. It took a long time to get this right, since depending on your platform and timezone, it can be incorrect. It should be accurate for everyone now. It takes into account Daylight savings for NY and EU timezones, and should just work like magic on your charts.
The Boom300 Spike Indicator is a powerful tool designed to identify significant price spikes in the market.
Key Features: Real-time Spike Detection: The indicator continuously scans the market for sudden spikes in price action, providing timely alerts when significant spikes occur. And recommend to use the 1Min chart Customizable Alerts: Traders can customize alerts to suit their preferences, including audible alerts, email notifications, and push notifications to mobile devices. User-Friend

Description: The Spike Sniper Crash Market Indicator is a sophisticated tool designed to identify and navigate volatile market conditions, often associated with sudden price spikes and market crashes. Leveraging advanced algorithms and technical analysis, this indicator serves as a vigilant guardian, alerting traders to potential market disruptions and providing actionable insights to mitigate risks and capitalize on opportunities. Key Features: Precision Spike Detection: The indicator employs c
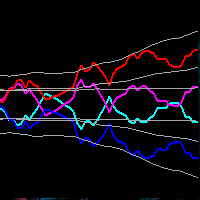
This indicator obeys the popular maxim that: "THE TREND IS YOUR FRIEND" Channel indicators incorporate volatility to capture price action. The Bollinger Bands is widely used, however, there are other options to capture swing action opportunities. Each study you will find here is unique, and reveals different types of price action.
https://www.mql5.com/en/market/product/116256
https://www.mql5.com/en/market/product/115553

This is the MT5 version of Ku-Chart.
This is an indicator devised by Ku-chan, a famous Japanese trader, based on the dealings of Lehman Brothers' discretionary traders. Unify the measuring stick of currencies to display the true value of currencies.
Although it is an indicator, it does not use a buffer and is displayed using objects such as trend lines. Also, instead of drawing on the subchart, it is drawn in an area far above the current price of the main chart, so you can switch from the

Introduction
"Smart money" is money invested by knowledgeable individuals at the right time, and this investment can yield the highest returns.
The concept we focus on in this indicator is whether the market is in an uptrend or downtrend. The market briefly takes a weak and reversal trend with "Minor BoS" without being able to break the major pivot.
In the next step, it returns to its main trend with a strong bullish move and continues its trend with a "Major BoS". The "order bloc
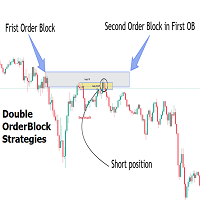
Introduction
The Price Action, styled as the "Smart Money Concept" or "SMC," was introduced by Mr. David J. Crouch in 2000 and is one of the most modern technical styles in the financial world. In financial markets, Smart Money refers to capital controlled by major market players (central banks, funds, etc.), and these traders can accurately predict market trends and achieve the highest profits.
In the "Smart Money" style, various types of "order blocks" can be traded. This indicator

Certainly! Let me introduce you to a powerful tool for MetaTrader 5 (MT5) that can automatically identify and draw support and resistance (S&R) levels on your trading charts. This tool is called the “Support and Resistance Levels Guru” . Support Resistance Levels Guru The Support & Resistance Indicator automatically displays essential S&R levels on your chart. These levels are crucial for technical analysis and are used by many traders. Resistance levels (zones) are shown in R ed , while suppo
FREE

Highly configurable Trader Dynamic Index (TDI) indicator.
Features: Highly customizable alert functions (at levels, crosses, direction changes via email, push, sound, popup) Multi timeframe ability (higher and lower timeframes also) Color customization (at levels, crosses, direction changes) Linear interpolation and histogram mode options Works on strategy tester in multi timeframe mode (at weekend without ticks also) Adjustable Levels Parameters:
TDI Timeframe: You can set the lower/higher
FREE

The Ultimate Trend and Reversals Detector The Ultimate Trend and Reversals Detector is a powerful tool designed to identify potential trend reversal zones in the financial markets. Here are the key features: Objective : Detect trend directions and reversals. Signal Colors : Green : Indicates a potential bullish trend reversal. Red : Signals a potential bearish trend reversal. Non-Repainting : The indicator’s signals are not redrawn, providing reliable information. Suitable for All Styles : Scal

Introduction
The "Smart Money Concept" transcends mere technical trading strategies; it embodies a comprehensive philosophy elucidating market dynamics. Central to this concept is the acknowledgment that influential market participants manipulate price actions, presenting challenges for retail traders.
As a "retail trader", aligning your strategy with the behavior of "Smart Money," primarily market makers, is paramount. Understanding their trading patterns, which revolve around supply

The indicator illustrates the divergence between the price movements of two financial instruments, such as EURUSD and GBPUSD or US500 and US30 or Gold and Silver. These divergences are plotted in the form of segments on the price chart of the dominant instrument. The dominant instrument refers to the one that exhibits a stronger bullish trend in the case of a bullish divergence, or a stronger bearish trend in the case of a bearish divergence. Investors are encouraged to independently seek correl
Você quer ter sucesso no mercado Forex? Nosso inovador indicador AI Swing Trading é a sua chave secreta para negociações lucrativas e bem-sucedidas. Apresentamos a você esta ferramenta única:
Nosso indicador está equipado com uma rede neural integrada que permite analisar grandes quantidades de dados, identificar mudanças e prever movimentos de preços. Esta tecnologia permite que você tome decisões comerciais informadas com base em análises de mercado aprofundadas. O algoritmo do indicado
O indicador RSI Pro Analyzer é uma ferramenta poderosa projetada para traders que buscam tomar decisões informadas em vários intervalos de tempo simultaneamente. Este indicador utiliza o RSI para fornecer sinais de sobrecompra, sobrevenda e tendência , facilitando a identificação de oportunidades de entrada no mercado. Sua principal vantagem é a facilidade de leitura graças aos códigos de cores claros e distintos para indicar as diferentes condições do mercado.
O indicador exibe valores RSI e

Indicador de Rastreamento de Tendência com Filtro de Média de Sinal de Entrada
Este indicador atua como um rastreador de tendência e filtro, utilizando médias móveis como sinais de entrada. As médias móveis são fundamentais para determinar diferentes horizontes de tendência:
- A média primária padrão de 200 períodos indica a tendência de longo prazo. - A média secundária de 50 períodos indica a tendência de médio prazo. - A média terciária de 20 períodos indica a tendência mais curta. - A m
FREE

O Heikin Ashi Delta PRO aproveita a refinada elegância dos candlesticks Heikin Ashi, conhecidos por sua capacidade de filtrar ruídos do mercado e destacar tendências e reversões mais claras. Construído sobre uma base sólida, este indicador avançado integra o método da Média Móvel de Hull, aprimorando sua precisão e responsividade. Junto com um sistema de alerta intuitivo, ele transforma os dados brutos do mercado em insights comerciais acionáveis, capacitando os traders a tomar decisões mais inf
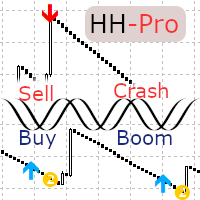
Finally, Harmonic Hybrid Pro is now available with numerous new features. It is highly recommended for utilization with Boom and Crash Synthetics. This tool generates a maximum of two orders per session and is designed to provide buy and sell signals in line with the current trend, effectively filtering out any superfluous signals. Users can optimize settings in the input section of the indicator properties. While the default configuration is suitable for Boon 500, adjustments may be necessary f

Do you want to know how an economic event will impact price? What will happen to price after the news? How has an economic news affected price in the past? This indicator can help you with that.
Do you like technical analysis? Do you enjoy studying the tick history to predict the future? But what do you think could be more important than technical analysis, what could improve technical analysis? Of course, it's fundamental analysis! After all, economic events directly impact the market, and t

Introducing the “Symbol Cost Info MT5” indicator – your ultimate tool for staying ahead in the forex market! This innovative indicator is designed to empower traders with real-time cost information, directly on their charts. Here’s why every trader needs the “Symbol Cost Info MT5” in their arsenal: Real-Time Spread Monitoring : Keep a close eye on the spread for any currency pair, ensuring you enter the market at the most cost-effective times. Pip Value at Your Fingertips : Instantly know the v
FREE
O Mercado MetaTrader oferece um local conveniente e seguro para comprar aplicativos para a plataforma MetaTrader. Faça download de versões de demonstração gratuitas de Expert Advisors e indicadores a partir do seu terminal para testes no Testador de Estratégia.
Teste os aplicativos em diferentes modos para monitoramento do desempenho e assim fazer um pagamento para o produto que você deseja, usando o sistema de pagamento MQL5.community.
Você está perdendo oportunidades de negociação:
- Aplicativos de negociação gratuitos
- 8 000+ sinais para cópia
- Notícias econômicas para análise dos mercados financeiros
Registro
Login
Se você não tem uma conta, por favor registre-se
Para login e uso do site MQL5.com, você deve ativar o uso de cookies.
Ative esta opção no seu navegador, caso contrário você não poderá fazer login.