Conheça o Mercado MQL5 no YouTube, assista aos vídeos tutoriais
Como comprar um robô de negociação ou indicador?
Execute seu EA na
hospedagem virtual
hospedagem virtual
Teste indicadores/robôs de negociação antes de comprá-los
Quer ganhar dinheiro no Mercado?
Como apresentar um produto para o consumidor final?
Novos Indicadores Técnicos para MetaTrader 5 - 5

ATREND: Como Funciona e Como Usá-lo #### Como Funciona O indicador "ATREND" para a plataforma MT5 é projetado para fornecer aos traders sinais robustos de compra e venda, utilizando uma combinação de metodologias de análise técnica. Este indicador aproveita principalmente o Intervalo Verdadeiro Médio (ATR) para medir a volatilidade, juntamente com algoritmos de detecção de tendências para identificar possíveis movimentos de mercado. Deixe uma mensagem após a compra e receba um brinde especial.

Indicador Heiken Ashi MT5 Eleve sua análise de mercado com o Indicador Heiken Ashi MT5. Esta poderosa ferramenta transforma os dados de preços padrão em velas mais suaves, focadas em tendências, facilitando a identificação de tendências de mercado e potenciais pontos de reversão. Características principais: Identificação clara de tendências: Distingue visualmente entre tendências de alta e baixa com cores de velas distintas. Redução de ruído: Filtra as flutuações de preços, proporcionando uma v
FREE

Bem-vindo ao HiperCube Renko Velas
Este indicador fornece informações reais do mercado e transforma-o em Renko Candle Style.
Definição Os gráficos Renko são um tipo de gráfico financeiro que mede e traça as variações de preços, utilizando tijolos (ou barras) para representar os movimentos de preços. Ao contrário dos gráficos de velas tradicionais, os gráficos Renko não exibem informações baseadas no tempo, concentrando-se apenas nas flutuações de preços.
Funcionalidades: Indicador em jan
FREE

Indicador Financeiro SolarTrade Suite: Comet Market Indicator - O seu guia de confiança no mundo dos mercados financeiros!
Este é um indicador de período que utiliza algoritmos especiais inovadores e avançados para calcular o seu valor, e também possui um design agradável e funções adicionais.
É muito fácil compreender as leituras deste indicador: uma linha vertical verde é o início de um novo período. Como funções adicionais: - clique várias vezes na metade superior da janela principal do

O "HiperCube USD INDEX (DXY /USDX) " é um referencial financeiro que representa o desempenho de um grupo específico de ativos, como ações, obrigações ou mercadorias, com valores denominados em dólares norte-americanos. Estes índices ajudam os investidores a acompanhar e comparar o desempenho de determinados setores ou mercados ao longo do tempo. Ao ser expresso em dólares americanos, o índice fornece uma medida consistente para avaliar os investimentos, independentemente da moeda nativa ou da l
Indicador de Força da Moeda (Currency Strength Index - CSI) ANTES DE ATIVAR O INDICADOR, LEMBRE-SE DE CONFIGURAR "TRUE" PARA EXIBIR OS PARES O Indicador de Força da Moeda (Currency Strength Index - CSI) é uma ferramenta poderosa usada no trading forex para medir a força relativa das principais moedas. Este indicador ajuda os traders a identificar as moedas mais fortes e mais fracas em determinado momento, permitindo tomar decisões de trading mais informadas. Principais Características: Análise

O SuperTrend é um dos indicadores técnicos mais eficazes e amplamente utilizados no trading, ideal para identificar a direção da tendência e gerar sinais de entrada e saída. Baseado na volatilidade e na tendência, este indicador adapta-se dinamicamente às condições de mercado, proporcionando uma referência visual clara para os traders. Principais Características: Detecção de Tendências: O SuperTrend segue a tendência do mercado, desenhando uma linha que se posiciona acima do preço em uma tendênc

Indicador "Fair Value Gap" (FVG) - Descubra o Poder das Descontinuidades de Mercado O mundo do trading está repleto de oportunidades ocultas, mas somente aqueles que possuem as ferramentas certas conseguem identificá-las e aproveitá-las de forma eficaz. O nosso Indicador FVG foi projetado para ajudá-lo a fazer exatamente isso. Se você é um trader que busca aprimorar sua capacidade de leitura do mercado e identificar os melhores pontos de entrada e saída, o Indicador FVG é o seu aliado perfeito.
O que é o "Schaff RSX"? O "Schaff RSX" combina a eficácia do Índice de Força Relativa (RSX) com a precisão do Ciclo Schaff, criando um indicador único que ajudará você a identificar com facilidade os melhores momentos para entrar e sair do mercado. É como ter um radar que detecta oportunidades de trading escondidas, dando a você uma vantagem competitiva que outros traders simplesmente não podem ignorar. Por que Escolher o "Schaff RSX"? Simplicidade Visual Clara e Intuitiva : As cores e linhas do

Bem-vindo ao HiperCube VIX
Este indicador fornece uma informação real de mercado de volume de sp500 / us500
Definição O HiperCube VIX, conhecido como Índice de Volatilidade CBOE, é uma medida amplamente reconhecida do medo ou do stress do mercado. Assinala o nível de incerteza e volatilidade no mercado bolsista, utilizando o índice S&P 500 como proxy para o mercado alargado. O Índice VIX é calculado com base nos preços dos contratos de opções no índice S&P 500.
Funcionalidades: Cores p
FREE

Bem-vindo ao HiperCube DonChian
Este indicador fornece informações úteis sobre o preço, mostrando se o preço é suscetível de aumentar ou diminuir.
Funcionalidades: Indicador nas janelas principais Personalize as cores das suas velas Período personalizado do indicador Definir parâmetros
Como interpretar: Tendência de alta: Se algumas velas subirem na faixa superior, significa que é possível que uma corrida de alta esteja a chegar. Tendência Donw: Se algumas velas caírem da banda inferior,

O Histograma ADX do HiperCube está aqui!
Estes indicadores ajudam-no a saber se poderia ser uma forte tendência no mercado. O ADX é um indicador muito popular e útil, pelo que muitos reconhecimentos dos principais comerciantes o utilizam como filtros para negociações más ou em combinações de outras análises. Com o HiperCube ADX será uma exoeriência premium usando uma bela e um grande indicador para a sua negociação.
FUNCIONALIDADES: Totalmente personalizável Personalizar a sua tabela! Cor
FREE

Perfil do mercado do HiperCube!
Um Perfil de Mercado é uma representação gráfica que combina informações de preços e de tempo sob a forma de distribuição. Apresenta informações de preço na escala vertical (eixo y) e informações de volume na escala horizontal (eixo x). Este tipo de gráfico fornece informações sobre a atividade do mercado, permitindo que os comerciantes visualizem e avaliem o valor justo de mercado em tempo real.
Funcionalidades: Cores personalizadas Gráfico personalizado Cla
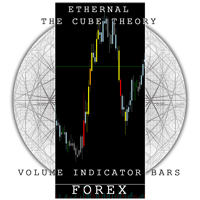
the cube bars forex é um indicador para meta trader 5 criado por mim Tomas Lekim para colorir os candles baseados nos picos de volumes dos grandes investidores do mercado forex . Ele rastreia os picos de compra e venda e pinta os candles de acordo com a quantidade de dinheiro investido pelos outros robos . É uma ferramenta poderosa contra os grandes robos porque identifica os momentos em que deve tomar decisoes . Pode ser configurado de acordo com o par de moedas que ira usar . Possui 4 cores di
Entry Confirmation Indicator for MT5: Precision Trading for Volatility Indices The Entry Confirmation Indicator for MetaTrader 5 (MT5) is a powerful and versatile tool tailored specifically for traders who focus on volatility indices. Whether you're looking to capitalize on trend continuations or identify key reversal points, this indicator is designed to provide clear and actionable signals that enhance your trading strategy. Targeted Instruments: A Focus on Volatility This indicator is optimiz

The utility draws pivot levels for the selected timefram in classic method. Pivot = (high + close + low) / 3 R1 = ( 2 * Pivot) - low S1 = ( 2 * Pivot) - high R2 = Pivot + ( high - low ) R3 = high + ( 2 * (Pivot - low)) S2 = Pivot - (high - low) S3 = low - ( 2 * (high - Pivot)) you can change the timeframe, colors and fontsize. also you can change the text for the levels.
Have fun and give feedback...
FREE
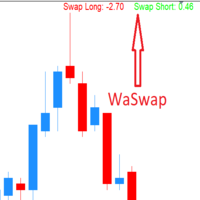
WaSwap MT5 Indicator shows the current Swap Long and current Swap Short with color.
* Set the Swap Threshold and the color to identify when the current swap is below or above the Spread Threshold.
* Set X axis and Y axis and chose the Corner and the Anchor to position the Swap Label on the chart.
* Write the font and the font size for more confort.
* Activate alert if the current Swap Long or the current Swap Short is below the swap threshold.
* The user will never swing with a negati
FREE

YOU CAN NOW DOWNLOAD FREE VERSIONS OF OUR PAID INDICATORS . IT'S OUR WAY OF GIVING BACK TO THE COMMUNITY ! >>> GO HERE TO DOWNLOAD
The Volatility Ratio was developed by Jack D. Schwager to identify trading range and signal potential breakouts. The volatility ratio is defined as the current day's true range divided by the true range over a certain number of days N (i.e. N periods). The following formula is used to calculate the volatility ratio: Volatility Ratio (VR) = Today's True Rang
FREE

The Market Structure Analyzer is a powerful tool designed for traders who follow market structure and smart money concepts. This comprehensive indicator provides a suite of features to assist in identifying key market levels, potential entry points, and areas of liquidity. Here's what it offers:
1. Swing High/Low Detection : Accurately identifies and marks swing highs and lows, providing a clear view of market structure.
2. Dynamic Supply and Demand Zones: Draws precise supply and demand zo
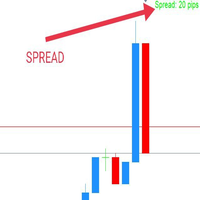
WaSpread MT5 Indicator shows the current spread in pips with color.
* Set the Spread Threshold and the color to identify when the current spread is below or above the Spread Threshold.
* Set X axis and Y axis and chose the Corner and the Anchor to position the Spread Label on the chart.
* Write the font and the font size for more confort.
* Activate alert if the current spread is above the spread threshold.
* For more precision, the user can choose to show the decimal numbers.
* The
FREE

Overview: The US Dollar Index (DXY) is a key financial indicator that measures the strength of the US Dollar against a basket of six major world currencies. This index is crucial for traders and investors as it provides a comprehensive view of the overall market sentiment towards the US Dollar and its relative performance. All Products | Contact Composition: The DXY's composition is as follows: Euro (EUR): 57.6% Japanese Yen (JPY): 13.6% British Pound (GBP): 11.9% Canadian Dollar (CAD): 9.1%
FREE

Breakthrough signal indicator for the MT5 platform: Your reliable assistant in the world of trading!
We are pleased to present you with an innovative signal indicator, which was created in collaboration with an outstanding mathematician. This indicator combines advanced algorithms and the best of the world of mathematical analysis, providing traders with a unique tool for predicting market movements.
Why is this indicator unique?
1 .Entry signals without redrawing If a signal appears, it

O indicador mostra o preço ou volume em milissegundos, ótimo para identificar padrões de entrada pela agressão do preço ou volume, e scalp rápido. Características Timeframe em milissegundos Oscilador de agressão no preço Tela customizável O indicador pode indicar movimento de entradas, sendo: Cruzamento com inclinação alta antes dos primeiros 500 ticks do gráfico Identificar padrões de ondas A velocidade da exibição do gráfico vai depender do seu hardware, quanto menor o milissegundos mais vai e
FREE
BBTrend is a powerful trend analysis tool designed to provide a clear overview of market volatility and trends at a glance.
This indicator calculates the difference between two Bollinger Bands of different periods,
visually indicating the strength of upward or downward trends to traders. Clear Trend Visualization: The upward trend is represented in green, and the downward trend in red,
allowing traders to intuitively grasp the direction and strength of the trend. Standardized Percentage D
FREE
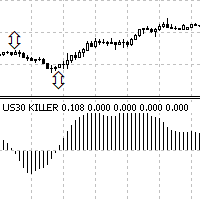
Us30 killer non repaint non repaint (means that the arrows that appear on the chart will not disappear or redraw). Us30 killer consists of 2 black arrows and a histogram. if black arrow appears above the current price look for selling opportunities ( See figure 3) if black arrow appears below current price look for buying opportunities. (See figure 3) The indicator works on all timeframes recommended is M5 TO Monthly Timeframe.

Adjustable Consecutive Fractals looks for 2 or more fractals in one direction and sends out a on screen alert, sound alert and push notification, for strong reversal points .
Adjustable Consecutive Fractals, shows the fractals on chart along with a color changing text for buy and sell signals when one or more fractals appear on one side of price.
Adjustable Consecutive Fractals is based Bill Williams Fractals . The standard Bill Williams fractals are set at a non adjustable 5 bars, BUT withe
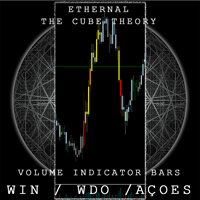
The Cube Bars Brasil pinta os candles de acordo com o volume , excelente para saber os picos de compra e venda . Pode ser regulado livremente pelo usario . Possui regulagem de parametro de entrada para que o usuario tenha a liberdade de regular o colume de acordo com o ativo que escolher . Possui 4 cores que diferenciam os candles de acordo com o tamanho do volume naquele instante
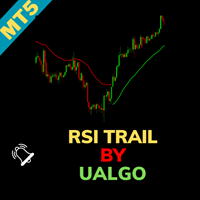
RSI Trail [UAlgo] Indicator for MetaTrader 5 The RSI Trail [UAlgo] indicator is a sophisticated technical analysis tool designed to enhance trading strategies by leveraging the Relative Strength Index (RSI) in conjunction with various moving average calculations. This indicator dynamically plots support and resistance levels based on RSI values, offering clear visual signals for potential bullish and bearish market conditions. Key Features:
Dynamic Support and Resistance Levels: The indicator
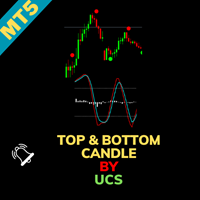
UCS_Top & Bottom Candle Indicator for MetaTrader 5 The UCS_Top & Bottom Candle is an innovative experimental indicator designed for MetaTrader 5. Based on momentum, this indicator identifies the top and bottom candles for most swing movements, assisting traders in making precise market entries and exits. Key Features: Momentum-Based Analysis: Utilizes momentum to detect the top and bottom candles for swing trading opportunities. Customizable Settings: Percent K: Set the Percent K value (default
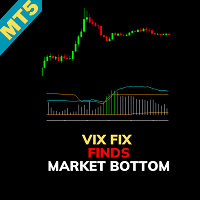
Indicator Name: CM_Williams_Vix_Fix Finds Market Bottoms Overview: The CM_Williams_Vix_Fix Finds Market Bottoms indicator is an advanced tool designed to identify market reversal points across various asset classes. Inspired by the original work of Larry Williams, this indicator provides similar insights to the VIX for stock indices but with the added flexibility of functioning effectively across all asset types. Key Features: Versatility Across Asset Classes: Unlike traditional indicators that

O Indicador foi desenvolvido para a bolsa Brasileira, identificando a relação do Índice com a soma dos principais ativos do IBOV, também funciona para qualquer mercado do mund o, possui um oscilador WPR com a soma dos principais ativos escolhidos, indicando a antecipação do movimento em relação ao Índice. Características WPR com a soma dos papéis escolhidos - branco WPR do papel atual - vermelho Canal de Tendência O indicador pode indicar movimento de entradas, sendo: cruzamento das linhas cruz
FREE

Session Average Date Range: Analyze and average the low - high of specific trading sessions within custom date ranges, offering insights into price movements and market behavior over selected periods. The "Session Average Date Range" tool is an advanced analytical utility designed to empower traders and analysts by allowing them to dissect and evaluate the high and low range of specific trading sessions within a user-defined date range. This tool provides a flexible and precise approach to analy
FREE

Enhance Your Trading with Buraq Bars Indicator! Take your trading to the next level with Buraq Bars ! This easy-to-use indicator draws bars on your chart whenever the RSI (Relative Strength Index) crosses above or below the levels you choose, giving you clear signals to help you trade better. Key Features: Set Your Own RSI Levels: Choose the levels for overbought and oversold that work best for you. Clear Visual Signals: Bars appear on your chart when the RSI crosses your levels, making it easy
The Day Trading Price Pattern indicator is an indicator of entry points that searches for and displays Price Action system patterns on dozens of trading instruments and on all standard time frames: (m1, m5, m15, m30, H1, H4, D1, Wk, Mn). Show all the main Price Patterns are introduced in the Ebook Day Trading With Price Action - Galen Wood You won't never miss any potential trading setup.
Want to send all the signals to your Telegram Channel? Checkout this guide
Advantages
1. Patterns:
FREE

Introducing the Volume Order Blocks indicator, a game-changing tool designed for traders who demand precision and clarity in their market analysis. This advanced indicator not only identifies order blocks but also integrates crucial volumetric data, allowing you to gauge the strength of these blocks with unparalleled accuracy. MT4 version - https://www.mql5.com/en/market/product/121237/ Key Features of the Volume Order Blocks: Bullish & Bearish Order Blocks: Easily visualize and differentiat

Devido às manipulações Técnicas e Lógicas da Corretora, percorri um longo caminho para trazer este indicador traseiro que combina inúmeras estratégias que possuem as seguintes capacidades:
Identificação de tendências de mercado: compreenda a tendência geral do mercado.
Pontos de reversão: identifique potenciais pontos onde o mercado pode mudar de direção.
Pontos de entrada e saída: determine os momentos ideais para entrar e sair das negociações.
Para uma compreensão abrangente de como
Enhance Your Trading Strategies with the "Order Block" Indicator for MT4 Discover the "Order Block" Indicator: The "Order Block" Indicator for MT4 is designed to help you precisely identify order blocks in the market by marking the highs and lows of the order block candles. This powerful tool enables you to understand where large institutions place their orders, improving your ability to predict market movements. Key Features: Precise Order Block Detection: Automatically highlights the highs and

In the world of trading, the key to success lies in having the right tools at the right time. Our innovative Volume Profile indicator was developed with one goal in mind: to provide traders with unprecedented access to vital market activity information. This cutting-edge tool allows you to not only see where and when volumes are traded but also to understand market depth with clarity never seen before. Main Features: Temporal Flexibility: Set the analysis range up to 1800 minutes to perfectly ma

Maximize Your Trading Opportunities with the "Auto Trendlines" Indicator Discover the "Auto Trendlines" Indicator: "Auto Trendlines" is the essential tool for every technical trader. This indicator automatically plots trend lines, pinpointing support and resistance levels with surgical precision. It's ideal for those looking to capitalize on market breakouts and reversals. Key Features: Automatic Trendline Plotting: Identifies and draws crucial trend lines without manual intervention. Advanced C

Optimize Your Trading Decisions with the "autoFibo" Indicator Discover the "autoFibo" Indicator: "autoFibo" is the essential analysis tool for traders who want to fully leverage Fibonacci levels without the hassle of manual plotting. This indicator automates the Fibonacci retracement process, providing instant visual access to key support and resistance zones. Key Features: Automatic Fibonacci Retracement: Automatically plots Fibonacci levels, making it easy to identify support and resistance zo

Enhance Your Trading Performance with the "Better Volume" Indicator Discover the "Better Volume" Indicator: The "Better Volume" is the essential market volume analysis tool for traders aiming to stand out. It analyzes tick volumes with unprecedented accuracy, featuring an advanced moving average function (PERIOD_MA) and customizable buy and sell alerts. Key Features: Advanced Volume Analysis: Recognize volume peaks signaling crucial price movements. Intuitive Buy and Sell Alerts: Stay one step a

This indicator identifies and highlights market inefficiencies, known as Fair Value Gaps (FVG), on price charts. Using a custom algorithm, the indicator detects these areas of imbalance where the price moves sharply, creating potential trading opportunities. Indicator Parameters: Bullish FVG Color (clrBlue) : Color used to highlight bullish inefficiencies. The default value is blue. Bearish FVG Color (clrRed) : Color used to highlight bearish inefficiencies. The default value is red. Bullish FVG
FREE
Darvas Flow Indicator is a revolutionary trading indicator that combines the classic Darvas Box method with modern market flow analysis. Developed for serious traders, Darvas Flow offers a powerful and intuitive tool for identifying trading opportunities. Key Features:
Darvas Box Method Implementation: Darvas Flow automatically identifies Darvas boxes, allowing you to see crucial support and resistance levels. This helps in pinpointing optimal entry and exit points in your trades. Dynamic Flow
FREE

Limited Time Offer!
Take advantage of our 19% discount in celebration of our panel upgrade, now including Bias (1D, 4H, 1W). Buy now and boost your market analysis! Introducing the Smart Money Concepts (SMC) and Inner Circle Trader (ICT) Indicator , an advanced tool designed for professional traders seeking precision in their decisions. This indicator directly integrates the fundamental principles of SMC/ICT into your charts, providing clear and reliable visual signals to help you identify ke
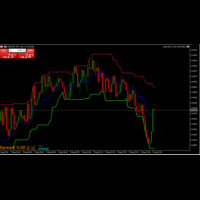
The Donchian Channel Indicator I created is a powerful tool for analyzing price trends and volatility. By plotting the highest high and lowest low over a specified period, it helps identify potential breakout opportunities and trend reversals. This indicator is valuable for traders seeking to understand market dynamics and make informed decisions based on price movements. Its simplicity and effectiveness make it an essential addition to any trading strategy.
FREE
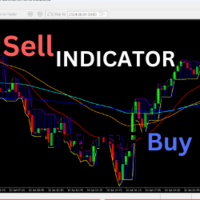
Welcome to a highly versatile and customizable trading indicator designed to elevate your trading strategy. This indicator integrates four moving averages (MAs) and order blocks, providing you with a powerful tool for market analysis and decision-making. Key Features: Four Moving Averages (MAs): This indicator allows you to utilize up to four different moving averages simultaneously. You can adjust each MA's period, color, and style to tailor the indicator to your specific trading needs. Whether
FREE
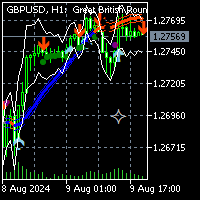
To get access to MT4 version please click here . This is the exact conversion from TradingView: " SSL Hybrid" by Mihkel00.
This is a light-load processing and non-repaint indicator. All input options are available. Buffers are available for processing in EAs. You can message in private chat for further information/changes you need. Thanks for downloading

DTFX Algo Zones are auto-generated Fibonacci Retracements based on market structure shifts.
These retracement levels are intended to be used as support and resistance levels to look for price to bounce off of to confirm direction.
USAGE Figure 1 Due to the retracement levels only being generated from identified market structure shifts, the retracements are confined to only draw from areas considered more important due to the technical Break of Structure (BOS) or Change of Character

Session Box Indicator for MetaTrader 5
Description: The SessionBox indicator is designed to visually represent the trading sessions on a chart, specifically the Asian, European, and American sessions. This indicator draws customizable rectangles around each session, allowing traders to easily identify different trading periods. It also includes labels to denote each session, enhancing clarity.
Users only need to input the session start and end hours in their server time. Please note, the As
FREE
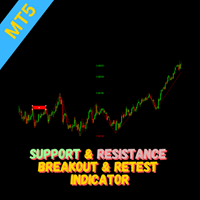
Overview The Breakout and Retest indicator is designed to identify potential trading opportunities by detecting price breakouts from significant support and resistance levels followed by a retest of the broken level. How it Works The indicator analyzes price data to determine key support and resistance areas. When the price decisively breaks through one of these levels and then retest it, then a potential breakout is signaled when it breakout again. To increase the probability of a successful t
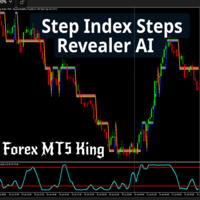
Unlock precision in your trading with the Step Index Steps Revealer AI . This advanced MT5 indicator is your ultimate tool for identifying key price levels on major forex pairs, including GBP/USD, EUR/USD, and others, as well as the step index
Key Features 1. Accurate Price Level Identification Plots precise key levels on major forex pairs like GBP/USD, EUR/USD, USD/JPY, and more. Ideal for traders looking to capitalize on bounce backs and breakouts with accuracy. 2. Optimized for Step Index C

Price and Spread Indicator
Version: 1.0 Developer: Creative Tech Solutions Website: https://www.creativetechsolutions.co.uk
Overview The Price and Spread Indicator is a great tool for MetaTrader 5 that displays the Ask and Bid prices along with the spread directly on the chart. This indicator provides real-time updates and allows traders to make informed decisions based on accurate price information.
Features - Real-time Price Updates: Continuously updates Ask and Bid prices. - Spread D
FREE
MT5用 サブウィンドウにスプレッドとBUY SWAP(BS)とSELL SWAP(SS)を表示するインジケーターです。
表示の文字フォントの大きさと色の設定、スプレッドの表示をPIPS表示もしくはPOINTS表示切替が可能ですので、チャートの色設定などに合わせて、お好みでご利用いただけます。 サブウィンドウの表示サイズに合わせて、その中央に表示するようになっています。
(ご協力お願いします!) こちらは無料でご利用いただけます。どうぞご自由にご利用ください。 もしよければ MS High Low indicator も紹介していますので、どうぞご参照の上、DEMO版のダウンロードをお試しください!
Happy Trading :)
FREE
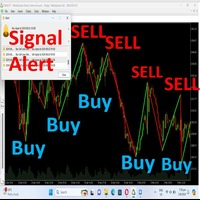
Hello Traders, *-For your bonus one indicator with SL,TP zone* just give your review, comment.Once finish developing I will give you**** Trend identification Indicator This is a indicator that will identify trend zone as bearish and bullish zone . This indicator can use for all pairs and any timeframe you can use it . *Green lime mean buy.Red line mean sell.You will receive alert sound when signal generate. The create best on high, low point and moving average calculation. You can customize valu
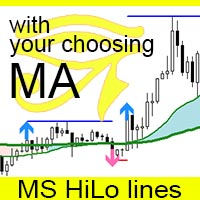
The MS High Low Lines indicator is a tool designed to enhance trend visualization for MT5. It displays high and low prices as lines, using your preferred Moving Average (MA) settings (either SMA or EMA, with customizable periods). The indicator shows configured signals when prices break above or below these MAs. By setting it up with highly functional MAs, traders can better understand market trends and make trades with a statistical edge. You can modify settings and place multiple indicators o

Para um download gratuito, junte-se ao nosso grupo. Oferta por tempo limitado! Apresentamos nosso inovador indicador MQL5, projetado para melhorar sua experiência de negociação fornecendo sinais visuais claros dos limites das velas diárias em timeframes menores. Esta ferramenta é perfeita para traders que desejam se manter informados sobre o progresso da vela diária, garantindo uma melhor tomada de decisões e execução de estratégias. Principais características Visualização da Caixa de Vela Diári

Introducing the BOOM CRASH MASTER Indicator: Unleash the Power of Precision Trading! Step into the world of unparalleled trading with the BOOM CRASH Master Indicator, exclusively designed for the Boom and Crash indices offered by Deriv broker. This cutting-edge tool is your gateway to mastering the art of spike detection and anti-spike entries, ensuring you stay ahead of the market’s every move. Key Features: Precision Spike Detection: Harness the power of advanced algorithms to catch spikes wi
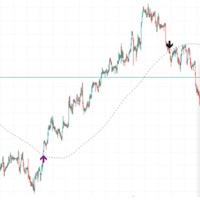
If the price is cutting above the slow length moving average, a breakout may occur. If the price is cutting below, a pullback may occur in the market. This was known for a long time, but there aren't many indicators which signal on the event. Candlestick pattern validation is also used in this indicator so that signals will not be drawn on doji candles or small "uncertainty" candles. The length of the moving average period can be defined by the user (default is 200). The number of price movement
FREE
The VSA Scanner Dashboard is a multi-symbol, multi-timeframe scanner that displays VSA signals. It is based on the Volume Plus and VSA Signals indicator. Features Displays the VSA signal of the last closed candle. Monitors 28 customizable instruments (symbols) and up to 21 timeframes at the same time. Easily arrange symbols in any order. Each signal has a tooltip that displays the name and time of appearance. Click on each signal to open a new chart. All types of alerts (sound, pop-up, email,

Fractals Aydmaxx 2024 Overview: Fractals Aydmaxx 2024 is a custom indicator designed for the MQL5 trading platform, developed by Aydmaxx. This indicator identifies and displays fractal patterns on your trading chart, which are essential for recognizing potential market reversals. The indicator highlights both bull and bear fractals, making it easier for traders to spot key levels of support and resistance. Features: Customizable Fractals: Allows the user to set the number of bars on the left and
FREE
CLICK HERE FOR A FREE DOWNLOAD AND LONG-LASTING PERFORMANCE This trading indicator Automatically identifies and plots contract blocks, which are essential zones marked by significant levels of support and resistance. This powerful tool provides traders with a clear and intuitive visualization of critical market points where prices are likely to bounce or reverse. The contract blocks, represented by distinct colored rectangles, highlight support zones (at the bottom) and resistance zones (at the
FREE
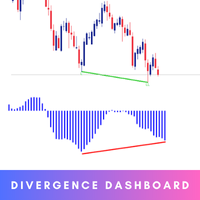
The Smart Divergence Dashboard is your ultimate tool for identifying high-probability trading opportunities. This cutting-edge indicator is meticulously designed to detect Regular Divergences, offering traders a clear and actionable advantage. MT4 Version - https://www.mql5.com/en/market/product/120702/ Key Features: Real-time Divergence Detection: Instantly pinpoints Higher High/Lower Low and Oscillator Higher Low divergences across multiple currency pairs and timeframes using Awesome Os
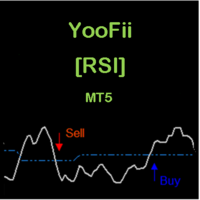
CONSTITUICAO YooFii [RSI] é um indicador constituído por um oscilador e um nível dinâmico. Através dos inputs pode-se ajustar o oscilador, o nível dinâmico e os sinais de alertas. Ele é projectado somente para a plataforma MT5. APLICACAO Este indicador, deve ser usado com um filtro de tendência [por exemplo duas medias moveis, MA 200 e MA 55] [veja os screen shots para mais detalhes]. quando o oscilador cruza o nivel dinâmico de baixo para cima, temos BULLISH move. quando o oscilador cruza o niv
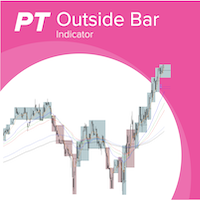
Outside bars (Außenstäbe) are important in professional price action trading and were made popular by Michael Voigt. Highs and lows of outside bars ( Aussenstäbe ) can be utilized as entry and exit for trades following different strategies. With combining different timeframes you can more easily detect the overall trend of the market, see potential resistance and support levels and also detect change in trend and framing of the market. Examples for strategies with inside bars (Innenstäbe) an

** All Symbols x All Timeframes scan just by pressing scanner button ** *** Contact me to send you instruction and add you in "Head & Shoulders Scanner group" for sharing or seeing experiences with other users. Introduction: Head and Shoulders Pattern is a very repetitive common type of price reversal patterns. The pattern appears on all time frames and can be used by all types of traders and investors. The Head and Shoulders Scanner indicator Scans All charts just by pressing
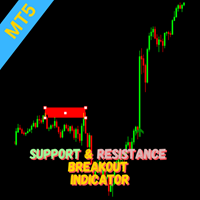
Indicator Overview This indicator utilizes the Zigzag indicator to identify potential support and resistance levels. When the price action breaks through one of these levels, a trading signal is generated. How it Works The Zigzag indicator is employed to pinpoint significant price highs and lows, forming potential support and resistance areas. A signal is triggered when the current candle closes beyond a previously established support or resistance level. Traders can consider entering a position

This indicator/dashboard , is place on a single symbol. It shows the percentage of movement withing all time frames from M1 to W1.The text will change green if all % are in the positive for a buy signal.The text will change red if all % are below zero and in negative for a sell signal. There are audible notifications, as well as on screen notifications along with push notifications that can be turned on and ON/OFF in the settings.
This is a sure way to Find trends quickly and efficiently, with
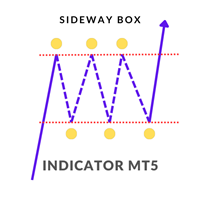
Sideway Box Indicator
The Sideway Box Indicator is an advanced trading tool designed to help traders identify and capitalize on sideways market conditions. This powerful indicator detects periods when the market is in a sideways (ranging) phase, providing traders with clear visual cues. Key Features
Sideways Market Detection : The Sideway Box Indicator accurately identifies sideways market conditions, allowing traders to recognize when the price is consolidating within a specific range. Buy/S

This MQL5 Speed Indicator script calculates the average speed of price movements for a selected financial instrument over a specified period. It uses the arithmetic mean to determine the average speed, which is computed by dividing the distance (change in price) by the time interval. The indicator then displays this value as a histogram in a separate window. Average Speed Calculation : The speed is calculated using the formula v = d t v = \frac{d}{t} v = t d , where d d d is the price differen
The "Order Block Indicator for MetaTrader 5" is an advanced trading tool designed to help traders identify key order block zones in the financial markets. Order blocks are areas of institutional buying and selling, often marking significant price levels where market reversals or continuations are likely to occur. This indicator provides a visual representation of these zones directly on the chart, enabling traders to make more informed trading decisions. Key Features: Accurate Order Block Identi
O Mercado MetaTrader é a única loja onde você pode baixar um robô demonstração de negociação gratuitamente para testes e otimização usando dados históricos.
Leia a visão geral e opiniões de outros clientes sobre os aplicativos, faça o download para o seu terminal e teste um robô de negociação antes de comprá-lo. Apenas no Mercado MetaTrader você pode testar um aplicativo de forma absolutamente gratuita.
Você está perdendo oportunidades de negociação:
- Aplicativos de negociação gratuitos
- 8 000+ sinais para cópia
- Notícias econômicas para análise dos mercados financeiros
Registro
Login
Se você não tem uma conta, por favor registre-se
Para login e uso do site MQL5.com, você deve ativar o uso de cookies.
Ative esta opção no seu navegador, caso contrário você não poderá fazer login.